- Manufacturing Statistics Current trends and challenges

Содержание
- 2. Are Manufacturing statistics still relevant? Often cited phrases: “Manufacturing activities are declining” “The share of manufacturing
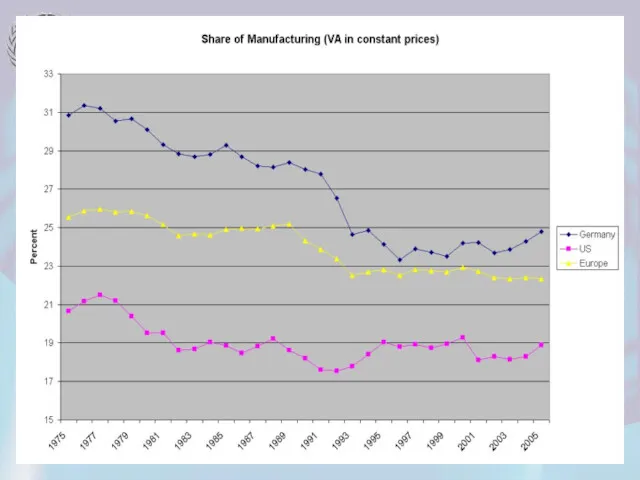
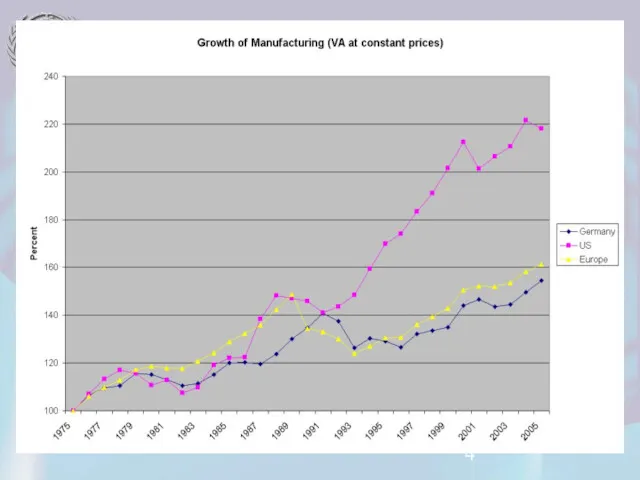
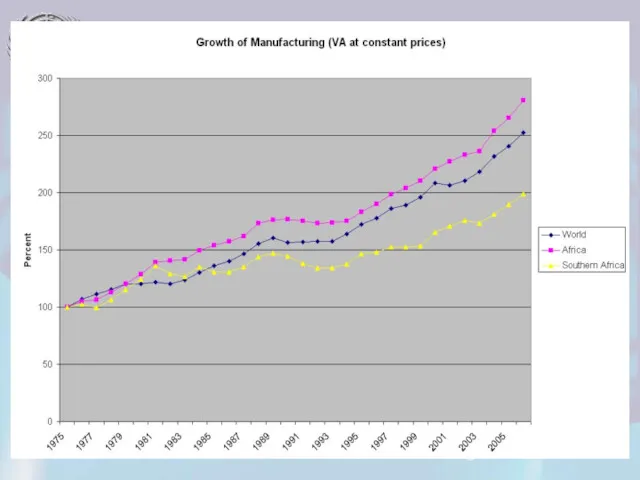
- 7. Are Manufacturing statistics still relevant? Manufacturing activities are growing worldwide While services play an increasing role
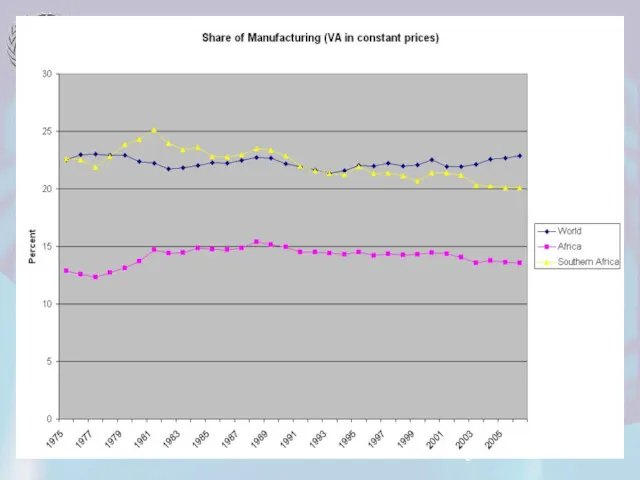
- 8. Are Manufacturing statistics still relevant? Manufacturing sector plays leading role for growth in most developing countries,
- 9. Are Manufacturing statistics still relevant? Not all manufacturing industries have high growth potential, therefore research and
- 10. Available statistics for manufacturing Data collection at the international level: General industrial statistics (number of establishments,
- 11. New Challenges Manufacturing technologies and methods of production have changed Manufacturing production has taken on a
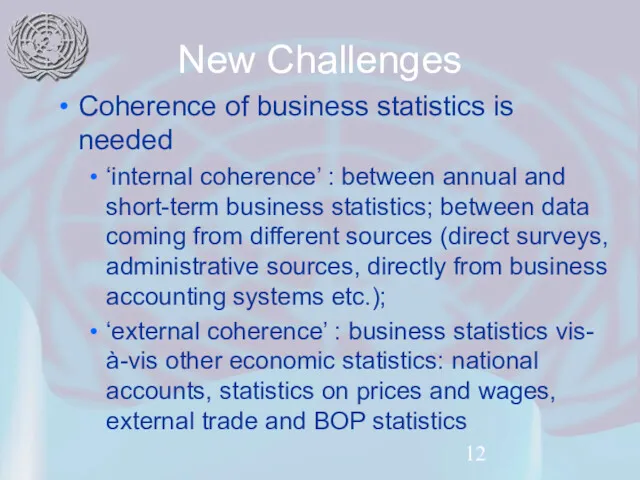
- 12. New Challenges Coherence of business statistics is needed ‘internal coherence’ : between annual and short-term business
- 13. We need a consistent approach to: Scope of manufacturing activities and products Detail of statistics required
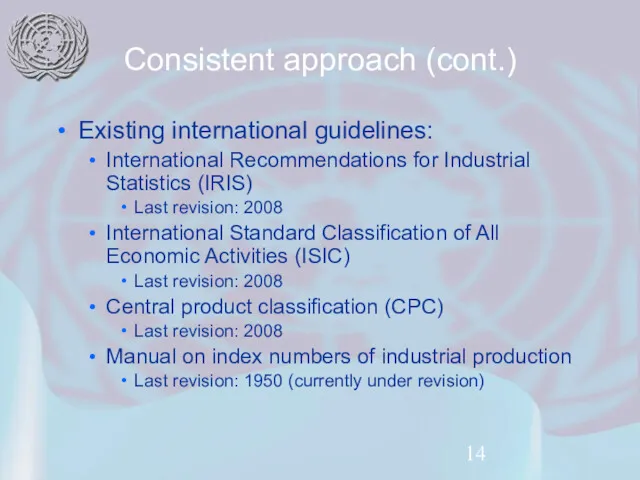
- 14. Consistent approach (cont.) Existing international guidelines: International Recommendations for Industrial Statistics (IRIS) Last revision: 2008 International
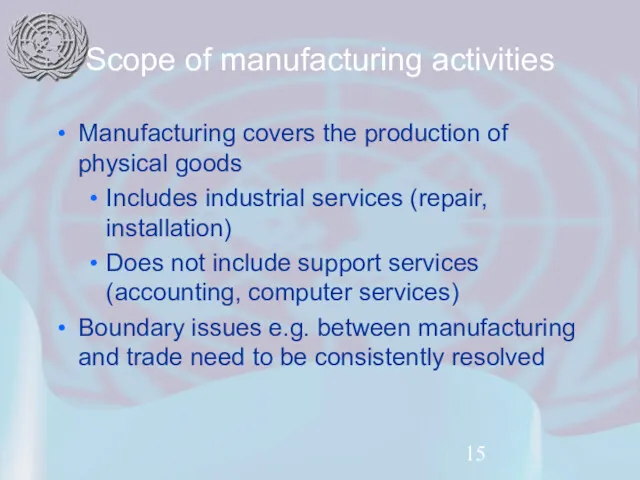
- 15. Scope of manufacturing activities Manufacturing covers the production of physical goods Includes industrial services (repair, installation)
- 16. Scope (cont.) Data collection should also cover SME (small and medium enterprises) for selected industries Some
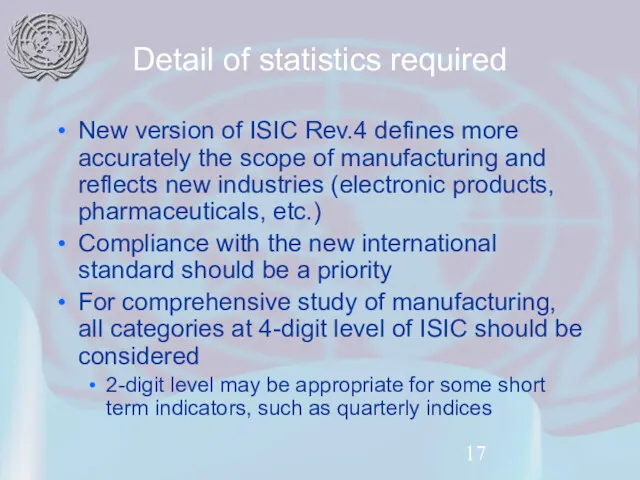
- 17. Detail of statistics required New version of ISIC Rev.4 defines more accurately the scope of manufacturing
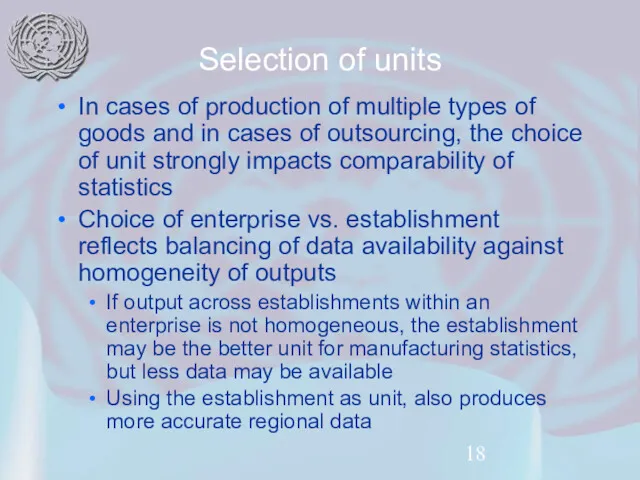
- 18. Selection of units In cases of production of multiple types of goods and in cases of
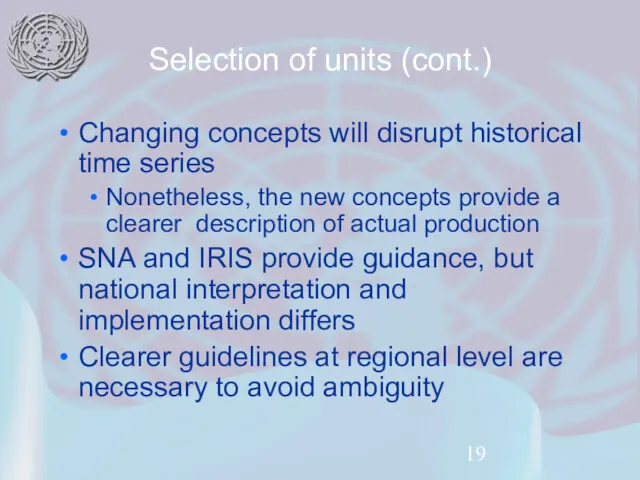
- 19. Selection of units (cont.) Changing concepts will disrupt historical time series Nonetheless, the new concepts provide
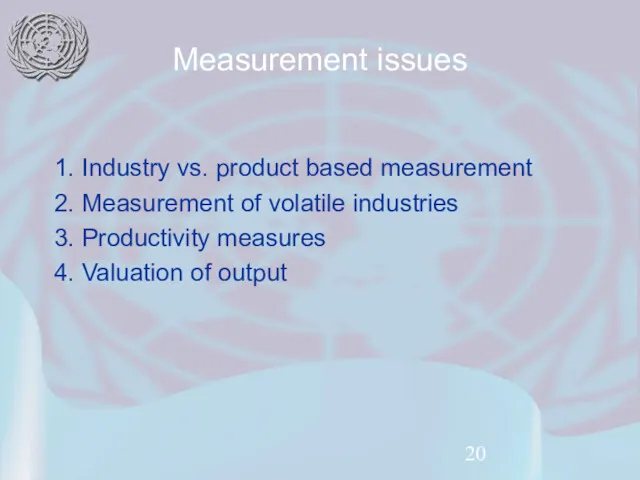
- 20. Measurement issues 1. Industry vs. product based measurement 2. Measurement of volatile industries 3. Productivity measures
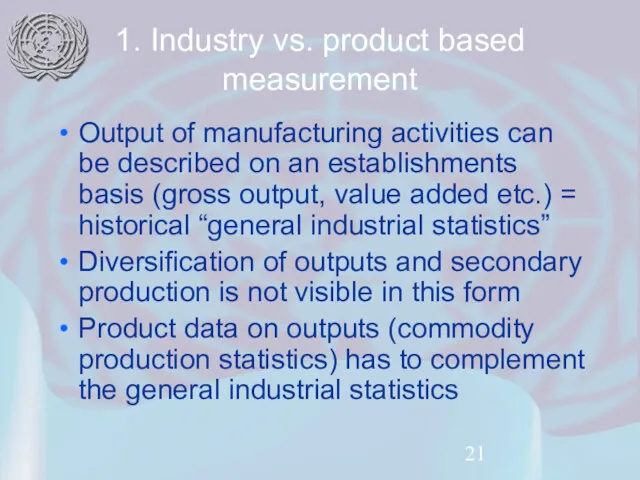
- 21. 1. Industry vs. product based measurement Output of manufacturing activities can be described on an establishments
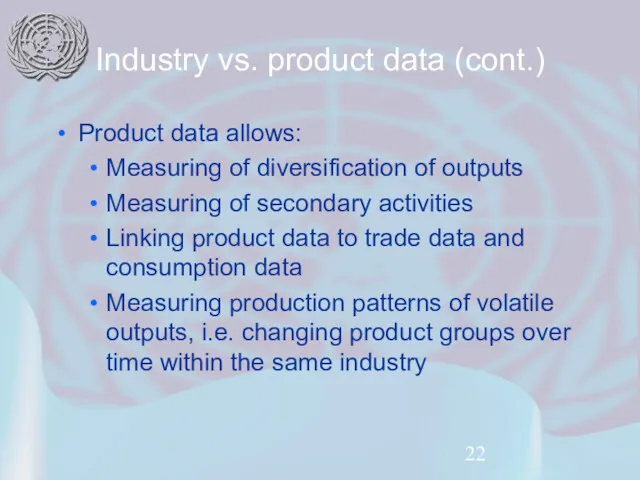
- 22. Industry vs. product data (cont.) Product data allows: Measuring of diversification of outputs Measuring of secondary
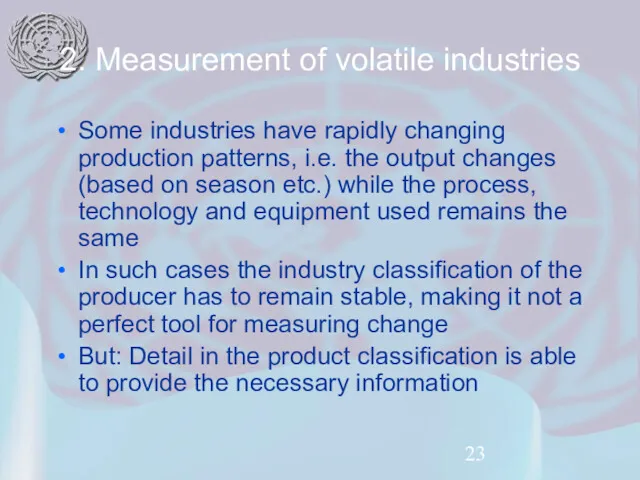
- 23. 2. Measurement of volatile industries Some industries have rapidly changing production patterns, i.e. the output changes
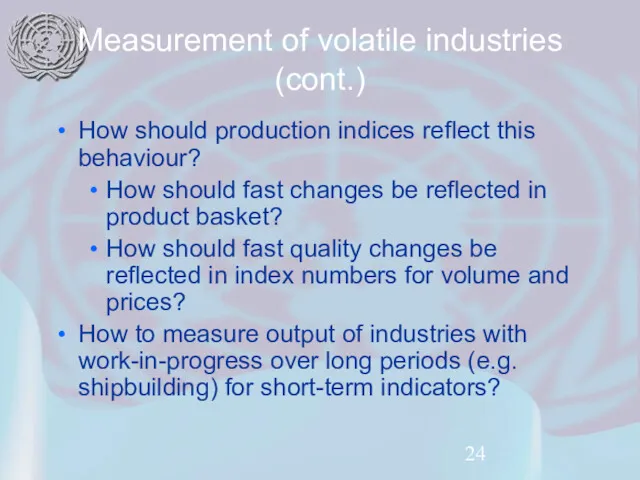
- 24. Measurement of volatile industries (cont.) How should production indices reflect this behaviour? How should fast changes
- 25. 3. Productivity measures Outsourcing of labour force affects calculation of productivity indicators (e.g. output/worker or output/hours
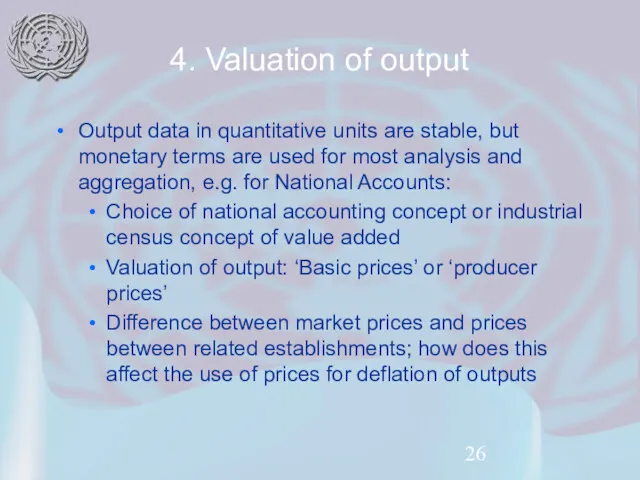
- 26. 4. Valuation of output Output data in quantitative units are stable, but monetary terms are used
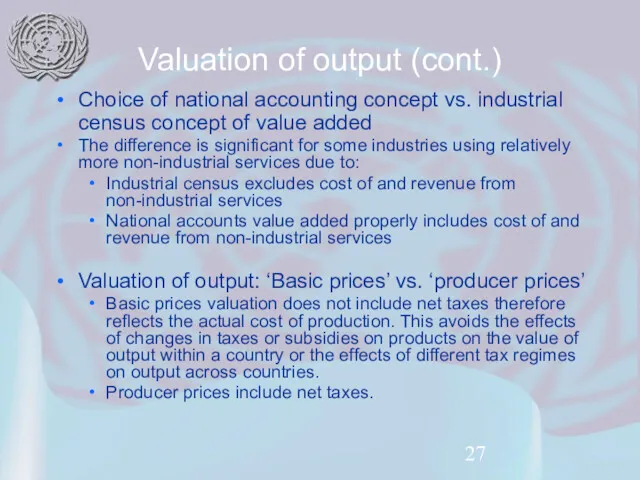
- 27. Valuation of output (cont.) Choice of national accounting concept vs. industrial census concept of value added
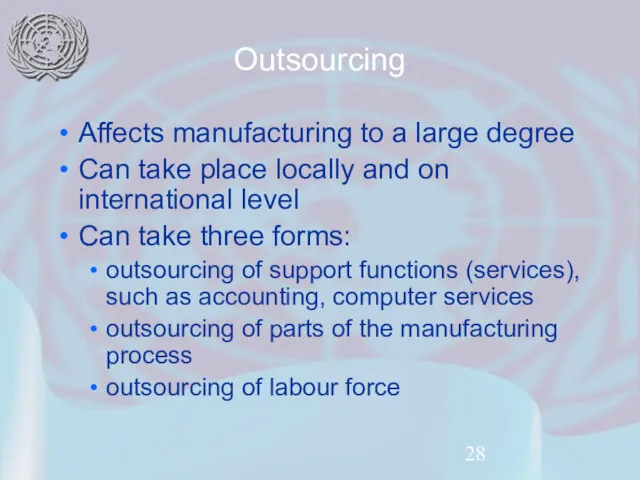
- 28. Outsourcing Affects manufacturing to a large degree Can take place locally and on international level Can
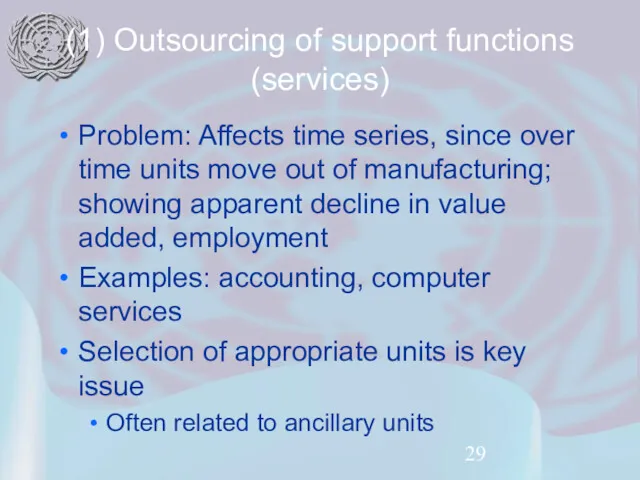
- 29. (1) Outsourcing of support functions (services) Problem: Affects time series, since over time units move out
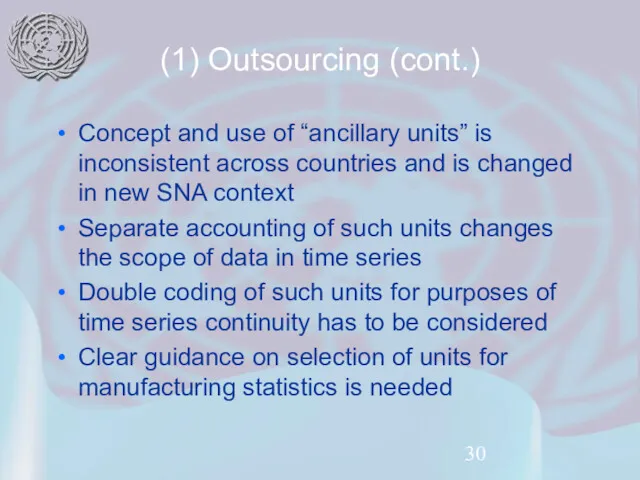
- 30. (1) Outsourcing (cont.) Concept and use of “ancillary units” is inconsistent across countries and is changed
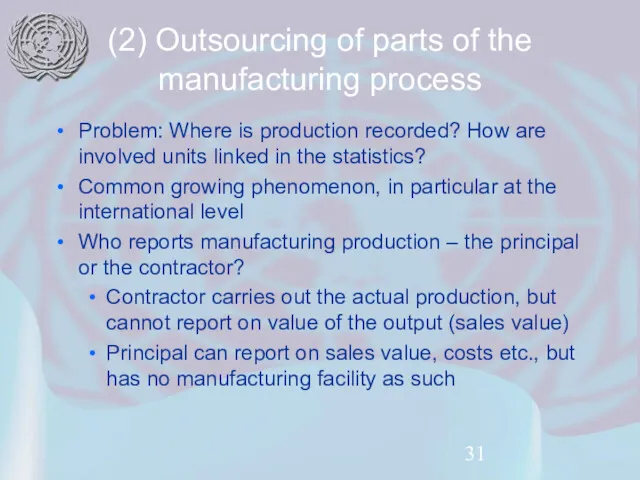
- 31. (2) Outsourcing of parts of the manufacturing process Problem: Where is production recorded? How are involved
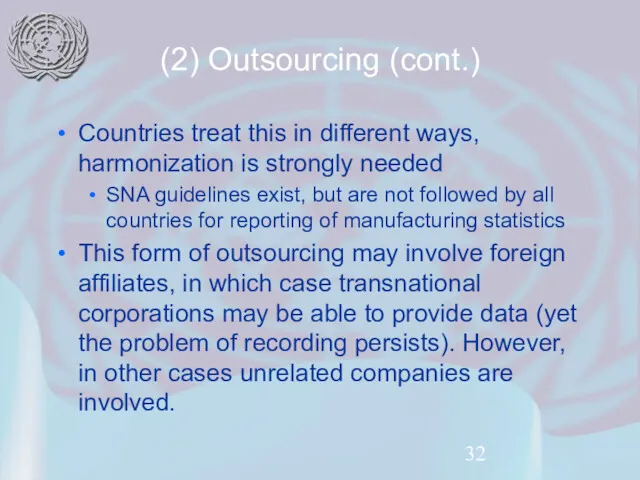
- 32. (2) Outsourcing (cont.) Countries treat this in different ways, harmonization is strongly needed SNA guidelines exist,
- 33. (3) Outsourcing of labour force Problem: Affects productivity statistics; employment in manufacturing declines Emergence of companies
- 34. (3) Outsourcing (cont.) Labour force is provided by independent company that charges a service fee for
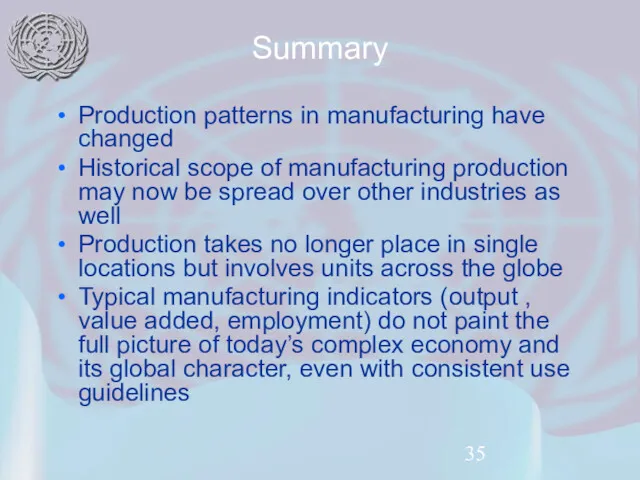
- 35. Summary Production patterns in manufacturing have changed Historical scope of manufacturing production may now be spread
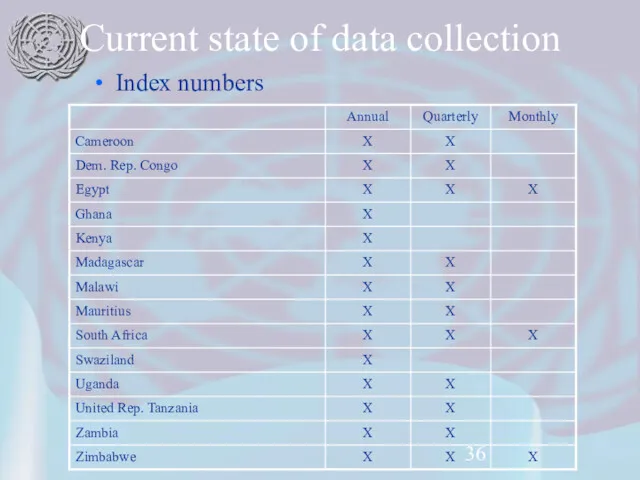
- 36. Current state of data collection Index numbers
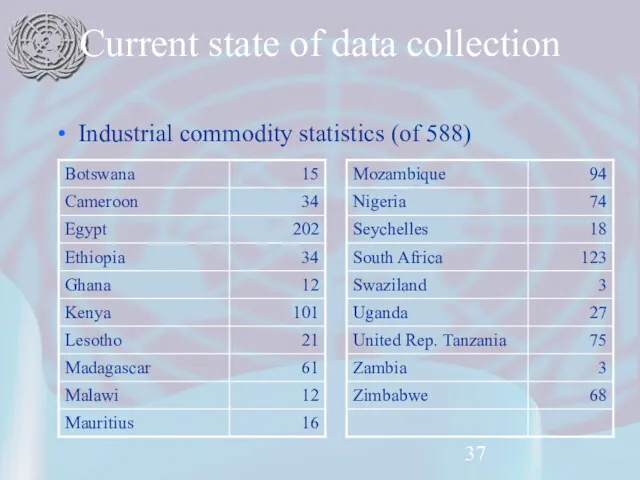
- 37. Current state of data collection Industrial commodity statistics (of 588)
- 39. Скачать презентацию
Are Manufacturing statistics still relevant?
Often cited phrases:
“Manufacturing activities are declining”
“The share
Are Manufacturing statistics still relevant?
Often cited phrases:
“Manufacturing activities are declining”
“The share
Are Manufacturing statistics still relevant?
Manufacturing activities are growing worldwide
While services play
Are Manufacturing statistics still relevant?
Manufacturing activities are growing worldwide
While services play
Are Manufacturing statistics still relevant?
Manufacturing sector plays leading role for growth
Are Manufacturing statistics still relevant?
Manufacturing sector plays leading role for growth
Are Manufacturing statistics still relevant?
Not all manufacturing industries have high growth
Are Manufacturing statistics still relevant?
Not all manufacturing industries have high growth
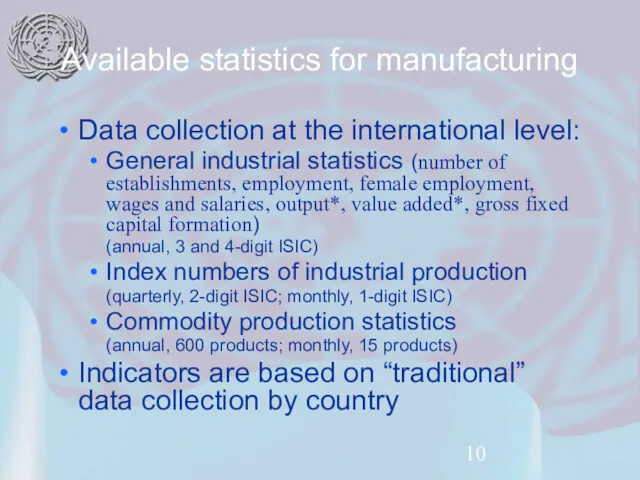
Available statistics for manufacturing
Data collection at the international level:
General industrial statistics
Available statistics for manufacturing
Data collection at the international level:
General industrial statistics
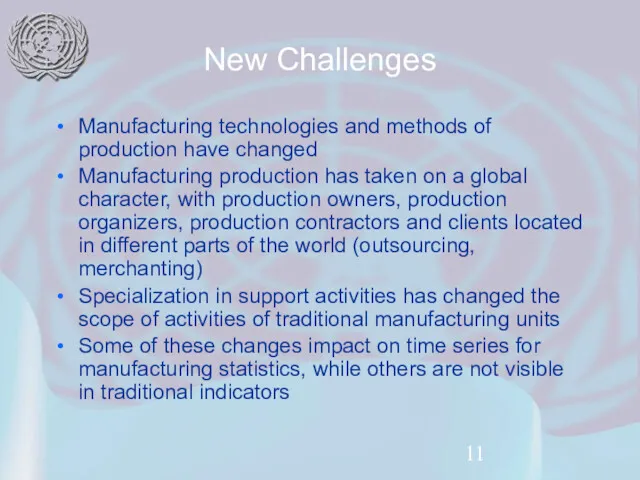
New Challenges
Manufacturing technologies and methods of production have changed
Manufacturing production
New Challenges
Manufacturing technologies and methods of production have changed
Manufacturing production
New Challenges
Coherence of business statistics is needed
‘internal coherence’ : between annual
New Challenges
Coherence of business statistics is needed
‘internal coherence’ : between annual
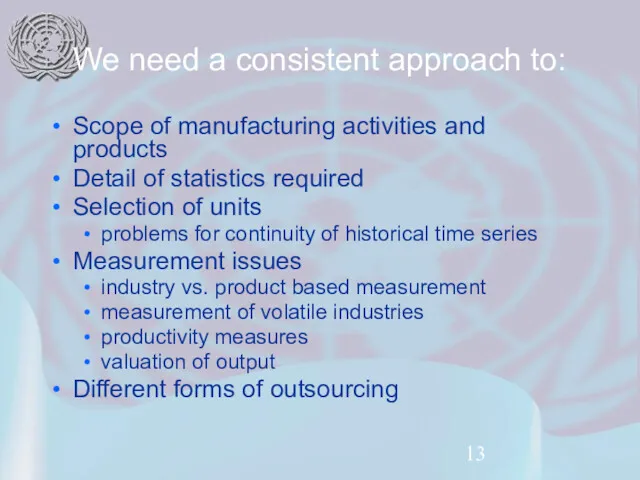
We need a consistent approach to:
Scope of manufacturing activities and products
Detail
We need a consistent approach to:
Scope of manufacturing activities and products
Detail
Consistent approach (cont.)
Existing international guidelines:
International Recommendations for Industrial Statistics (IRIS)
Last revision:
Consistent approach (cont.)
Existing international guidelines:
International Recommendations for Industrial Statistics (IRIS)
Last revision:
Scope of manufacturing activities
Manufacturing covers the production of physical goods
Includes industrial
Scope of manufacturing activities
Manufacturing covers the production of physical goods
Includes industrial

Scope (cont.)
Data collection should also cover SME (small and medium enterprises)
Scope (cont.)
Data collection should also cover SME (small and medium enterprises)
Detail of statistics required
New version of ISIC Rev.4 defines more accurately
Detail of statistics required
New version of ISIC Rev.4 defines more accurately
Selection of units
In cases of production of multiple types of goods
Selection of units
In cases of production of multiple types of goods
Selection of units (cont.)
Changing concepts will disrupt historical time series
Nonetheless, the
Selection of units (cont.)
Changing concepts will disrupt historical time series
Nonetheless, the
Measurement issues
1. Industry vs. product based measurement
2. Measurement of volatile industries
3.
Measurement issues
1. Industry vs. product based measurement
2. Measurement of volatile industries
3.
1. Industry vs. product based measurement
Output of manufacturing activities can be
1. Industry vs. product based measurement
Output of manufacturing activities can be
Industry vs. product data (cont.)
Product data allows:
Measuring of diversification of outputs
Measuring
Industry vs. product data (cont.)
Product data allows:
Measuring of diversification of outputs
Measuring
2. Measurement of volatile industries
Some industries have rapidly changing production patterns,
2. Measurement of volatile industries
Some industries have rapidly changing production patterns,
Measurement of volatile industries (cont.)
How should production indices reflect this behaviour?
How
Measurement of volatile industries (cont.)
How should production indices reflect this behaviour?
How

3. Productivity measures
Outsourcing of labour force affects calculation of productivity indicators
3. Productivity measures
Outsourcing of labour force affects calculation of productivity indicators
4. Valuation of output
Output data in quantitative units are stable, but
4. Valuation of output
Output data in quantitative units are stable, but
Valuation of output (cont.)
Choice of national accounting concept vs. industrial census
Valuation of output (cont.)
Choice of national accounting concept vs. industrial census
Outsourcing
Affects manufacturing to a large degree
Can take place locally and on
Outsourcing
Affects manufacturing to a large degree
Can take place locally and on
(1) Outsourcing of support functions (services)
Problem: Affects time series, since over
(1) Outsourcing of support functions (services)
Problem: Affects time series, since over
(1) Outsourcing (cont.)
Concept and use of “ancillary units” is inconsistent across
(1) Outsourcing (cont.)
Concept and use of “ancillary units” is inconsistent across
(2) Outsourcing of parts of the manufacturing process
Problem: Where is production
(2) Outsourcing of parts of the manufacturing process
Problem: Where is production
(2) Outsourcing (cont.)
Countries treat this in different ways, harmonization is strongly
(2) Outsourcing (cont.)
Countries treat this in different ways, harmonization is strongly

(3) Outsourcing of labour force
Problem: Affects productivity statistics; employment in manufacturing
(3) Outsourcing of labour force
Problem: Affects productivity statistics; employment in manufacturing

(3) Outsourcing (cont.)
Labour force is provided by independent company that charges
(3) Outsourcing (cont.)
Labour force is provided by independent company that charges
Summary
Production patterns in manufacturing have changed
Historical scope of manufacturing production may
Summary
Production patterns in manufacturing have changed
Historical scope of manufacturing production may
Current state of data collection
Index numbers
Current state of data collection
Index numbers
Current state of data collection
Industrial commodity statistics (of 588)
Current state of data collection
Industrial commodity statistics (of 588)
 Ұлттық экономика жүйе ретінде
 Kонцепция Бережливое производство
 Эластичность спроса, ее виды и причины существования
 Экономика (Я.Г.Г)
 Рыночная власть фирмы и ее оценочные показатели
 Социально-экономическое развитие и бюджеты регионов и муниципалитетов России
 Эффективное управление личным и семейным бюджетом
 Предпринимательство как фактор производства по Й. Шумпетеру
 Социальная политика государства
 Экономика. Своя игра
 Инвестиционный климат в России
 Подготовка к ЕГЭ по обществознанию
 Сущность сертификации, порядок, правила и формы
 Экономика ТО и предпринимательство
 Природные и трудовые ресурсы Азербайджана и их использование
 Методы оценки стоимости НИОКР на основе потребительской полезности
 Потребности и ресурсы. Общественное производство
 Распределение доходов
 Субъекты мировой экономики
 Analysis of graph centralities with help of Shapley values
 Unemployment
 Пути повышения экономической устойчивости предприятия ПАО Ростелеком
 Защита прав потребителей
 Комитет по сельскому хозяйству
 Сто семейных компаний под патронатом президента торгово-промышленной палаты РФ
 Диагностика состояния научно-технического потенциала региона с позиции обеспечения его экономической безопасности
 Роль малого бизнеса в развитии национальной экономики
 Market structure, market power, and welfare ( lecture 2 )