Слайд 2Supply and demand are the two words that economists use most often.
Supply and
demand are the forces that make market economies work.
Modern microeconomics is about supply, demand, and market equilibrium.
Слайд 3MARKETS AND COMPETITION
A market is a group of buyers and sellers of
a particular good or service.
The terms supply and demand refer to the behavior of people . . . as they interact with one another in markets.
Слайд 4MARKETS AND COMPETITION
Buyers determine demand.
Sellers determine supply
Слайд 5COMPETITIVE MARKETS
A competitive market is a market in which there are many buyers
and sellers so that each has a negligible impact on the market price.
Слайд 6COMPETITION: PERFECT AND OTHERWISE
Perfect Competition
Products are the same
Numerous buyers and sellers so that
each has no influence over price
Buyers and Sellers are price takers
Monopoly
One seller, and seller controls price
Слайд 7COMPETITION: PERFECT AND OTHERWISE
Oligopoly
Few sellers
Not always aggressive competition
Monopolistic Competition
Many sellers
Slightly differentiated products
Each seller
may set price for its own product
Слайд 8DEMAND
Quantity demanded is the amount of a good that buyers are willing and
able to purchase.
Law of Demand
The law of demand states that, other things equal, the quantity demanded of a good falls when the price of the good rises.
Слайд 9THE DEMAND CURVE: THE RELATIONSHIP BETWEEN PRICE AND QUANTITY DEMANDED
Demand Schedule
The demand
schedule is a table that shows the relationship between the price of the good and the quantity demanded.
Слайд 10THE DEMAND CURVE: THE RELATIONSHIP BETWEEN PRICE AND QUANTITY DEMANDED
Demand Curve
The demand
curve is a graph of the relationship between the price of a good and the quantity demanded.
Слайд 11MARKET DEMAND VERSUS INDIVIDUAL DEMAND
Market demand refers to the sum of all individual
demands for a particular good or service.
Graphically, individual demand curves are summed horizontally to obtain the market demand curve.
Слайд 12SHIFTS IN THE DEMAND CURVE
Change in Quantity Demanded
Movement along the demand curve.
Caused by
a change in the price of the product.
Слайд 13SHIFTS IN THE DEMAND CURVE
Consumer income
Prices of related goods
Tastes
Expectations
Number of buyers
Слайд 14SHIFTS IN THE DEMAND CURVE
Change in Demand
A shift in the demand curve, either
to the left or right.
Caused by any change that alters the quantity demanded at every price.
Слайд 15SHIFTS IN THE DEMAND CURVE
Consumer Income
As income increases the demand for a normal
good will increase.
As income increases the demand for an inferior good will decrease.
Слайд 16SHIFTS IN THE DEMAND CURVE
Prices of Related Goods
When a fall in the price
of one good reduces the demand for another good, the two goods are called substitutes.
When a fall in the price of one good increases the demand for another good, the two goods are called complements.
Слайд 17SUPPLY
Quantity supplied is the amount of a good that sellers are willing and
able to sell.
Law of Supply
The law of supply states that, other things equal, the quantity supplied of a good rises when the price of the good rises.
Слайд 18THE SUPPLY CURVE: THE RELATIONSHIP BETWEEN PRICE AND QUANTITY SUPPLIED
Supply Schedule
The supply
schedule is a table that shows the relationship between the price of the good and the quantity supplied.
Supply Curve
The supply curve is the graph of the relationship between the price of a good and the quantity supplied.
Слайд 19MARKET SUPPLY VERSUS INDIVIDUAL SUPPLY
Market supply refers to the sum of all individual
supplies for all sellers of a particular good or service.
Graphically, individual supply curves are summed horizontally to obtain the market supply curve.
Слайд 20SHIFTS IN THE SUPPLY CURVE
Input prices
Technology
Expectations
Number of sellers
Слайд 21SHIFTS IN THE SUPPLY CURVE
Change in Quantity Supplied
Movement along the supply curve.
Caused by
a change in anything that alters the quantity supplied at each price.
Change in Supply
A shift in the supply curve, either to the left or right.
Caused by a change in a determinant other than price.
Слайд 22SUPPLY AND DEMAND TOGETHER
Equilibrium refers to a situation in which the price has
reached the level where quantity supplied equals quantity demanded.
Слайд 23SUPPLY AND DEMAND TOGETHER
Equilibrium Price
The price that balances quantity supplied and quantity demanded.
On a graph, it is the price at which the supply and demand curves intersect.
Equilibrium Quantity
The quantity supplied and the quantity demanded at the equilibrium price.
On a graph it is the quantity at which the supply and demand curves intersect.
Слайд 24EQUILIBRIUM
Surplus
When price > equilibrium price, then quantity supplied > quantity demanded.
There is
excess supply or a surplus.
Suppliers will lower the price to increase sales, thereby moving toward equilibrium.
Слайд 25EQUILIBRIUM
Shortage
When price < equilibrium price, then quantity demanded > the quantity supplied.
There
is excess demand or a shortage.
Suppliers will raise the price due to too many buyers chasing too few goods, thereby moving toward equilibrium.
Слайд 26EQUILIBRIUM
Law of supply and demand
The claim that the price of any good adjusts
to bring the quantity supplied and the quantity demanded for that good into balance.
Слайд 27THREE STEPS TO ANALYZING CHANGES IN EQUILIBRIUM
Decide whether the event shifts the supply
or demand curve (or both).
Decide whether the curve(s) shift(s) to the left or to the right.
Use the supply-and-demand diagram to see how the shift affects equilibrium price and quantity.
Слайд 28THREE STEPS TO ANALYZING CHANGES IN EQUILIBRIUM
Shifts in Curves versus Movements along
Curves
A shift in the supply curve is called a change in supply.
A movement along a fixed supply curve is called a change in quantity supplied.
A shift in the demand curve is called a change in demand.
A movement along a fixed demand curve is called a change in quantity demanded.
Слайд 29SUMMARY
Economists use the model of supply and demand to analyze competitive markets.
In a
competitive market, there are many buyers and sellers, each of whom has little or no influence on the market price.
Слайд 30SUMMARY
The demand curve shows how the quantity of a good depends upon the
price.
According to the law of demand, as the price of a good falls, the quantity demanded rises. Therefore, the demand curve slopes downward.
In addition to price, other determinants of how much consumers want to buy include income, the prices of complements and substitutes, tastes, expectations, and the number of buyers.
If one of these factors changes, the demand curve shifts.
Слайд 31SUMMARY
The supply curve shows how the quantity of a good supplied depends upon
the price.
According to the law of supply, as the price of a good rises, the quantity supplied rises. Therefore, the supply curve slopes upward.
In addition to price, other determinants of how much producers want to sell include input prices, technology, expectations, and the number of sellers.
If one of these factors changes, the supply curve shifts.
Слайд 32SUMMARY
Market equilibrium is determined by the intersection of the supply and demand curves.
At
the equilibrium price, the quantity demanded equals the quantity supplied.
The behavior of buyers and sellers naturally drives markets toward their equilibrium.

 Наука и экономика. Наука и власть. Проблемы государственного регулирования науки
 Теорія відтворення
 Рынок ресурсов
 Энергетикалық ресурстартардың артықшылығы және кемшілігі
 Неоинстституциональная и Новая институцианальная экономика
 Роль государства в рыночной экономике. Актуальность
 Экономика Китая
 Международное разделение труда в мировом хозяйстве
 Экономический рост и развитие
 Альтернативные модели поведения фирмы
 Урок финансовой грамотности Кредиты
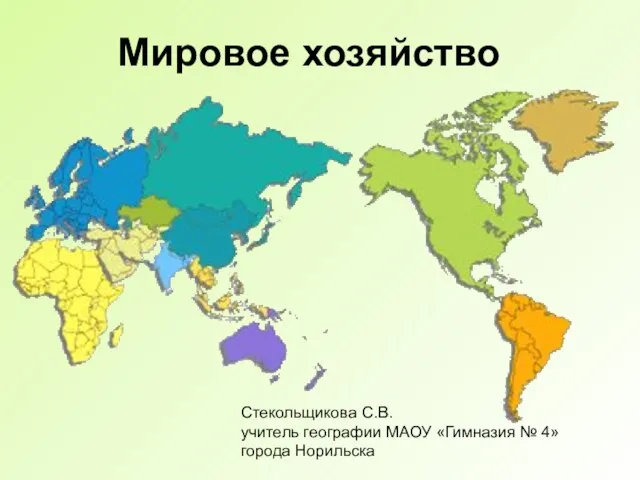 Мировое хозяйство
 Экономика стран Азиатско-тихоокеанского региона (АТР)
 Трудоустройство молодых специалистов
 Оцінка якості державної політики на шляху впровадження елементів корпоративної соціальної відповідальності
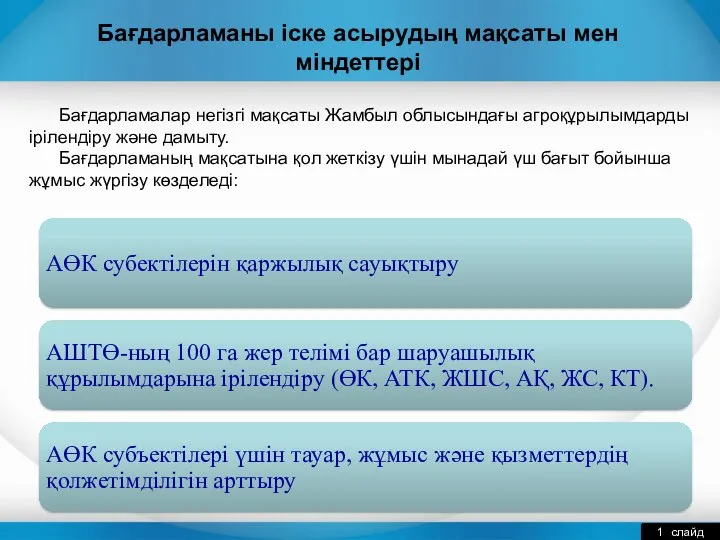 Бағдарламалар негізгі мақсаты Жамбыл облысындағы агроқұрылымдарды ірілендіру және дамыту
 Зарубежный опыт развития государственно-частного партнерства
 Формационный подход исторического развития
 Структурные особенности экономики России
 Наиболее острые проблемы в сферах демография и труд в городе Костроме
 Су энергетика қорлары
 Региональная политика, ее цели и инструменты. (Тема 8)
 Тенденции мировой экономики: глобальные вызовы и тренды
 Экономическое развитие России в XVIII веке. Народы России
 Ўқитишда модулли ёндашувнинг долзарблиги
 Российско-германское сотрудничество
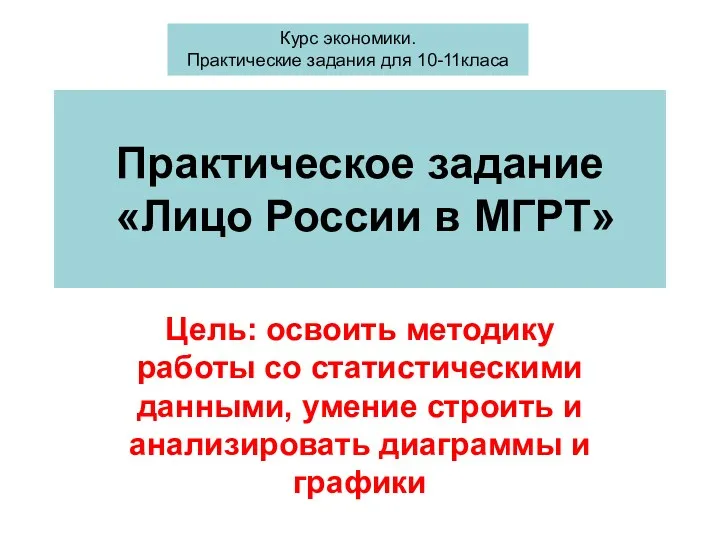 Практическое задание по экономике Лицо России в МГРТ
 Ауыл шаруашылығы