- The market forces of supply and demand

Содержание
- 2. The Market Forces of Supply and Demand
- 3. Supply and demand are the two words that economists use most often. Supply and demand are
- 4. A market is a group of buyers and sellers of a particular good or service. The
- 5. MARKETS AND COMPETITION Buyers determine demand. Sellers determine supply
- 6. Competitive Markets A competitive market is a market in which there are many buyers and sellers
- 7. Perfect Competition Products are the same Numerous buyers and sellers so that each has no influence
- 8. Oligopoly Few sellers Not always aggressive competition Monopolistic Competition Many sellers Slightly differentiated products Each seller
- 9. DEMAND Quantity demanded is the amount of a good that buyers are willing and able to
- 10. The Demand Curve: The Relationship between Price and Quantity Demanded Demand Schedule The demand schedule is
- 11. Catherine’s Demand Schedule
- 12. The Demand Curve: The Relationship between Price and Quantity Demanded Demand Curve The demand curve is
- 13. Figure 1 Catherine’s Demand Schedule and Demand Curve Copyright © 2004 South-Western Price of Ice-Cream Cone
- 14. Market Demand versus Individual Demand Market demand refers to the sum of all individual demands for
- 15. Shifts in the Demand Curve Change in Quantity Demanded Movement along the demand curve. Caused by
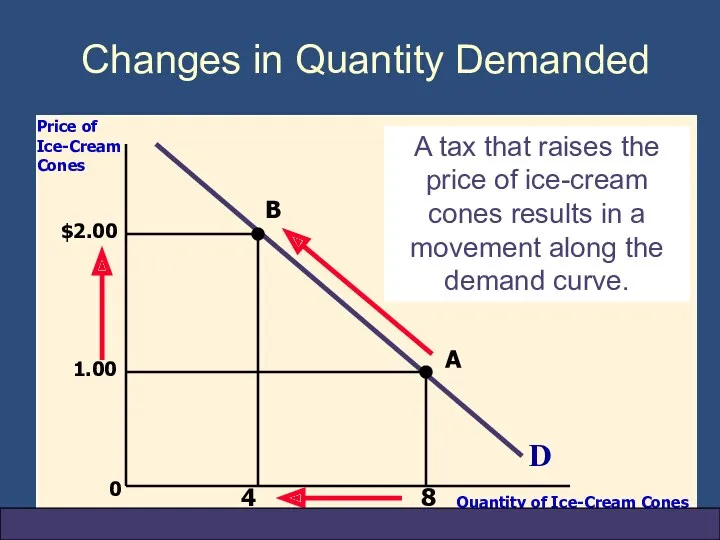
- 16. 0 D Price of Ice-Cream Cones Quantity of Ice-Cream Cones A tax that raises the price
- 17. Shifts in the Demand Curve Consumer income Prices of related goods Tastes Expectations Number of buyers
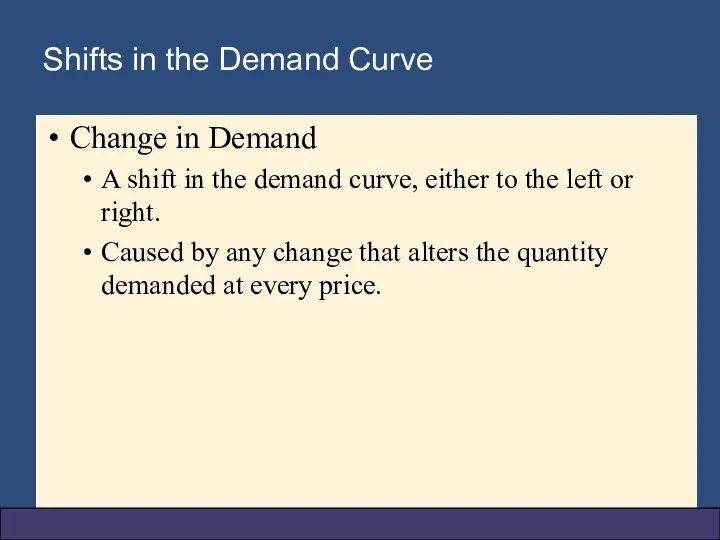
- 18. Shifts in the Demand Curve Change in Demand A shift in the demand curve, either to
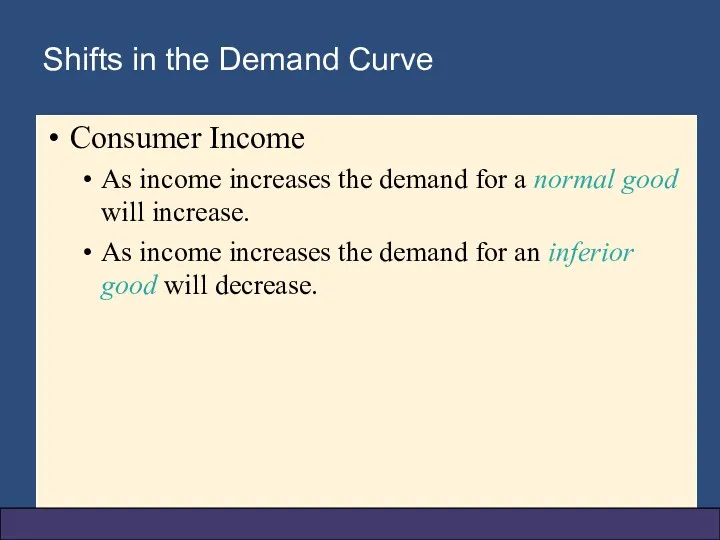
- 19. Shifts in the Demand Curve Consumer Income As income increases the demand for a normal good
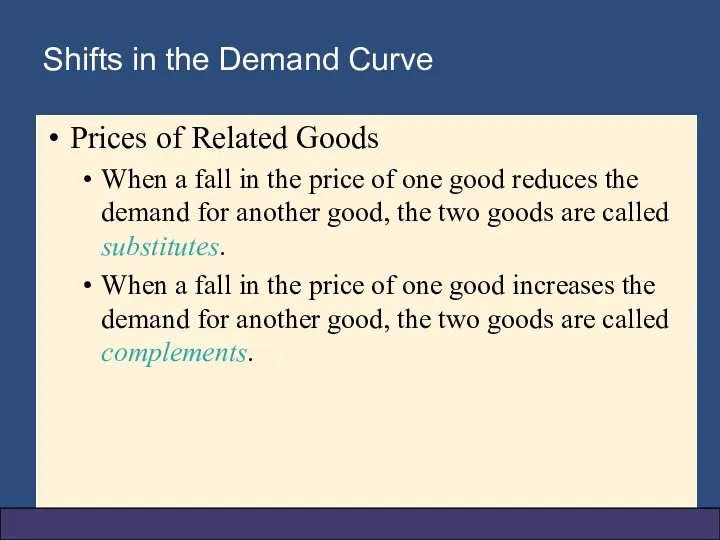
- 20. Shifts in the Demand Curve Prices of Related Goods When a fall in the price of
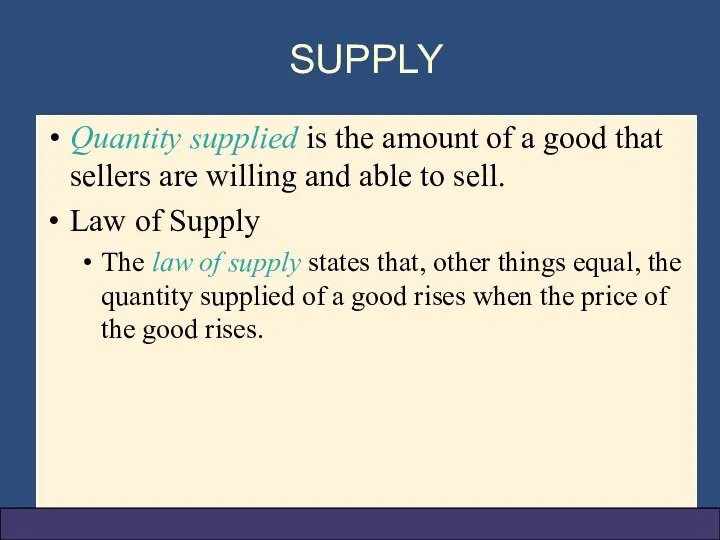
- 21. SUPPLY Quantity supplied is the amount of a good that sellers are willing and able to
- 22. The Supply Curve: The Relationship between Price and Quantity Supplied Supply Schedule The supply schedule is
- 23. The Supply Curve: The Relationship between Price and Quantity Supplied Supply Curve The supply curve is
- 24. Market Supply versus Individual Supply Market supply refers to the sum of all individual supplies for
- 25. Shifts in the Supply Curve Input prices Technology Expectations Number of sellers
- 26. Shifts in the Supply Curve Change in Quantity Supplied Movement along the supply curve. Caused by
- 27. Shifts in the Supply Curve Change in Supply A shift in the supply curve, either to
- 28. SUPPLY AND DEMAND TOGETHER Equilibrium refers to a situation in which the price has reached the
- 29. SUPPLY AND DEMAND TOGETHER Equilibrium Price The price that balances quantity supplied and quantity demanded. On
- 30. Equilibrium Surplus When price > equilibrium price, then quantity supplied > quantity demanded. There is excess
- 31. Equilibrium Shortage When price the quantity supplied. There is excess demand or a shortage. Suppliers will
- 32. Equilibrium Law of supply and demand The claim that the price of any good adjusts to
- 34. Скачать презентацию
The Market Forces of Supply and Demand
The Market Forces of Supply and Demand
Supply and demand are the two words that economists use most
Supply and demand are the two words that economists use most
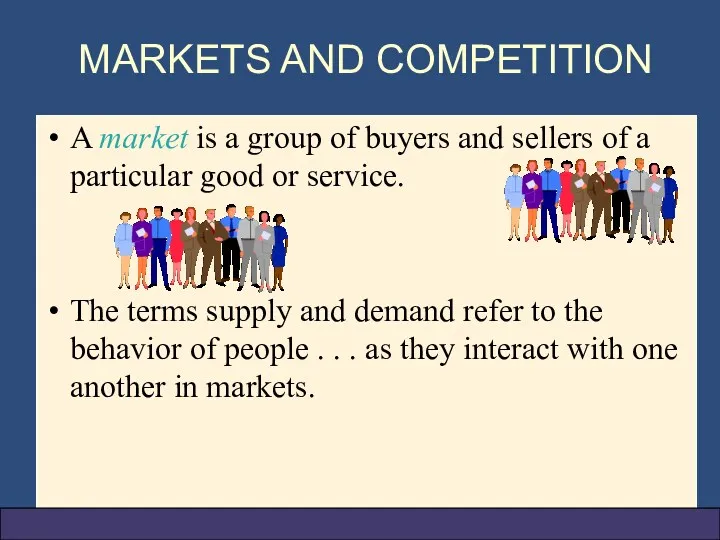
A market is a group of buyers and sellers of a
A market is a group of buyers and sellers of a
MARKETS AND COMPETITION
Buyers determine demand.
Sellers determine supply
MARKETS AND COMPETITION
Buyers determine demand.
Sellers determine supply
Competitive Markets
A competitive market is a market in which there are
Competitive Markets
A competitive market is a market in which there are
Perfect Competition
Products are the same
Numerous buyers and sellers so that each
Perfect Competition
Products are the same
Numerous buyers and sellers so that each
Oligopoly
Few sellers
Not always aggressive competition
Monopolistic Competition
Many sellers
Slightly differentiated products
Each seller may
Oligopoly
Few sellers
Not always aggressive competition
Monopolistic Competition
Many sellers
Slightly differentiated products
Each seller may
DEMAND
Quantity demanded is the amount of a good that buyers are
DEMAND
Quantity demanded is the amount of a good that buyers are
The Demand Curve: The Relationship between Price and Quantity Demanded
Demand Schedule
The Demand Curve: The Relationship between Price and Quantity Demanded
Demand Schedule
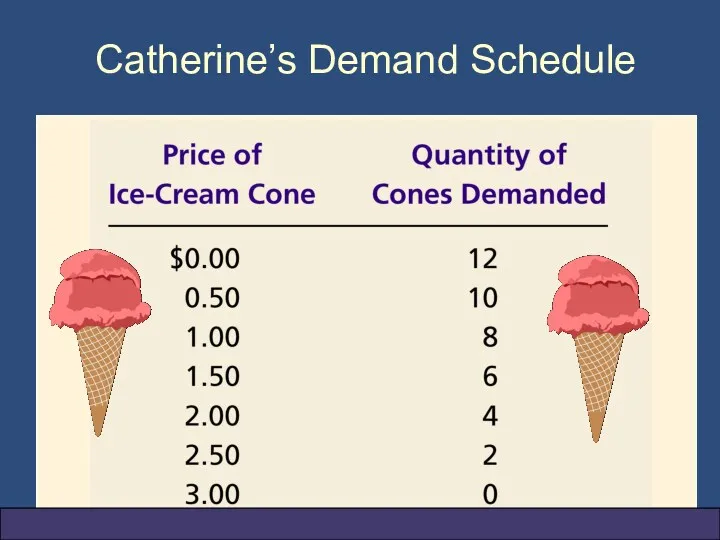
Catherine’s Demand Schedule
Catherine’s Demand Schedule
The Demand Curve: The Relationship between Price and Quantity Demanded
Demand Curve
The Demand Curve: The Relationship between Price and Quantity Demanded
Demand Curve
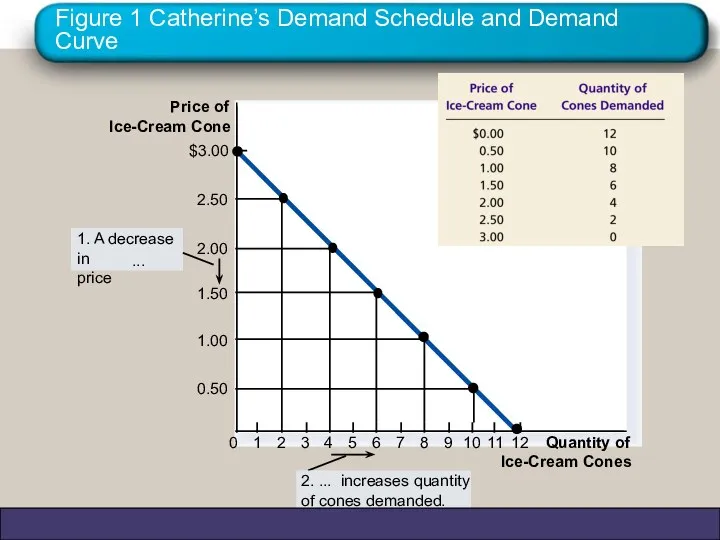
Figure 1 Catherine’s Demand Schedule and Demand Curve
Copyright © 2004 South-Western
Price
Figure 1 Catherine’s Demand Schedule and Demand Curve
Copyright © 2004 South-Western
Price
Market Demand versus Individual Demand
Market demand refers to the sum of
Market Demand versus Individual Demand
Market demand refers to the sum of
Shifts in the Demand Curve
Change in Quantity Demanded
Movement along the demand
Shifts in the Demand Curve
Change in Quantity Demanded
Movement along the demand
0
D
Price of Ice-Cream
Cones
Quantity of Ice-Cream Cones
A tax that raises the
0
D
Price of Ice-Cream
Cones
Quantity of Ice-Cream Cones
A tax that raises the
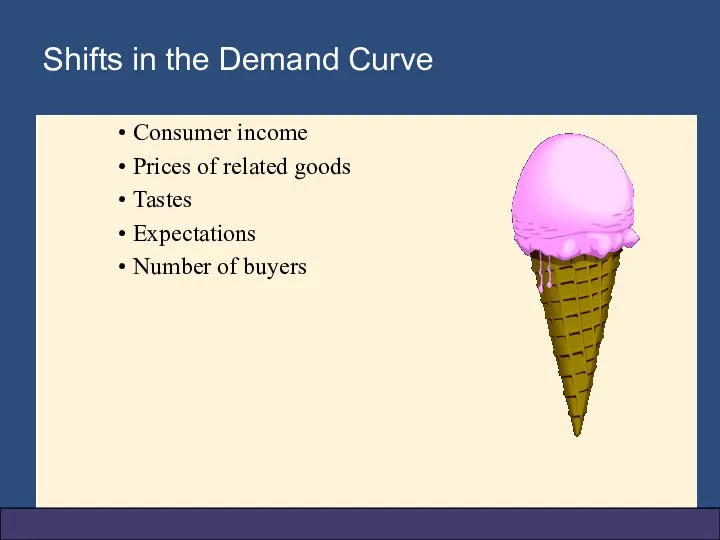
Shifts in the Demand Curve
Consumer income
Prices of related goods
Tastes
Expectations
Number of buyers
Shifts in the Demand Curve
Consumer income
Prices of related goods
Tastes
Expectations
Number of buyers
Shifts in the Demand Curve
Change in Demand
A shift in the demand
Shifts in the Demand Curve
Change in Demand
A shift in the demand
Shifts in the Demand Curve
Consumer Income
As income increases the demand for
Shifts in the Demand Curve
Consumer Income
As income increases the demand for
Shifts in the Demand Curve
Prices of Related Goods
When a fall in
Shifts in the Demand Curve
Prices of Related Goods
When a fall in
SUPPLY
Quantity supplied is the amount of a good that sellers are
SUPPLY
Quantity supplied is the amount of a good that sellers are
The Supply Curve: The Relationship between Price and Quantity Supplied
Supply Schedule
The
The Supply Curve: The Relationship between Price and Quantity Supplied
Supply Schedule
The
The Supply Curve: The Relationship between Price and Quantity Supplied
Supply
The Supply Curve: The Relationship between Price and Quantity Supplied
Supply
Market Supply versus Individual Supply
Market supply refers to the sum of
Market Supply versus Individual Supply
Market supply refers to the sum of
Shifts in the Supply Curve
Input prices
Technology
Expectations
Number of sellers
Shifts in the Supply Curve
Input prices
Technology
Expectations
Number of sellers
Shifts in the Supply Curve
Change in Quantity Supplied
Movement along the supply
Shifts in the Supply Curve
Change in Quantity Supplied
Movement along the supply
Shifts in the Supply Curve
Change in Supply
A shift in the supply
Shifts in the Supply Curve
Change in Supply
A shift in the supply
SUPPLY AND DEMAND TOGETHER
Equilibrium refers to a situation in which the
SUPPLY AND DEMAND TOGETHER
Equilibrium refers to a situation in which the
SUPPLY AND DEMAND TOGETHER
Equilibrium Price
The price that balances quantity supplied and
SUPPLY AND DEMAND TOGETHER
Equilibrium Price
The price that balances quantity supplied and
Equilibrium
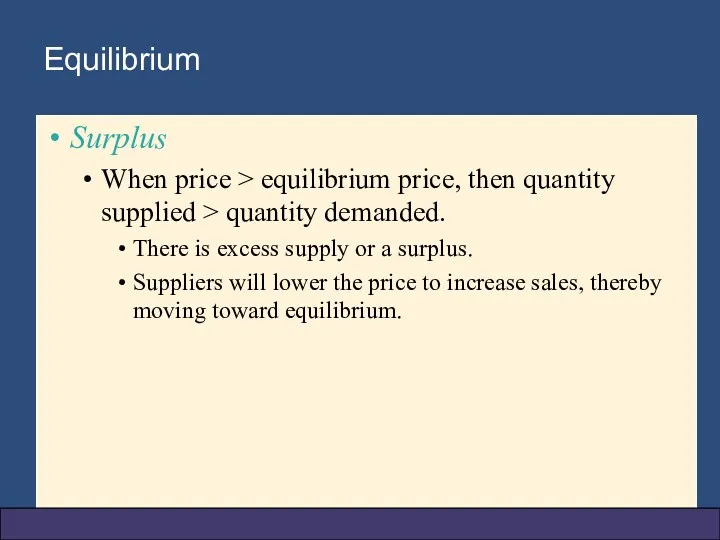
Surplus
When price > equilibrium price, then quantity supplied > quantity demanded.
Equilibrium
Surplus
When price > equilibrium price, then quantity supplied > quantity demanded.
Equilibrium
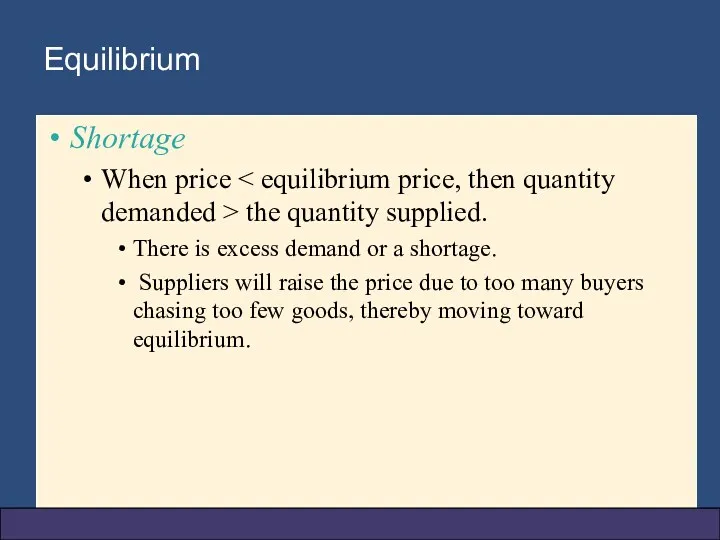
Shortage
When price < equilibrium price, then quantity demanded > the quantity
Equilibrium
Shortage
When price < equilibrium price, then quantity demanded > the quantity
Equilibrium
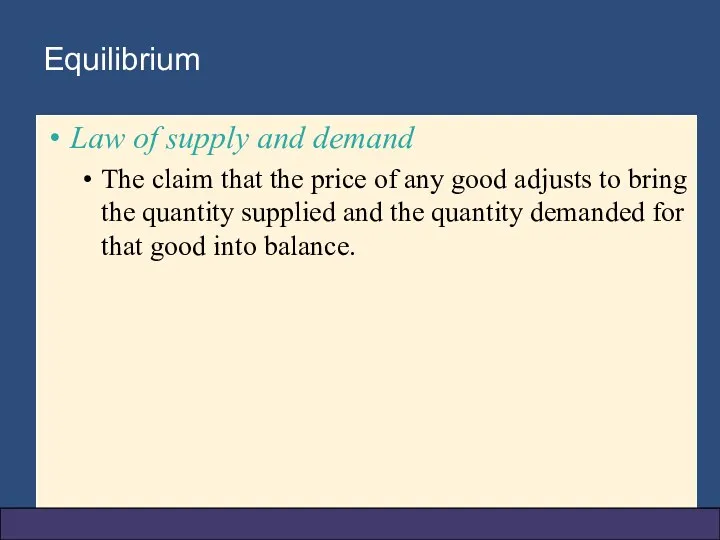
Law of supply and demand
The claim that the price of any
Equilibrium
Law of supply and demand
The claim that the price of any
 Takeovers & mergers
 Economic system
 Факторы трудовой миграции
 Государственная программа развития агропромышленного комплекса Республики Казахстан на 2017-2021 годы
 Ford Motor Company
 Практическое занятие с презентацией расчёт НДФЛ
 Организация стран - экспортеров нефти (ОПЕК)
 Совокупный спрос и совокупное предложение
 Экономические взгляды Ибн-Хальдуна
 Макроэкономикалық статистикалық көрсеткіштерге талдау
 Статистика основных и оборотных фондов предприятий
 Министерство экономического развития Российской Федерации. Функционально-структурный анализ
 Оценка в бизнес-среде уровня коррупции и избыточного административного давления в деятельности государственных органов
 Экономическая сфера жизни общества
 Использование машин и оборудования
 Инфляция: сущность, виды и методы борьбы
 Конфлікт корпоративних інтересів та запобігання рейдерству і корпоративному шантажу
 Венчурный капитал, как источник инновационных инвестиций
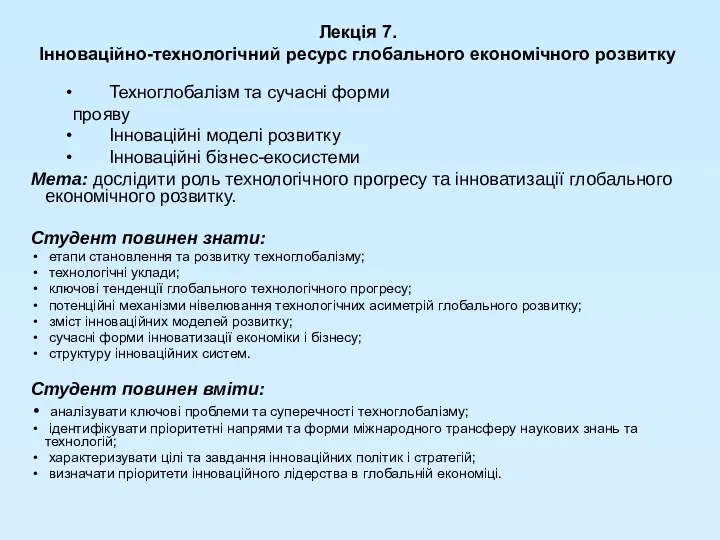 Інноваційно-технологічний ресурс глобального економічного розвитку
 Глобальный цифровой рынок и место России на нём
 Бізнес-планування, характеристика бізнес-плану
 Роль государства в экономике
 Частные и общественные блага. Внешние эффекты. Функции государства в экономике
 Совершенствование системы государственного регулирования фармацевтической промышленности России
 Экономика для школьников. Схемы, таблицы, графики.
 World Tourism Market. Introduction to the market and international tourism
 Measuring a nation’s income
 Основы грузоведения и технологии грузопереработки