- Неустойчивость тонких пленок, самоорганизация на поверхности

Содержание
- 2. Нестабильность механически напряженной пленки Instability of mechanically stressed films Механизм развития нестабильности - поверхностная диффузия Mechanism
- 3. Малые периодические изменения толщины Small periodic variation of thickness ω=2π/λ
- 4. Малые периодические изменения толщины Small periodic variation of thickness
- 5. Плотность энергии и химический потенциал Energy and chemical potential Увеличение площади поверхности квадратично по a /
- 6. Критическая длина стабильности Critical length of stability Пусть a зависит от времени Изменение свободной энергии, усредненное
- 7. Нестабильность напряженной пленки Asaro-Tiller--Grinfeld instability ν = 0.3 G = 0.67 1011 Pa γ = 1
- 8. Нестабильность пленки GeSi на Si Asaro-Tiller--Grinfeld instability of GeSi on Si Transmission electron microscopy cross-sectional image
- 9. Возмущения второго порядка Second order disturbation
- 10. Применимость приближения малых флуктуаций Applicability of small perturbation approach The dependence of change in surface energy
- 11. Домашнее задание (Homework) 4 Пленка Ge толщиной 4 нм выращена эпитаксиально на подложке Si с ориентацией
- 12. Начальная стадия самоорганизации КТ InAs на поверхности GaAs Initial stage of self-organization of InAs QDs on
- 13. КТ InAs на поверхности GaAs InAs quantum dots on GaAs surface AFM image
- 14. Причина формирования КТ – выигрыш в упругой энергии The reason for self-organization is a release of
- 15. Механизм Странского-Крастанова Stranski-Krastanow mechanism Размерный параметр задачи Dimensional parameter γf~1J/m2, Mf~1011Pa, εm~0.03
- 16. Механизм Странского-Крастанова Stranski-Krastanow mechanism dimensionless parameter
- 17. Соотношение вертикального и латерального размеров Optimal aspect ratio Free energy change per unit volume of island
- 18. Упругая энергия при изменении отношения высоты островка к его основанию Elastic energy vs. aspect ratio Total,
- 19. Начальные стадии формирования пирамид Ge на Si Initial stages of formation of Ge islands on Si
- 20. Формы островков Ge на Si Shapes of Ge islands on Si The size distribution of several
- 21. Распределение по размерам Size distribution 0 1 2 Size distributions of domes and pyramids calculated by
- 22. Эволюция формы Shape evolution Shape transition of Ge or SiGe islands grown on Si(001) during growth
- 23. Формы островков Shape evolution Typical Ge island shapes obtained by STM during Si capping of Ge
- 24. Геометрия островков InAs на GaAs и Ge на Si Geometry of InAs islands on GaAs and
- 25. Нуклеация пирамидальных островков Nucleation of pyramidal islands The volume dependence of the energy necessary to create
- 26. Фасетирование островков InAs на GaAs Facetting of InAs islands on GaAs Facetting of InAs islands (a)
- 27. Фасетирование островков Facetting of islands Зубчатая фасетированная поверхность. Эффективные силы противоположного знака приложены к соседним углам.
- 28. Энергия фасетированной поверхности Energy of facetted surface The energy of a periodically faceted surface per unit
- 29. Равновесность системы островков The energy of a dilute array of 3D coherently strained islands per one
- 30. Самоорганизация QD на поверхности: Кинетика или термодинамика? Self-organization: kinetics or thermodynamics? Формирование квантовых точек на поверхности
- 31. Роль условий роста Role of growth conditions Effect of As pressure on InAs/GaAs quantum dot arrays.
- 32. Самоорганизация квантовых точек на поверхности Self-organization of quantum dots on a growth surface Технология молекулярно-лучевой эпитаксии
- 33. Режимы роста гетероэпитаксиальных систем Growth modes in heteroepitaxial systems Основные параметры: Энтропия пересыщения Энергии поверхности подложки
- 34. Фазовая диаграмма режимов роста Phase diagram of growth modes Равновесная фазовая диаграмма гетероэпитаксиальной системы с рассогласованием
- 35. Домашнее задание (Homework) 5 Пленка Ge толщиной 4 нм выращена эпитаксиально на подложке Si с ориентацией
- 36. Латеральное упорядочение островков Энергия латерального взаимодействия островков R – расстояние между островками; V – объем островка;
- 37. Энергия латерального взаимодействия островков на поверхности Normalized interaction energy as a function of island separation, for
- 38. Латеральное упорядочение островков InAs на GaAs Ordering of quantum dots: (a) plan-view transmission electron microscopy (TEM)
- 40. Скачать презентацию
 Закон сохранения механической энергии. Потенциальные силы
 Электрический ток в полупроводниках
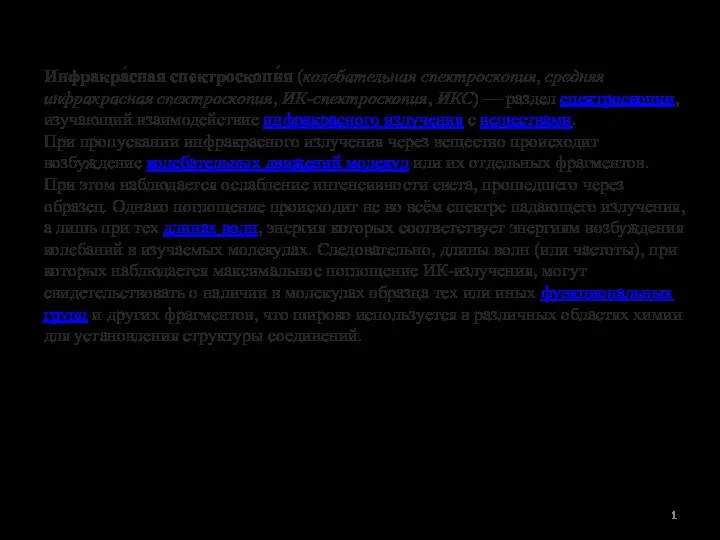 Инфракрасная спектроскопия
 Волновая оптика
 Ядерный магнитный резонанс (теория ЯМР 2)
 Рідкі кристали та їх використання. Наноматеріали
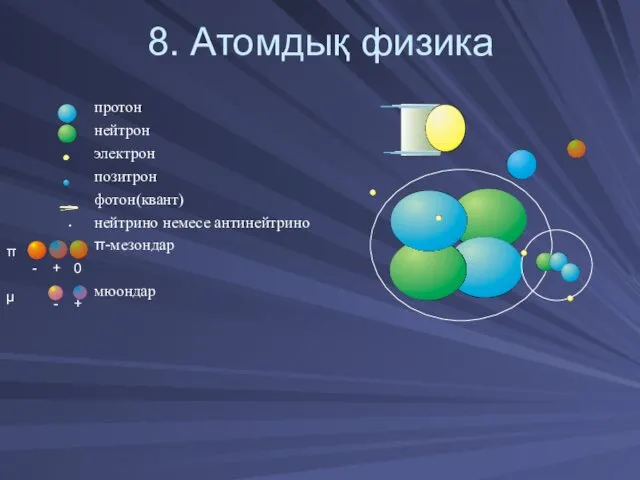 Атомдық физика
 Электромагнитные колебания
 Линзы. Виды линз
 урок по теме плотность вещества
 Сообщающиеся сосуды
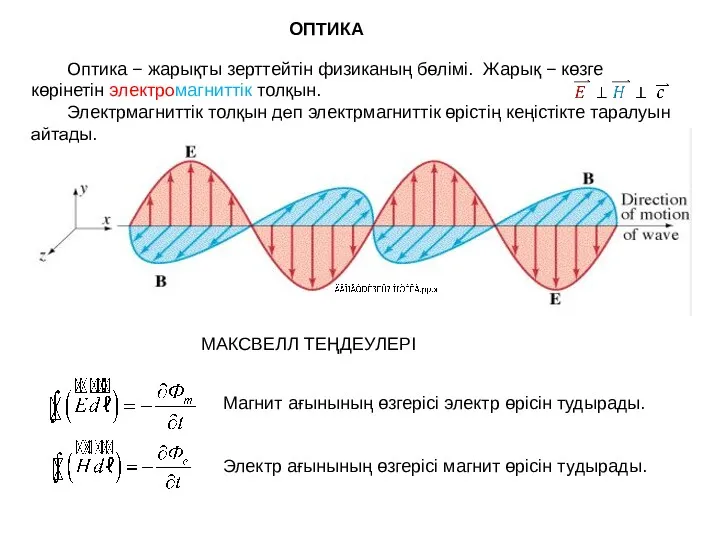 Оптика
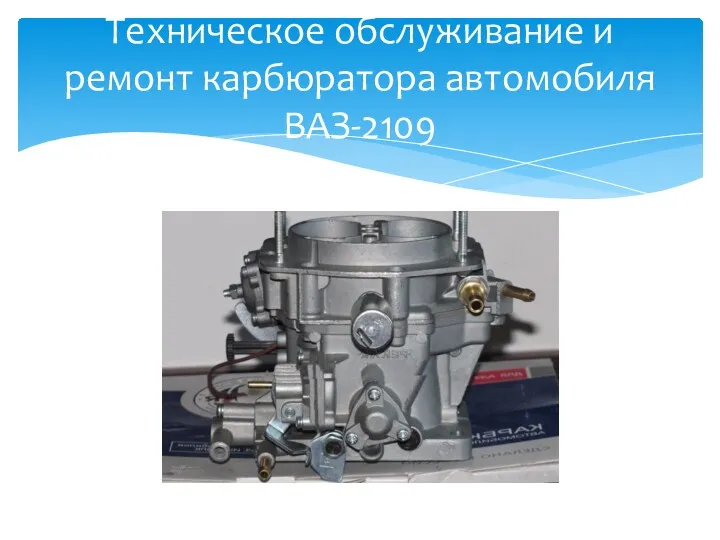 Техническое обслуживание и ремонт карбюратора автомобиля ВАЗ-2109
 Электрический ток в различных средах
 Предпусковой подогреватель двигателя
 Основные технологии обработки металлов и пластмасс ручными инструментами (6 класс)
 Игра по физике Тайна черных ящиков для учащихся 10-11 классов
 Электронная спектроскопия в анализе органических соединений
 Трансформаторы тока и напряжения
 Спостереження фізичних явищ довкіля
 Использование комплекта Я сдам ЕГЭ для подготовки к экзамену по физике
 Плазма и её свойства
 Поляризация и дифракция света (физика, 11 класс)
 Зміна сили струму в колі. Реостат
 Трёхфазные цепи
 Презентация к уроку физики в 8 классе Проводники и диэлектрики
 презентация решение задач по теме Простые механизмы
 Тела и вещества презентация к уроку естествознание 5 класс ФГОС