- Unit 6: Bending\. Shear and Moment Diagrams

Содержание
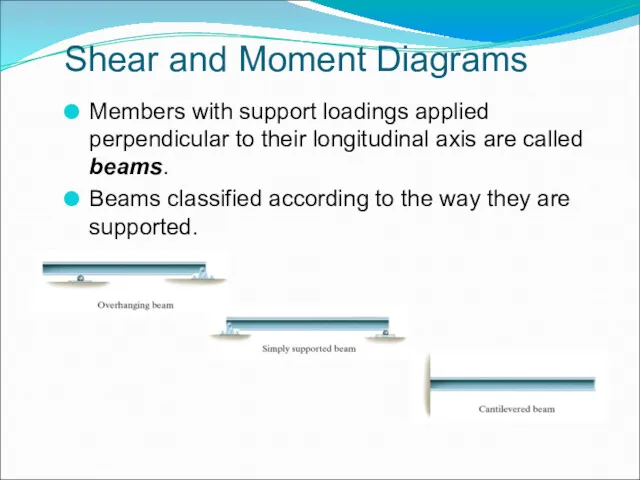
- 2. Shear and Moment Diagrams Members with support loadings applied perpendicular to their longitudinal axis are called
- 3. Shear and Moment Diagrams Shear and moment functions can be plotted in graphs called shear and
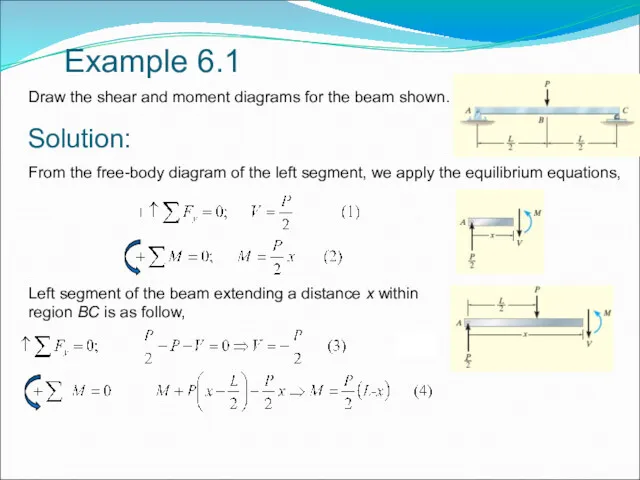
- 4. Example 6.1 Draw the shear and moment diagrams for the beam shown. Solution: From the free-body
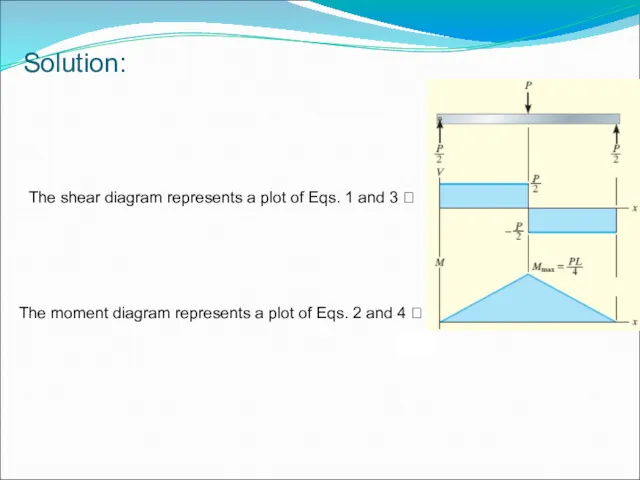
- 5. Solution: The shear diagram represents a plot of Eqs. 1 and 3 ? The moment diagram
- 6. EXAMPLE 2 Draw the shear and moment diagrams for the beam shown in Fig. 6–12a. Copyright
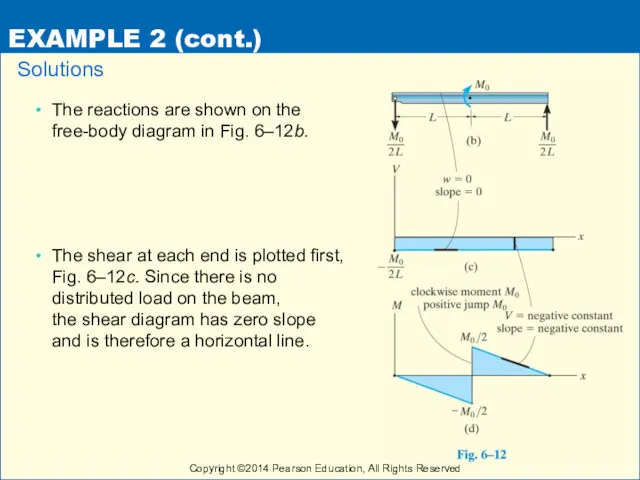
- 7. EXAMPLE 2 (cont.) The reactions are shown on the free-body diagram in Fig. 6–12b. The shear
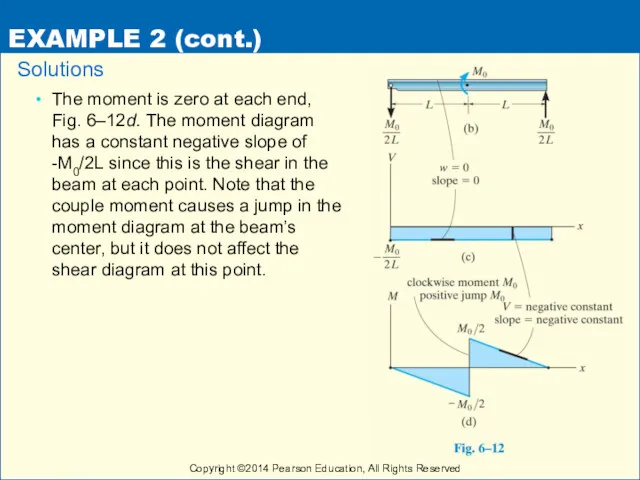
- 8. EXAMPLE 2 (cont.) The moment is zero at each end, Fig. 6–12d. The moment diagram has
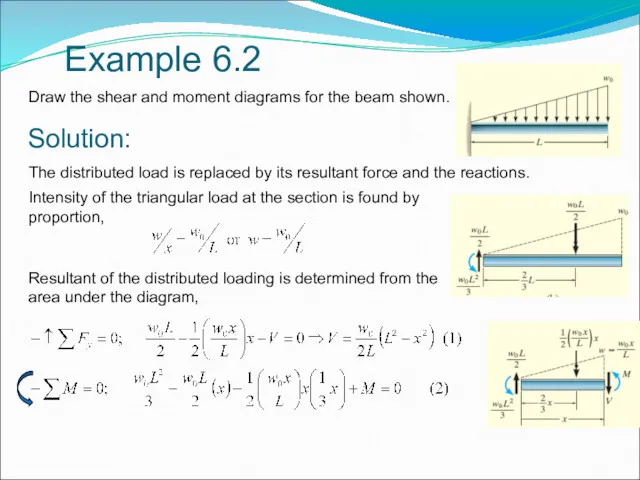
- 9. Example 6.2 Draw the shear and moment diagrams for the beam shown. Solution: The distributed load
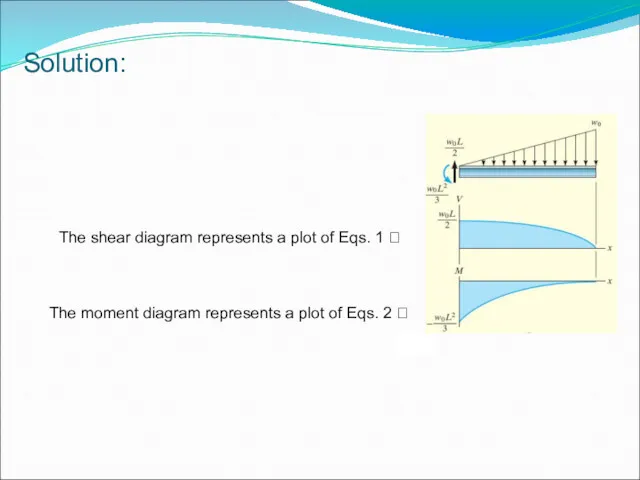
- 10. Solution: The shear diagram represents a plot of Eqs. 1 ? The moment diagram represents a
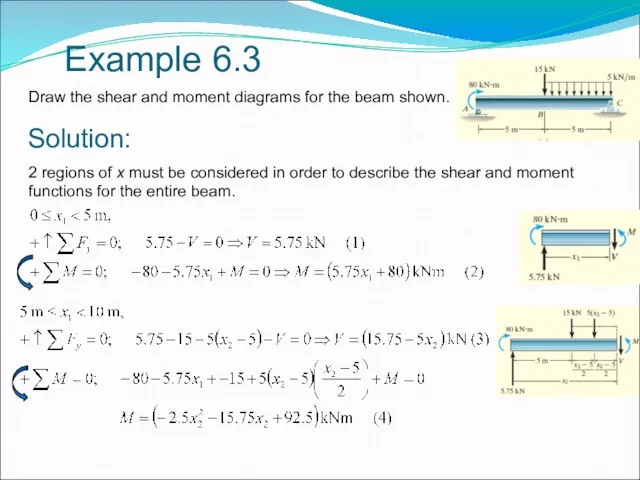
- 11. Example 6.3 Draw the shear and moment diagrams for the beam shown. Solution: 2 regions of
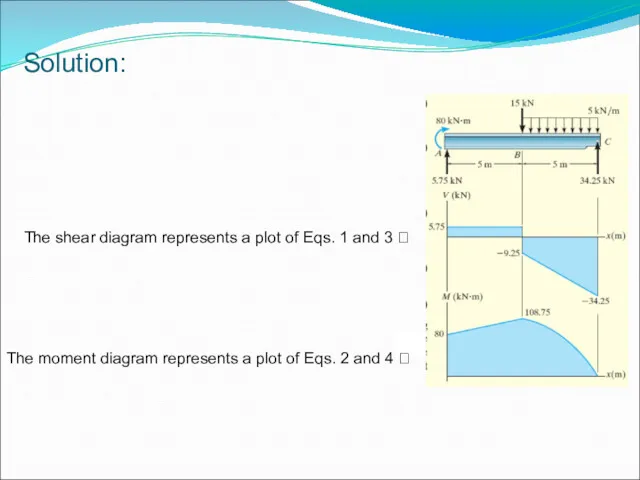
- 12. Solution: The shear diagram represents a plot of Eqs. 1 and 3 ? The moment diagram
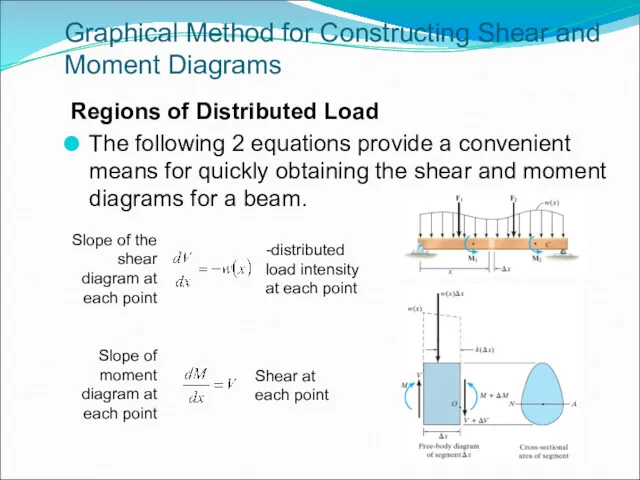
- 13. Graphical Method for Constructing Shear and Moment Diagrams Regions of Distributed Load The following 2 equations
- 14. Example 6.4 Draw the shear and moment diagrams for the beam shown. Solution: The reactions are
- 15. Example 6.4 Draw the shear and moment diagrams for the beam shown. Solution: The reaction at
- 16. Example 6.5 Draw the shear and moment diagrams for the beam shown. Solution: The reaction at
- 17. Draw the SFD and BMD for overhanging beam Solution: Calculate the reactions by using equations of
- 18. Bending Deformation of a Straight Member Cross section of a straight beam remains plane when the
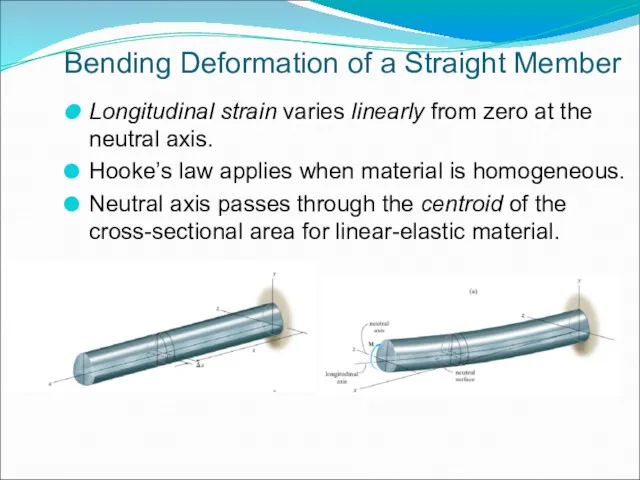
- 19. Bending Deformation of a Straight Member Longitudinal strain varies linearly from zero at the neutral axis.
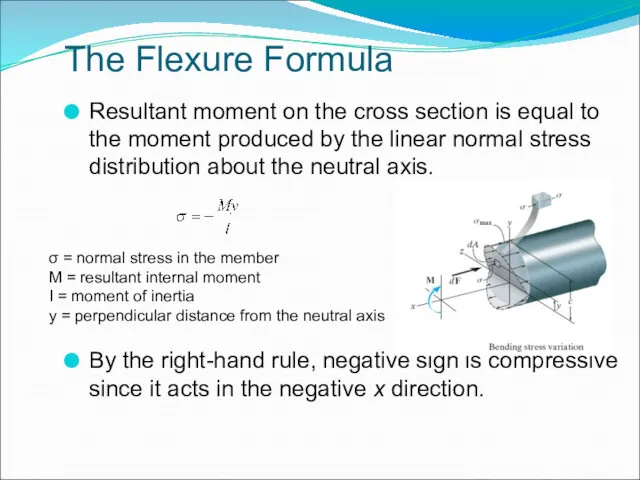
- 20. The Flexure Formula Resultant moment on the cross section is equal to the moment produced by
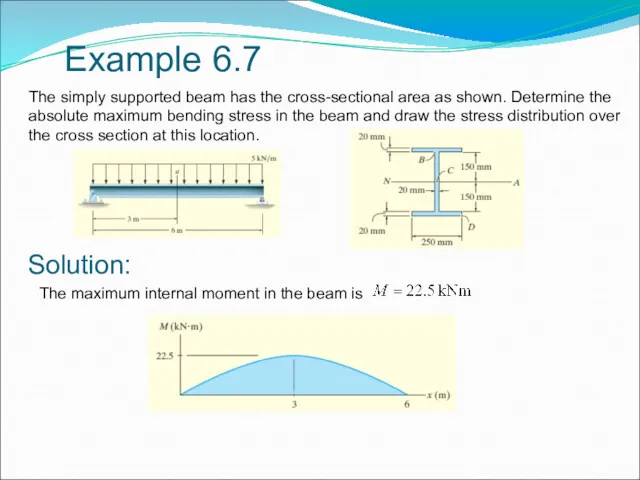
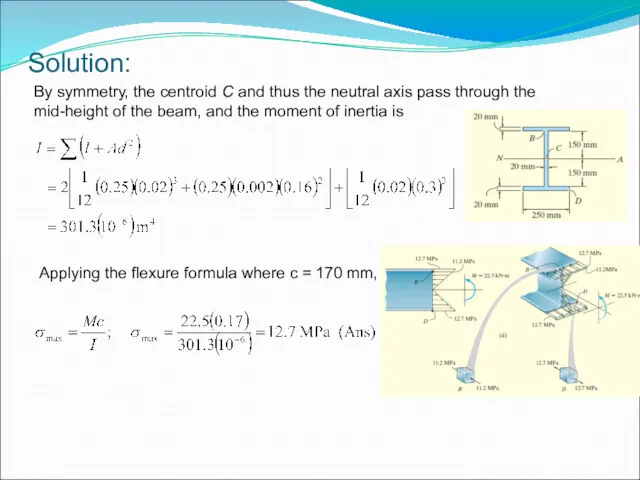
- 21. Example 6.7 The simply supported beam has the cross-sectional area as shown. Determine the absolute maximum
- 22. Solution: By symmetry, the centroid C and thus the neutral axis pass through the mid-height of
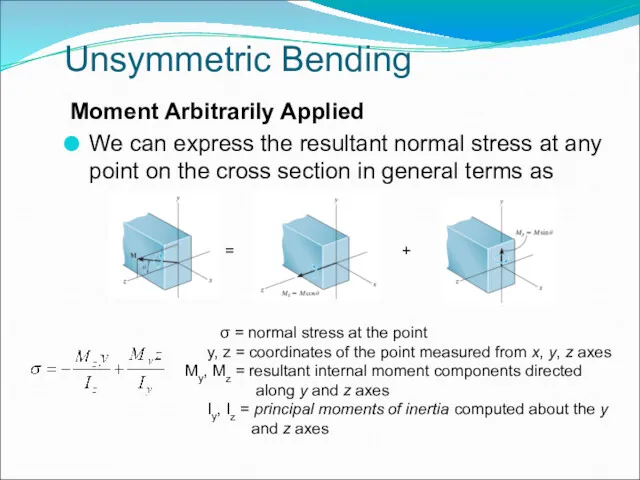
- 23. Unsymmetric Bending Moment Arbitrarily Applied We can express the resultant normal stress at any point on
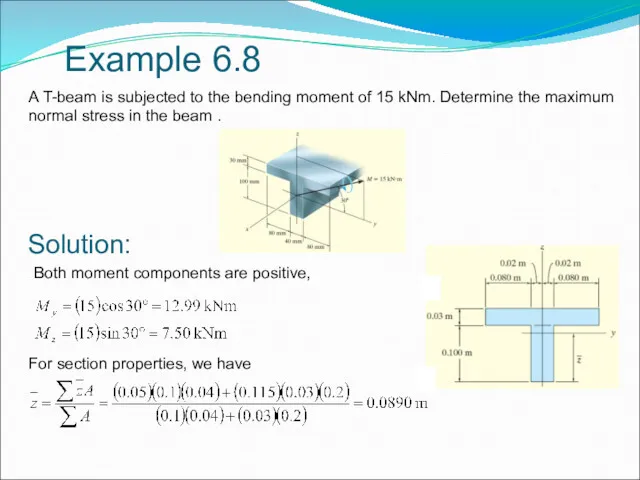
- 24. Example 6.8 A T-beam is subjected to the bending moment of 15 kNm. Determine the maximum
- 26. Скачать презентацию
Shear and Moment Diagrams
Members with support loadings applied perpendicular to their
Shear and Moment Diagrams
Members with support loadings applied perpendicular to their
Shear and Moment Diagrams
Shear and moment functions can be plotted in
Shear and Moment Diagrams
Shear and moment functions can be plotted in
Example 6.1
Draw the shear and moment diagrams for the beam shown.
Solution:
From
Example 6.1
Draw the shear and moment diagrams for the beam shown.
Solution:
From
Solution:
The shear diagram represents a plot of Eqs. 1 and 3
Solution:
The shear diagram represents a plot of Eqs. 1 and 3
EXAMPLE 2
Draw the shear and moment diagrams for the
EXAMPLE 2
Draw the shear and moment diagrams for the
EXAMPLE 2 (cont.)
The reactions are shown on the
free-body diagram
EXAMPLE 2 (cont.)
The reactions are shown on the free-body diagram
EXAMPLE 2 (cont.)
The moment is zero at each end,
Fig.
EXAMPLE 2 (cont.)
The moment is zero at each end, Fig.
Example 6.2
Draw the shear and moment diagrams for the beam shown.
Solution:
The
Example 6.2
Draw the shear and moment diagrams for the beam shown.
Solution:
The
Solution:
The shear diagram represents a plot of Eqs. 1 ?
The moment
Solution:
The shear diagram represents a plot of Eqs. 1 ?
The moment
Example 6.3
Draw the shear and moment diagrams for the beam shown.
Solution:
2
Example 6.3
Draw the shear and moment diagrams for the beam shown.
Solution:
2
Solution:
The shear diagram represents a plot of Eqs. 1 and 3
Solution:
The shear diagram represents a plot of Eqs. 1 and 3
Graphical Method for Constructing Shear and Moment Diagrams
Regions of Distributed Load
The
Graphical Method for Constructing Shear and Moment Diagrams
Regions of Distributed Load
The
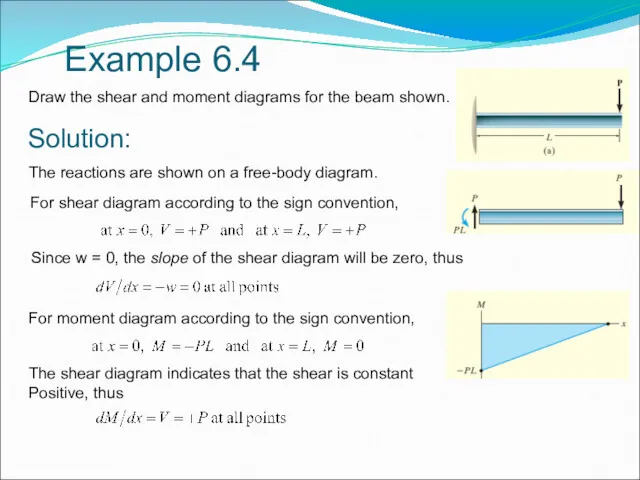
Example 6.4
Draw the shear and moment diagrams for the beam shown.
Solution:
The
Example 6.4
Draw the shear and moment diagrams for the beam shown.
Solution:
The
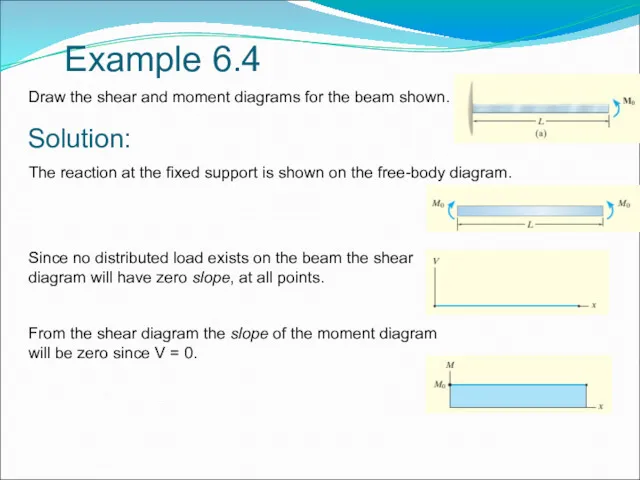
Example 6.4
Draw the shear and moment diagrams for the beam shown.
Solution:
The
Example 6.4
Draw the shear and moment diagrams for the beam shown.
Solution:
The
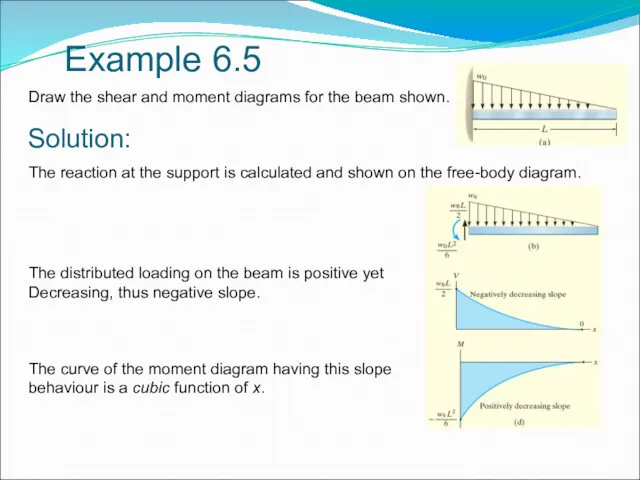
Example 6.5
Draw the shear and moment diagrams for the beam shown.
Solution:
The
Example 6.5
Draw the shear and moment diagrams for the beam shown.
Solution:
The
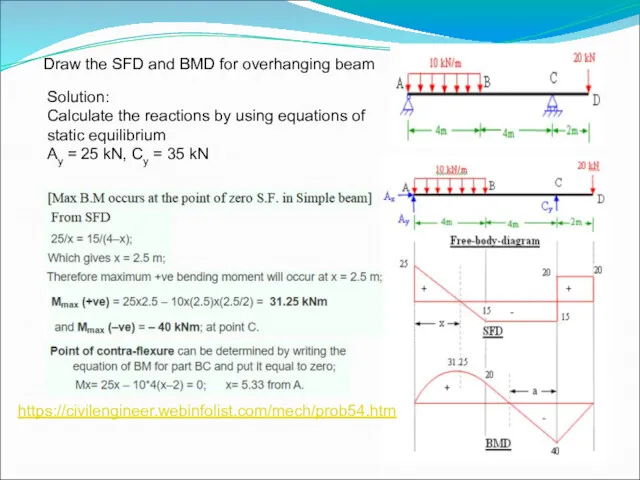
Draw the SFD and BMD for overhanging beam
Solution:
Calculate the reactions
Draw the SFD and BMD for overhanging beam
Solution:
Calculate the reactions
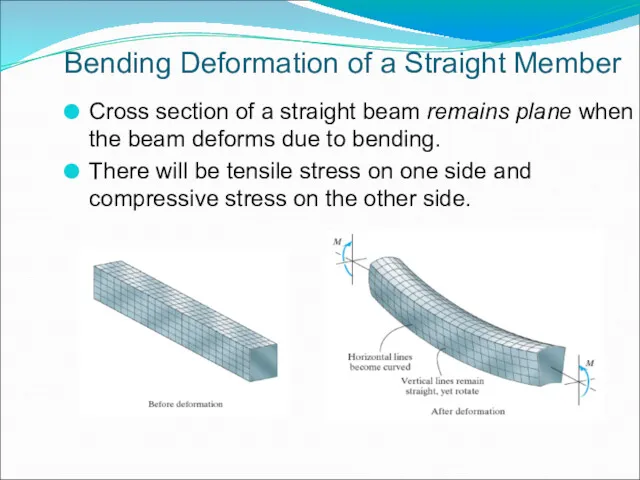
Bending Deformation of a Straight Member
Cross section of a straight beam
Bending Deformation of a Straight Member
Cross section of a straight beam
Bending Deformation of a Straight Member
Longitudinal strain varies linearly from zero
Bending Deformation of a Straight Member
Longitudinal strain varies linearly from zero
The Flexure Formula
Resultant moment on the cross section is equal to
The Flexure Formula
Resultant moment on the cross section is equal to
Example 6.7
The simply supported beam has the cross-sectional area as shown.
Example 6.7
The simply supported beam has the cross-sectional area as shown.
Solution:
By symmetry, the centroid C and thus the neutral axis pass
Solution:
By symmetry, the centroid C and thus the neutral axis pass
Unsymmetric Bending
Moment Arbitrarily Applied
We can express the resultant normal stress at
Unsymmetric Bending
Moment Arbitrarily Applied
We can express the resultant normal stress at
Example 6.8
A T-beam is subjected to the bending moment of 15
Example 6.8
A T-beam is subjected to the bending moment of 15
 Строительная механика стержней. Метод сил. Метод перемещений
 Измерение фокусных расстояний методом увеличения, методом угловых измерений, методом Аббе
 Эта загадочная резинна
 Викторина по физике 9 класс
 Механическое движение
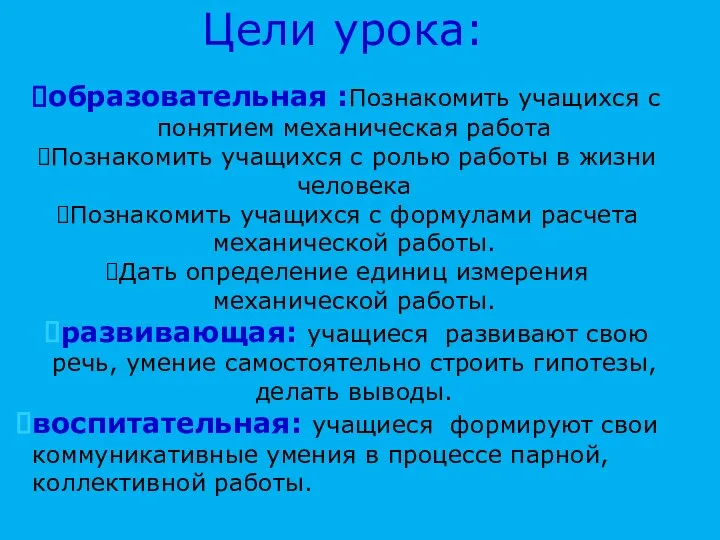 Презентация к уроку по теме : Механическая работа. Единицы работы.
 Урок-лаборатория Электризация тел, электрический заряд
 Элементарные частицы
 Механізація водопостачання
 Звуковые волны
 Що називається посадкою
 Опыт Эрстеда. Магнитное поле. Конфигурации магнитных полей. Характеристики магнитного поля
 Электрический ток в металлах
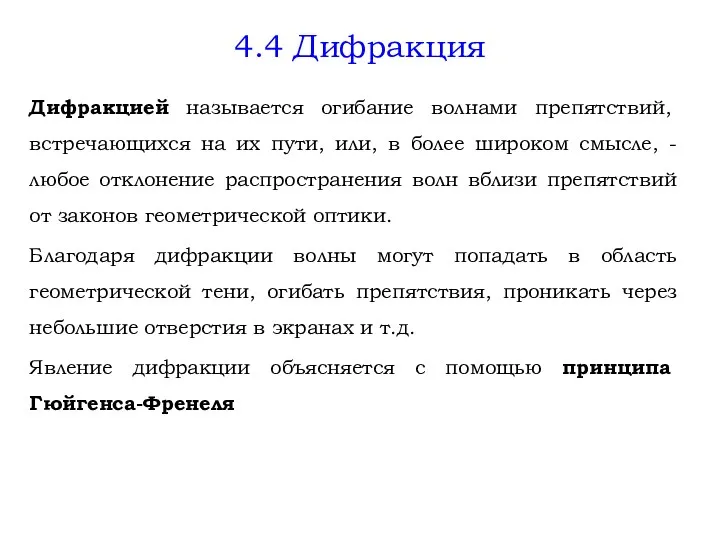 Дифракция. Принцип Гюйгенса-Френеля
 Тюнинг двигателя
 Интерференция света
 Прямолинейное и криволинейное движение. Движение тела по окружности. 9 класс (1)
 Анализ кинетической модели химических превращений. (Тема 4.4)
 ВКР: Модернизация ремонтной мастерской с разработкой установки для пескоструйной очистки деталей
 Электрические цепи постоянного тока. (Лекция 1)
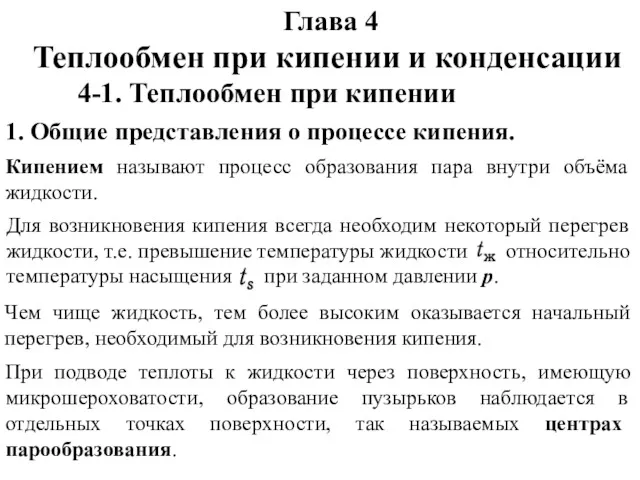 Теплообмен при кипении и конденсации
 Инерция. Урок № 13
 Основы зонной теории твердых тел
 kruchenie_1425730239_109943
 Аспекти розвитку ядерної енергетики. Сучасний стан радіаційної безпеки України
 Системно-деятельностный подход в обучении физики как основа ФГОС
 Ампер тәжірибесі. Магнит өрісі. Магнит өрісінің сипаттамасы
 Трехфазный синусоидальный ток