- Drawing graphic sedimentary logs. Increasing grainsize

Содержание
- 2. The variability of sedimentary logs The four logs on the left illustrate that there is no
- 3. Sedimentary logging The logging sheet on the right is a typical sheet used for logging sedimentary
- 4. The logging sheet This sheet was designed for metric wells, and any outcrops which were measured
- 5. Typical logging sheet header The most important columns on the logging sheet are the depth column
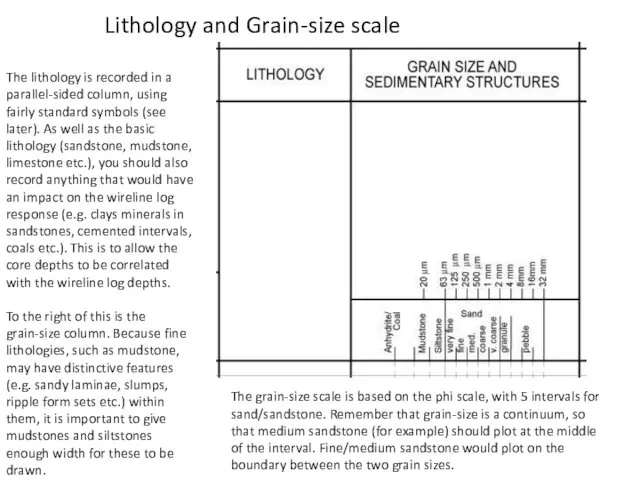
- 6. Lithology and Grain-size scale The lithology is recorded in a parallel-sided column, using fairly standard symbols
- 7. More on the grain-size scale Strictly speaking, there should be 4 divisions for siltstone on the
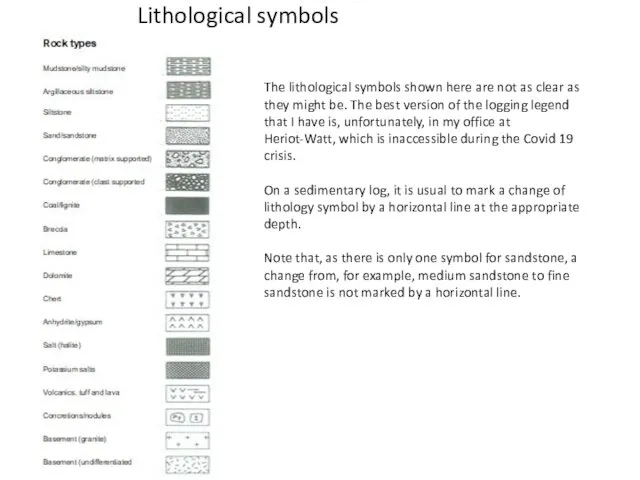
- 8. Lithological symbols The lithological symbols shown here are not as clear as they might be. The
- 9. Sedimentary structures Planar lamination Trough cross bedding Tabular cross bedding Graded bedding Bimodal lamination Current-ripple cross
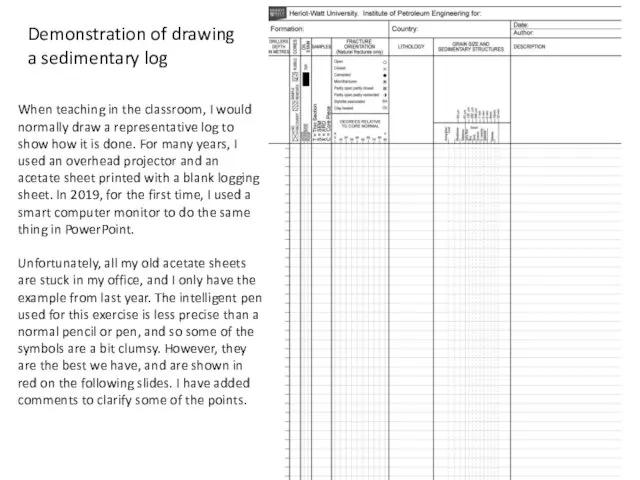
- 10. Demonstration of drawing a sedimentary log When teaching in the classroom, I would normally draw a
- 11. Sharp bed base – extends right across grain-size column Let’s look first at the grain-size curve,
- 12. Now for the sedimentary structures Planar lamination (they should be drawn a bit straighter than this!)
- 13. More on sedimentary structures, etc. Current ripple cross lamination Trough cross bedding Rootlets Coal – draw
- 14. Some more bits and pieces Depths It may be useful to write all depths ending in
- 15. Some of the more obscure columns! The same column can be used for other inclined features.
- 16. Yet more obscure columns! The first column after the depth column is used to record the
- 18. Скачать презентацию
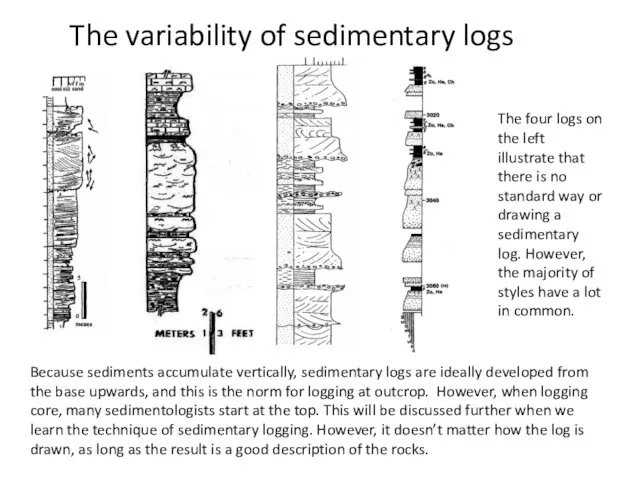
The variability of sedimentary logs
The four logs on the left illustrate
The variability of sedimentary logs
The four logs on the left illustrate
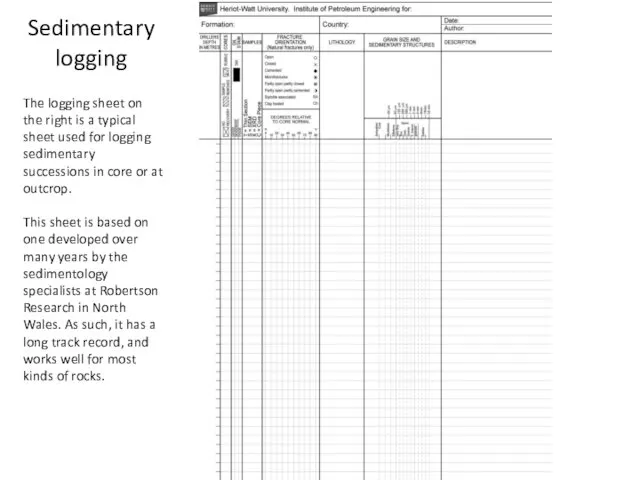
Sedimentary logging
The logging sheet on the right is a typical sheet
Sedimentary logging
The logging sheet on the right is a typical sheet
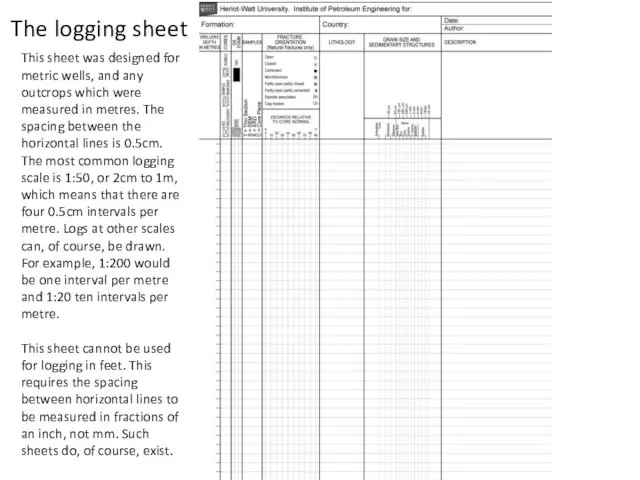
The logging sheet
This sheet was designed for metric wells, and any
The logging sheet
This sheet was designed for metric wells, and any
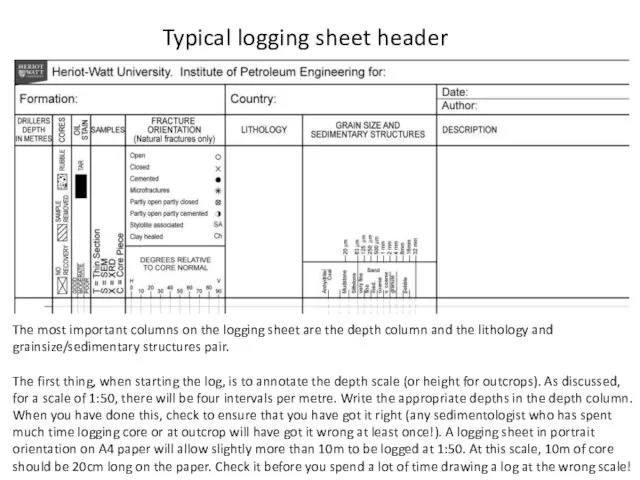
Typical logging sheet header
The most important columns on the logging sheet
Typical logging sheet header
The most important columns on the logging sheet
Lithology and Grain-size scale
The lithology is recorded in a parallel-sided column,
Lithology and Grain-size scale
The lithology is recorded in a parallel-sided column,

More on the grain-size scale
Strictly speaking, there should be 4 divisions
More on the grain-size scale
Strictly speaking, there should be 4 divisions
Lithological symbols
The lithological symbols shown here are not as clear as
Lithological symbols
The lithological symbols shown here are not as clear as
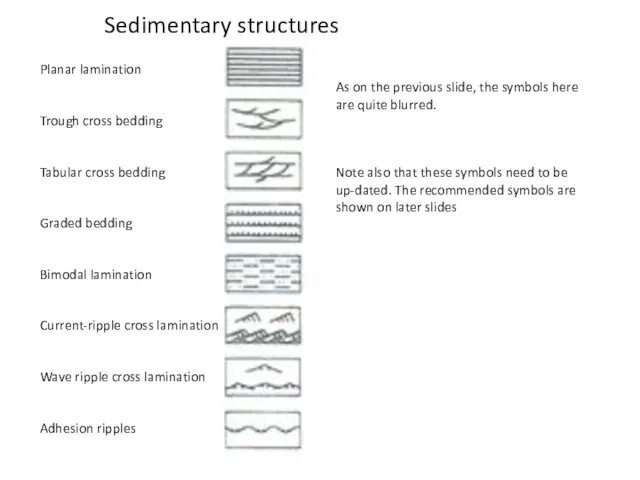
Sedimentary structures
Planar lamination
Trough cross bedding
Tabular cross bedding
Graded bedding
Bimodal lamination
Current-ripple cross lamination
Wave
Sedimentary structures
Planar lamination
Trough cross bedding
Tabular cross bedding
Graded bedding
Bimodal lamination
Current-ripple cross lamination
Wave
Demonstration of drawing a sedimentary log
When teaching in the classroom, I
Demonstration of drawing a sedimentary log
When teaching in the classroom, I
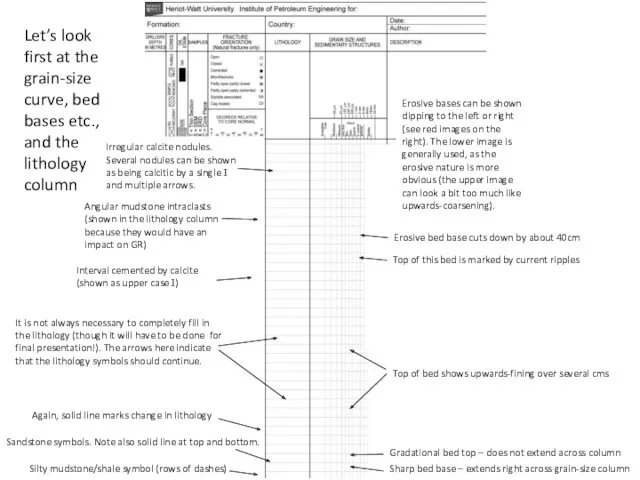
Sharp bed base – extends right across grain-size column
Let’s look first
Sharp bed base – extends right across grain-size column
Let’s look first
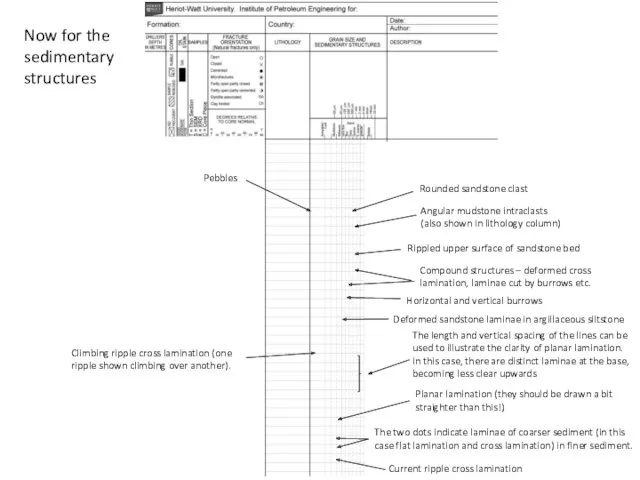
Now for the sedimentary structures
Planar lamination (they should be drawn a
Now for the sedimentary structures
Planar lamination (they should be drawn a

More on sedimentary structures, etc.
Current ripple cross lamination
Trough cross bedding
Rootlets
Coal –
More on sedimentary structures, etc.
Current ripple cross lamination
Trough cross bedding
Rootlets
Coal –
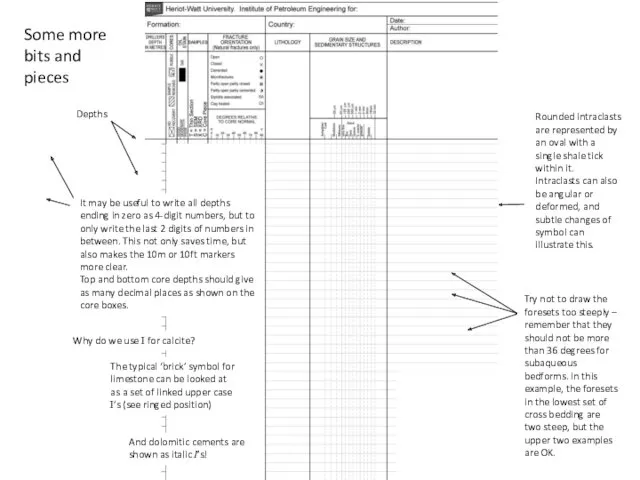
Some more bits and pieces
Depths
It may be useful to write all
Some more bits and pieces
Depths
It may be useful to write all
Some of the more obscure columns!
The same column can be used
Some of the more obscure columns!
The same column can be used
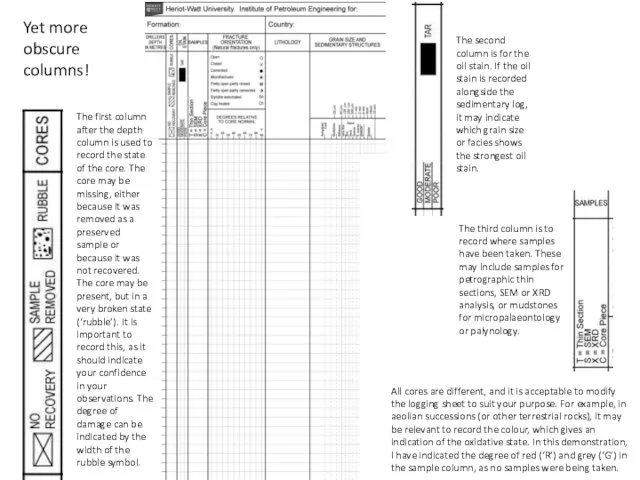
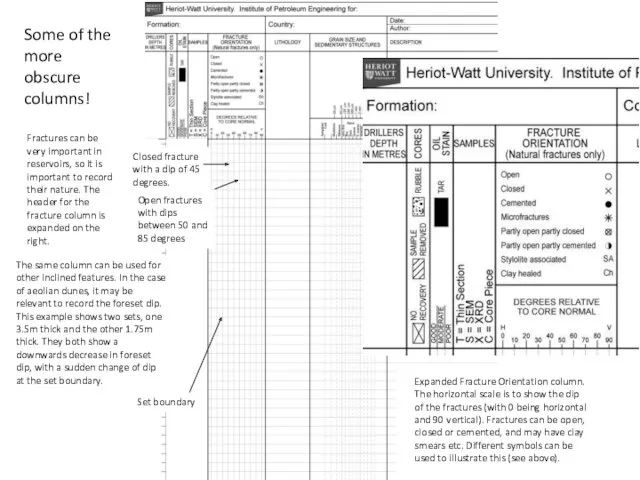
Yet more obscure columns!
The first column after the depth column is
Yet more obscure columns!
The first column after the depth column is
 География/ Лекция 1. Обзор курса. Введение. Различные виды карт
 Материк Австралія
 Географическая викторина для учащихся 7-8 классов
 Рельеф России. 4 класс
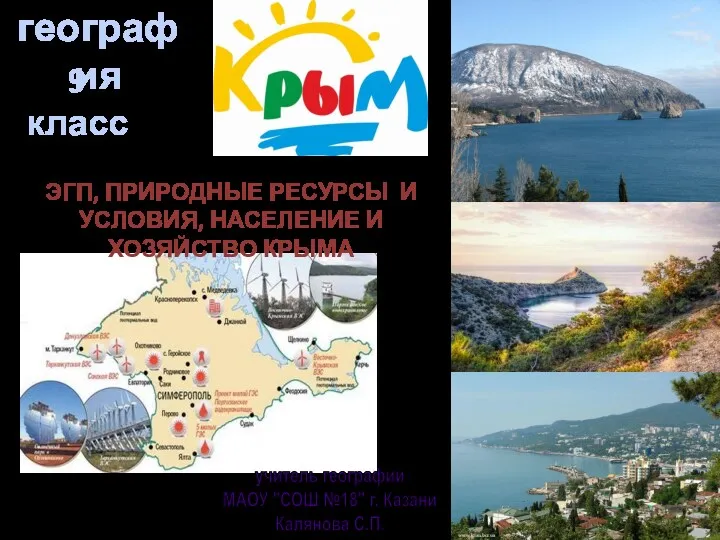 Республика Крым. (9 класс)
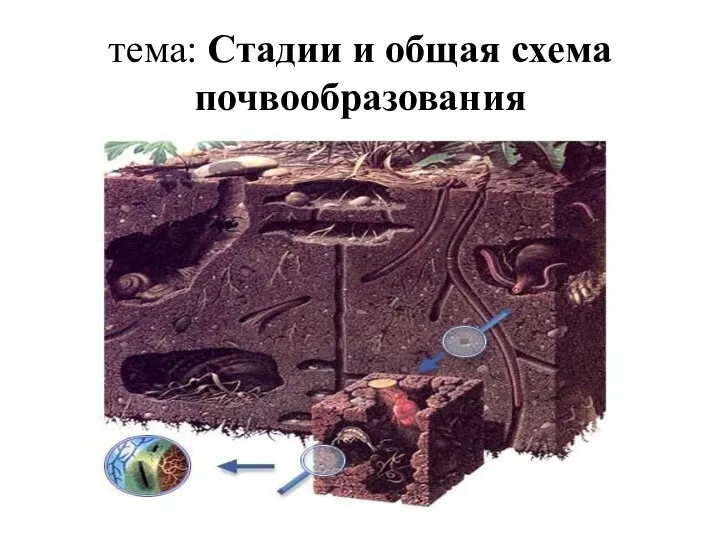 Стадии и общая схема почвообразования
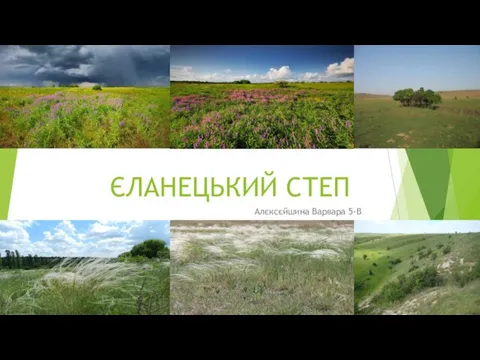 Єланецький степ
 Воды Океана
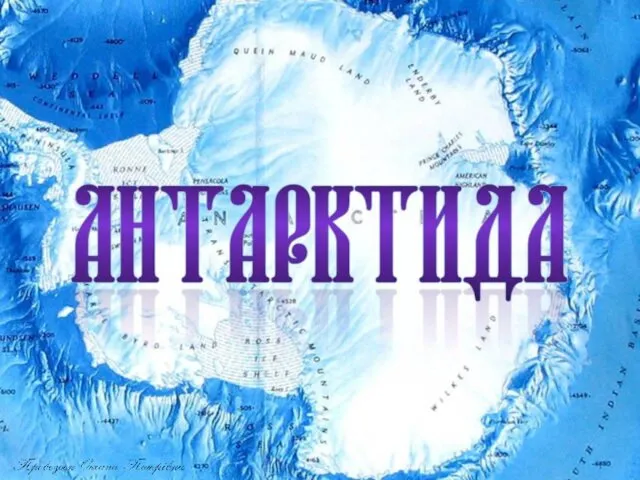 Антарктида
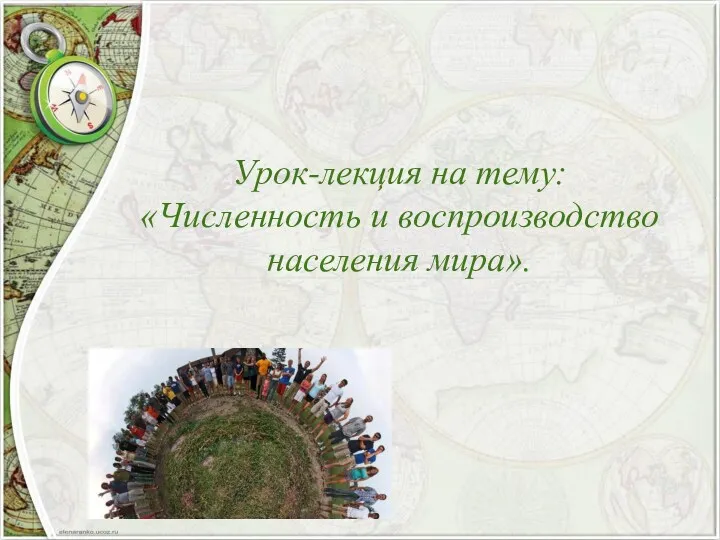 Численность и воспроизводство населения мира
 Долина гейзеров
 Казахстан
 Статистика населения
 Моя країна - Україна
 Край ты мой - родимый край
 Республика Алтай
 Административно-территориальные автономии Китайской Народной Республики
 Населення та політична карта Африки
 Табиғи аумақтық кешендердің қалыптасуы
 Природна спадщина Південної Америки занесена до ЮНЕСКО
 Фактори і процеси ґрунтоутворення
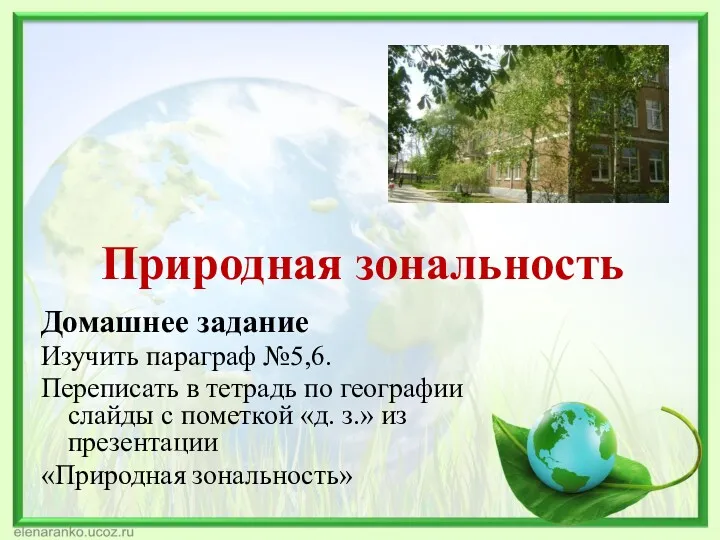 Природная зональность. 7 класс
 Современное сельское хозяйства Великобритании
 Властивості води
 Природные зоны Земли
 Игра Атлантический океан сам по себе и для нас
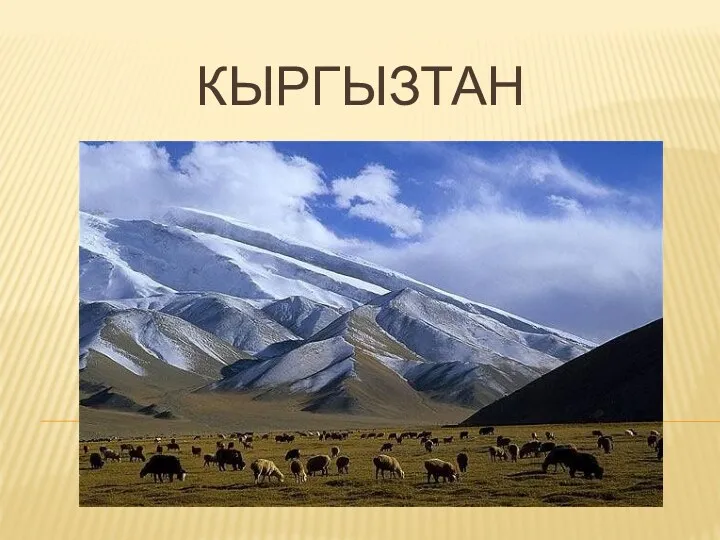 Кыргызтан. Национальные символы
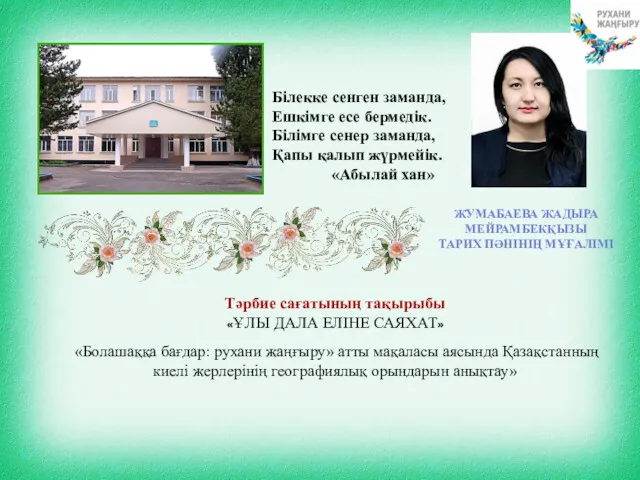 Болашаққа бағдар: рухани жаңғыру атты мақаласы аясында Қазақстанның киелі жерлерінің географиялық орындарын анықтау