- Диаграммы и графики для power point

Содержание
- 2. Кристал Графикс Диаграммы и графики для PowerPoint А Б В А Б В For more info
- 3. (and we’ve made them better) For more info visit CrystalGraphics.com/ChartandDiagramSlides Power Point позволяет пользоваться несколькими простыми
- 4. PowerPoint’s default “Pie of Pie” diagram For more info visit CrystalGraphics.com/ChartandDiagramSlides Взаимодействие круговых диаграмм в Power
- 5. Our improved “Pie of Pie” diagram For more info visit CrystalGraphics.com/ChartandDiagramSlides Наше улучшенное взаимодействие круговых диаграмм
- 6. Now here are some charts with example data… For more info visit CrystalGraphics.com/ChartandDiagramSlides Примеры некоторых графиков
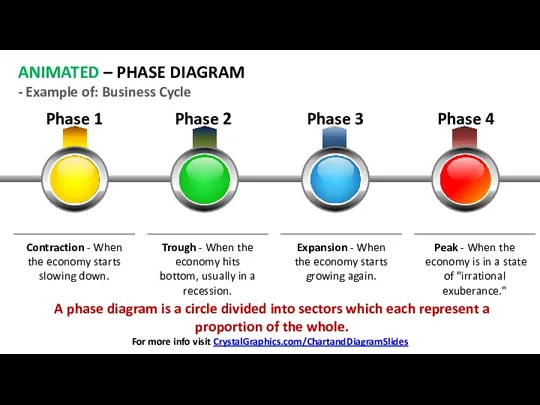
- 7. Phase 1 Phase 2 Phase 3 Phase 4 ANIMATED – PHASE DIAGRAM - Example of: Business
- 8. A 3D column chart shows the changes in a data series over time or compares multiple
- 9. A Gears Process diagram is used to show interlocking ideas. Make it easy for your customers
- 10. PIE CHART {DATA DRIVEN} – Example of: Cookie Sale A pie chart is a circle divided
- 11. A Presentation Agenda diagram serves as a guide post for your presentation. Introduction 1 Importance of
- 12. Why it Matters: The strategy suggests investors can generate profits by watching the business cycle and
- 13. ANIMATED - MAP DIAGRAM - Example of: Blogger Stats 1. 800 visitors 4. 12 visitors 3.
- 14. A Calendar Timeline Diagram shows key days leading up to a deadline. January 3rd Hold contest
- 15. The Callout diagram allows users to set up and maintain association relationships. The Perfect Team ANIMATED
- 16. A Segmented Pyramid diagram is used to show containment, proportional, or interconnected relationships. SEGMENTED PYRAMID -
- 17. A Key diagram shows where major development will take place. ANIMATED - KEY DIAGRAM - Example
- 19. Скачать презентацию
Кристал Графикс
Диаграммы и графики
для PowerPoint
А
Б
В
А
Б
В
For more info visit CrystalGraphics.com/ChartandDiagramSlides
Кристал Графикс
Диаграммы и графики
для PowerPoint
А
Б
В
А
Б
В
For more info visit CrystalGraphics.com/ChartandDiagramSlides
(and we’ve made them better)
For more info visit CrystalGraphics.com/ChartandDiagramSlides
Power Point позволяет
(and we’ve made them better)
For more info visit CrystalGraphics.com/ChartandDiagramSlides
Power Point позволяет
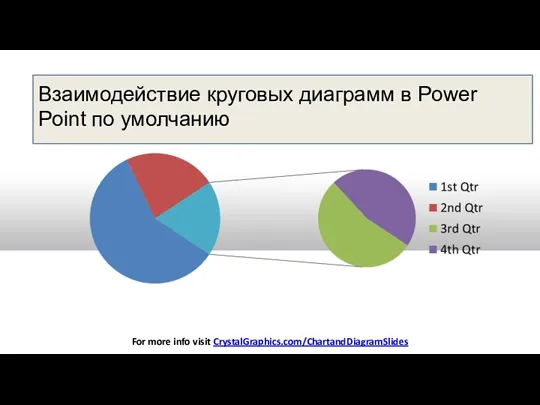
PowerPoint’s default “Pie of Pie” diagram
For more info visit CrystalGraphics.com/ChartandDiagramSlides
Взаимодействие круговых
PowerPoint’s default “Pie of Pie” diagram
For more info visit CrystalGraphics.com/ChartandDiagramSlides
Взаимодействие круговых
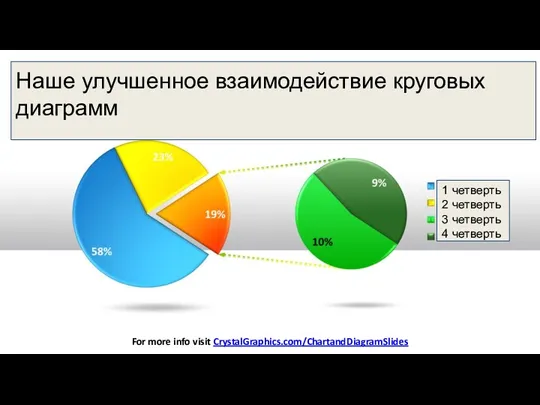
Our improved “Pie of Pie” diagram
For more info visit CrystalGraphics.com/ChartandDiagramSlides
Наше улучшенное
Our improved “Pie of Pie” diagram
For more info visit CrystalGraphics.com/ChartandDiagramSlides
Наше улучшенное
Now here are some charts with example data…
For more info visit
Now here are some charts with example data…
For more info visit
Phase 1
Phase 2
Phase 3
Phase 4
ANIMATED – PHASE DIAGRAM
- Example of: Business
Phase 1
Phase 2
Phase 3
Phase 4
ANIMATED – PHASE DIAGRAM
- Example of: Business
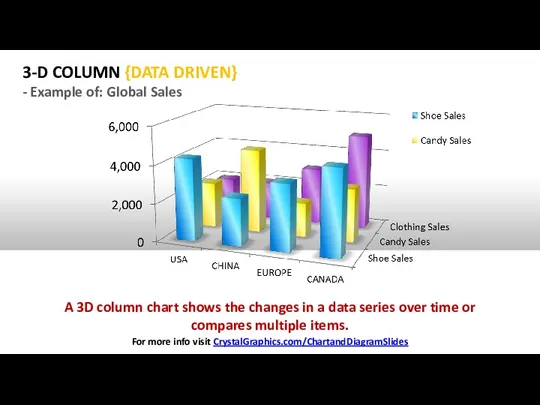
A 3D column chart shows the changes in a data series
A 3D column chart shows the changes in a data series
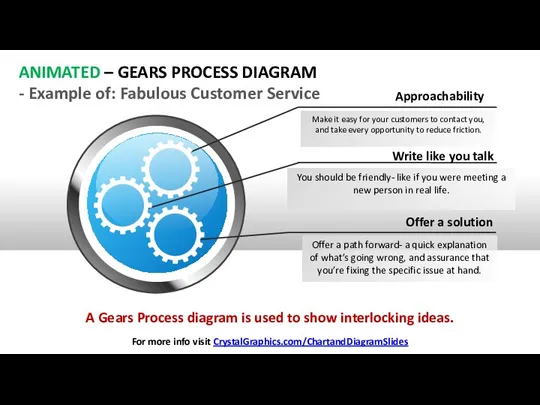
A Gears Process diagram is used to show interlocking ideas.
Make it
A Gears Process diagram is used to show interlocking ideas.
Make it
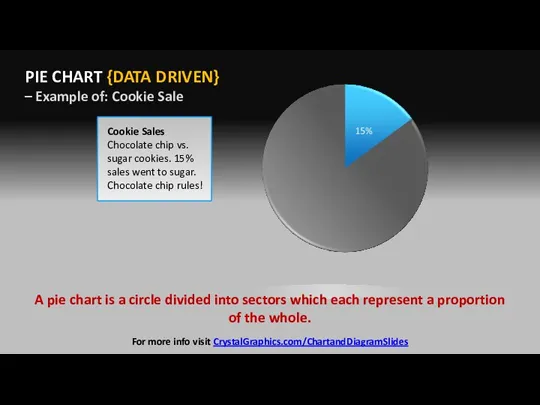
PIE CHART {DATA DRIVEN}
– Example of: Cookie Sale
A pie
PIE CHART {DATA DRIVEN}
– Example of: Cookie Sale
A pie
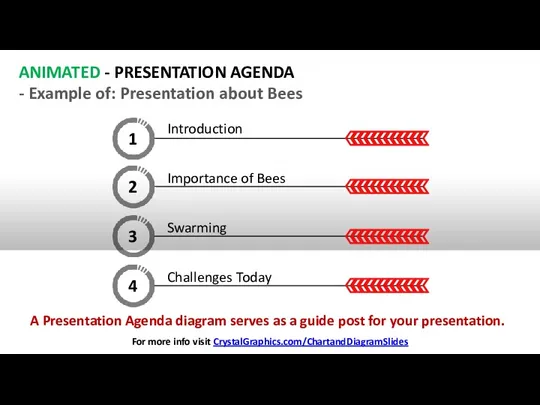
A Presentation Agenda diagram serves as a guide post for your presentation.
Introduction
1
Importance of
A Presentation Agenda diagram serves as a guide post for your presentation.
Introduction
1
Importance of
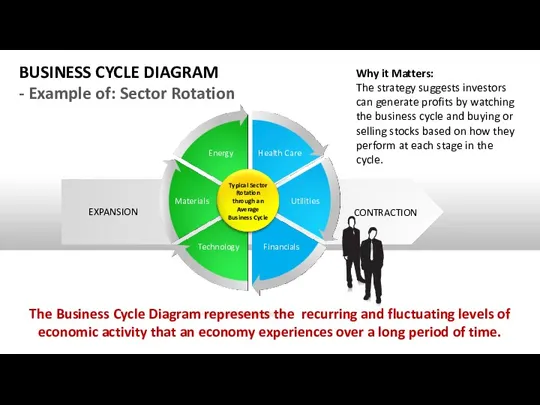
Why it Matters:
The strategy suggests investors can generate profits by watching
Why it Matters:
The strategy suggests investors can generate profits by watching
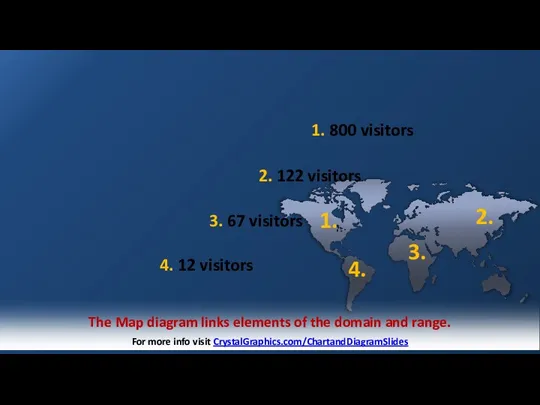
ANIMATED - MAP DIAGRAM
- Example of: Blogger Stats
1. 800 visitors
4. 12
ANIMATED - MAP DIAGRAM
- Example of: Blogger Stats
1. 800 visitors
4. 12
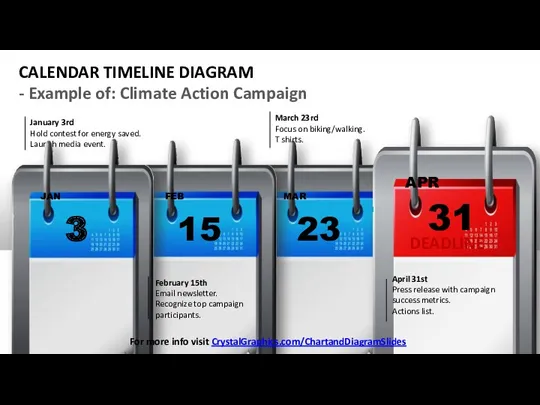
A Calendar Timeline Diagram shows key days leading up to a
A Calendar Timeline Diagram shows key days leading up to a
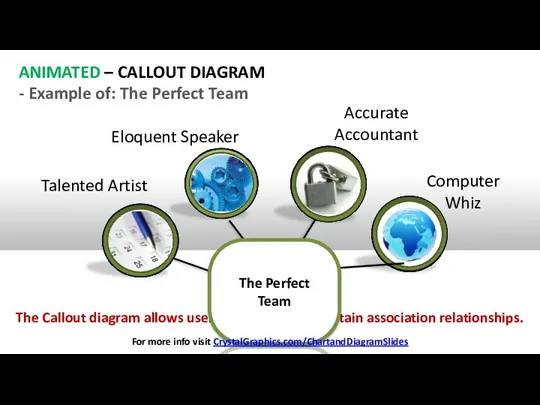
The Callout diagram allows users to set up and maintain association
The Callout diagram allows users to set up and maintain association
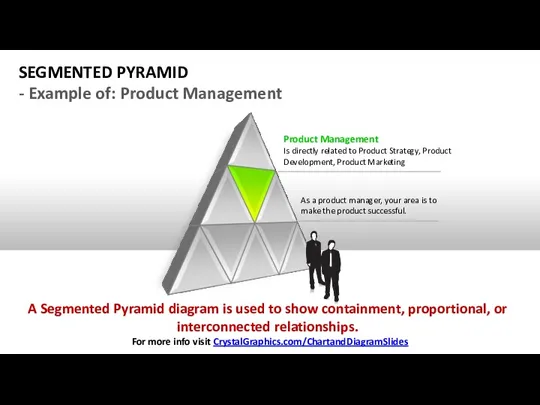
A Segmented Pyramid diagram is used to show containment, proportional, or interconnected
A Segmented Pyramid diagram is used to show containment, proportional, or interconnected
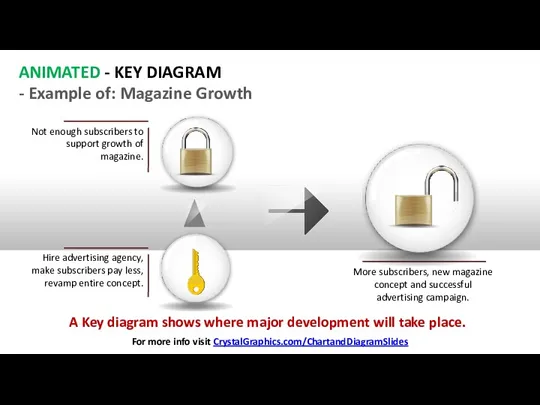
A Key diagram shows where major development will take place.
ANIMATED -
A Key diagram shows where major development will take place.
ANIMATED -
 Поколение ЭВМ
 Дидактическая игра Сравниваем предметы наложением
 Mesh Creation According to Predicted y+
 Формы и язык представления информации. Естественные и формальные языки
 Введение. Информация и информатика
 Что такое 3D-моделирование и где его применяют ?
 Working from your services to cloud Services and Cloud services. Module 4. Exploring Online Planning and Task Management
 Исполнитель Робот. Линейные алгоритмы
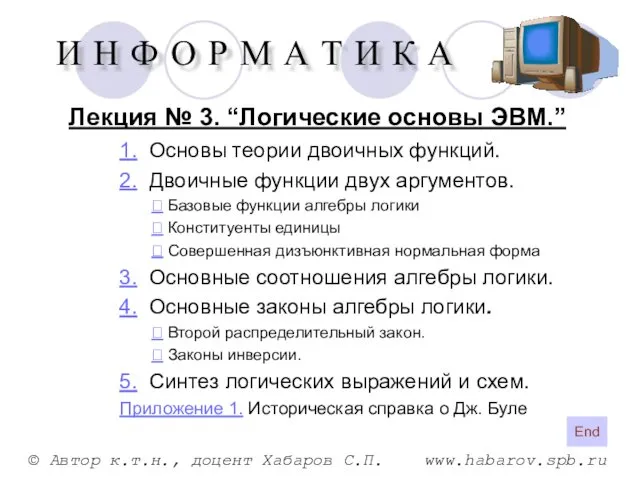 Логические основы ЭВМ
 Кодирование информации. Числовая информация. 2 класс
 Система контроля версий VCS
 Жадные алгоритмы
 Сети связи и системы коммутации
 Компьютерные вирусы и антивирусные программы
 Представления основанных на классах
 Языки программирования
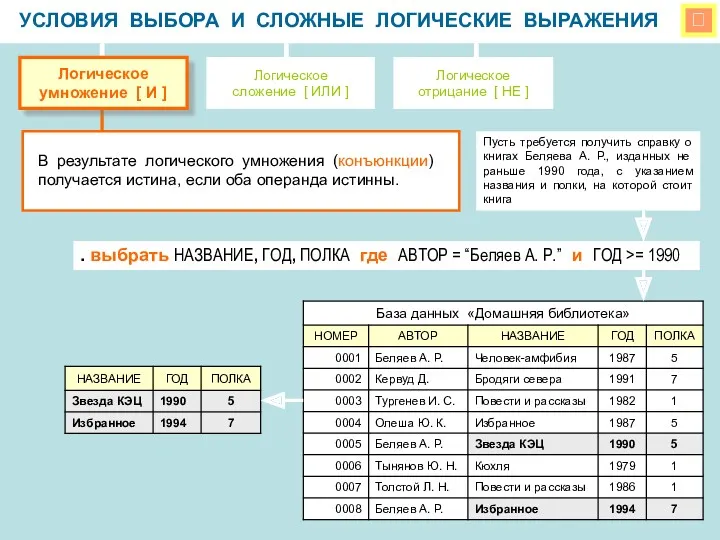 Условия выбора и сложные логические выражения
 Компьютер – универсальная машина для работы с информацией
 Облачное хранилище данных – это будущее. Будущее наступает сегодня
 Кодування і вимірювання обсягів інформації
 Виды памяти. Память персонального компьютера
 Модульное программирование. (Лекция 15)
 Символьные и строковые переменные
 FaceByte UI Review
 Maple 7 жүйесі мүмкіндіктерімен таныстыру
 Фотоаппараты и программы обработки фото
 Функции в PHP
 Оператор присваивания. Операторы ввода-вывода. Структура программы на Паскале