- Network monitoring & forensics

Содержание
- 2. Network Forensics Usefulness Intro to forensic data types Working with PCAP data What it looks like
- 3. Introduction Network forensics is the capture, recording, and analysis of network events in order to discover
- 4. Benefits Why do you care If this isn’t in your toolbelt already, you’ll get a lot
- 5. Disclaimer The information and views presented during this course concerning software or hardware does not in
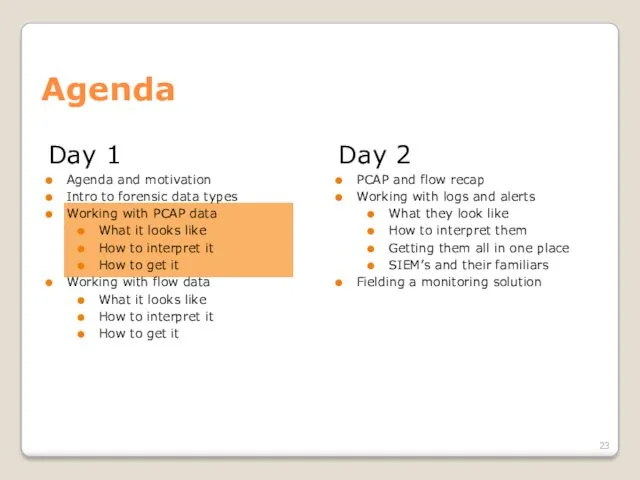
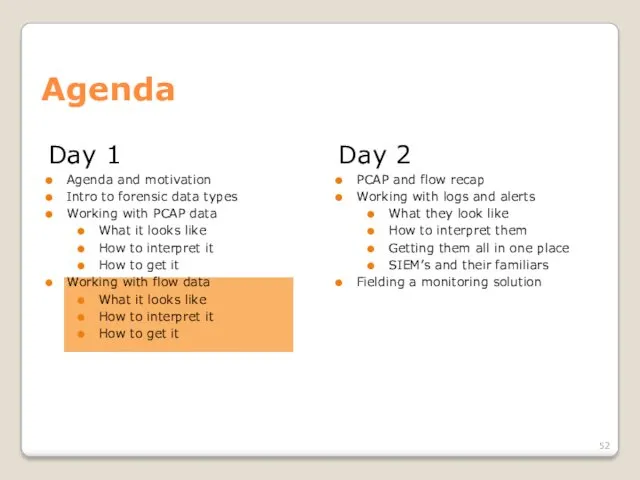
- 6. Day 1 Agenda and motivation Intro to forensic data types Working with PCAP data What it
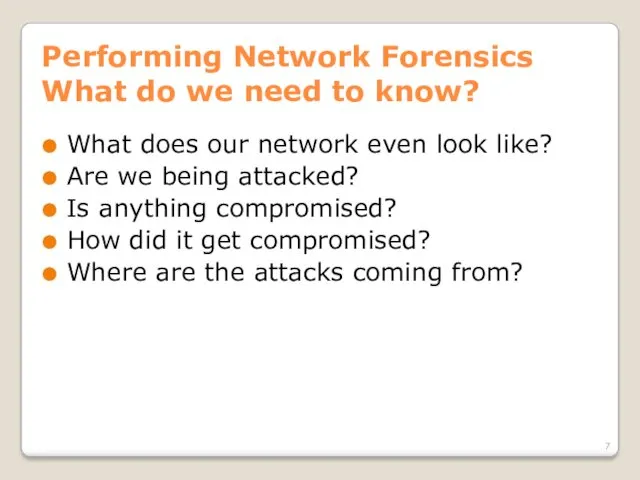
- 7. Performing Network Forensics What do we need to know? What does our network even look like?
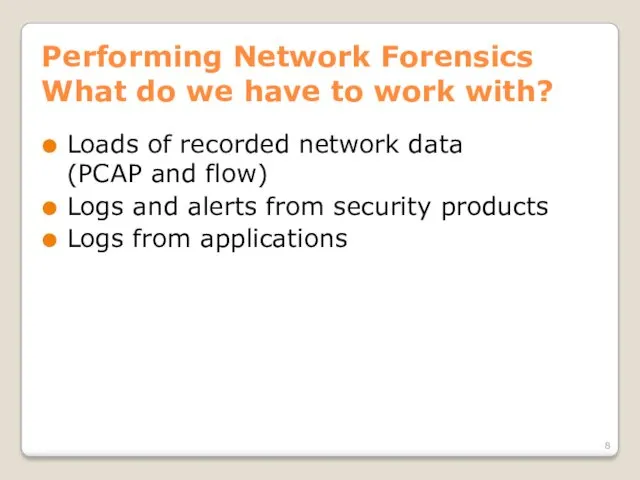
- 8. Performing Network Forensics What do we have to work with? Loads of recorded network data (PCAP
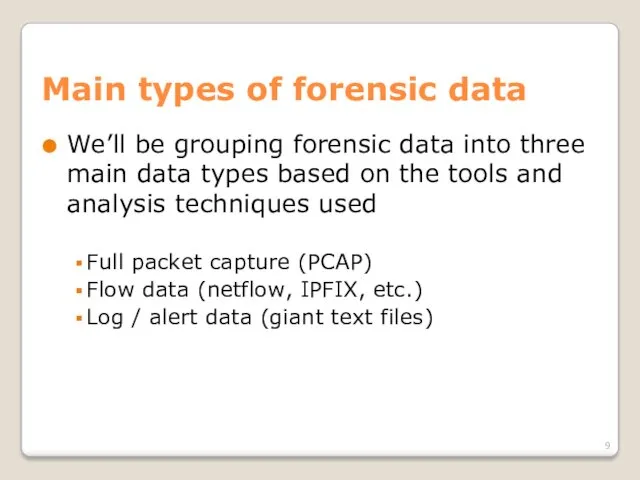
- 9. Main types of forensic data We’ll be grouping forensic data into three main data types based
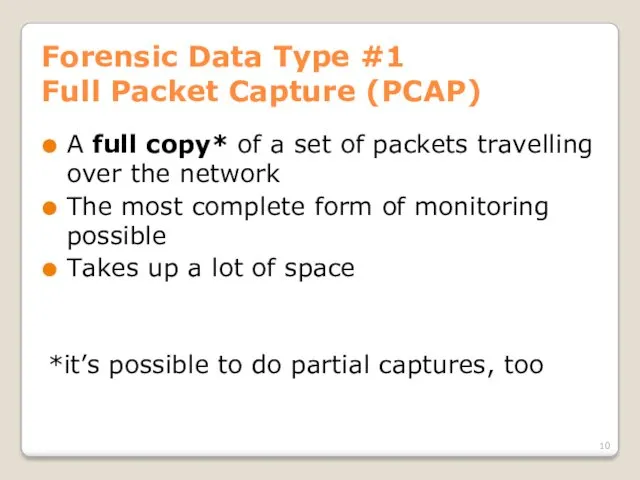
- 10. Forensic Data Type #1 Full Packet Capture (PCAP) A full copy* of a set of packets
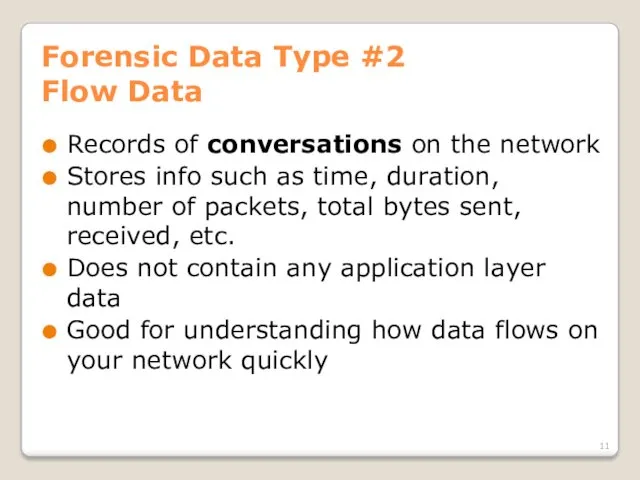
- 11. Forensic Data Type #2 Flow Data Records of conversations on the network Stores info such as
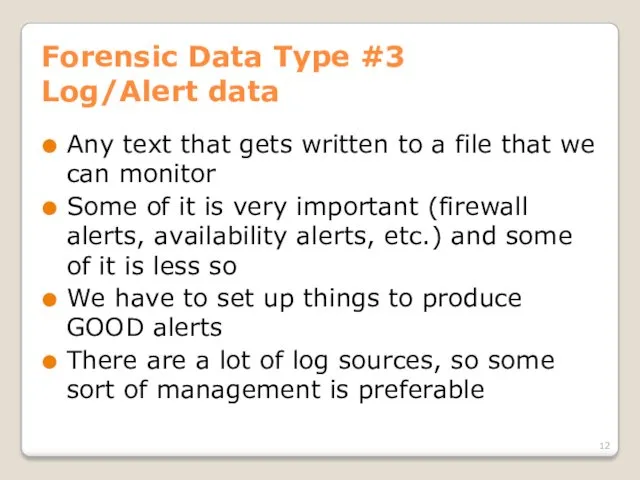
- 12. Forensic Data Type #3 Log/Alert data Any text that gets written to a file that we
- 13. Forensic Bonus Data People This is when someone comes up to you and tells you that
- 14. Forensic Data Type Comparison How do they differ?
- 15. So what do we capture and when? Whatever they’ll let you capture A lot of times
- 16. So what do we capture and when? First get your easy wins Turn on flow data
- 17. So what do we capture and when? Find out what you’re missing Look at your network
- 18. So what do we capture and when? Increase monitoring in trouble spots Grab PCAP data from
- 19. So what do we capture and when? Breakdown Log/alert data: Whenever possible, and particularly once you’ve
- 20. How you’ll typically start an investigation SIEM pops up an alert to your screen, fellow coworker,
- 21. How you’ll typically start an investigation Somebody hands you a big pile of PCAP or flow
- 22. How we’re going to learn this We’ll be exploring the data types starting at the most
- 23. Day 1 Agenda and motivation Intro to forensic data types Working with PCAP data What it
- 24. PCAP data Things to think about PCAP is a straight copy of ALL* network traffic that
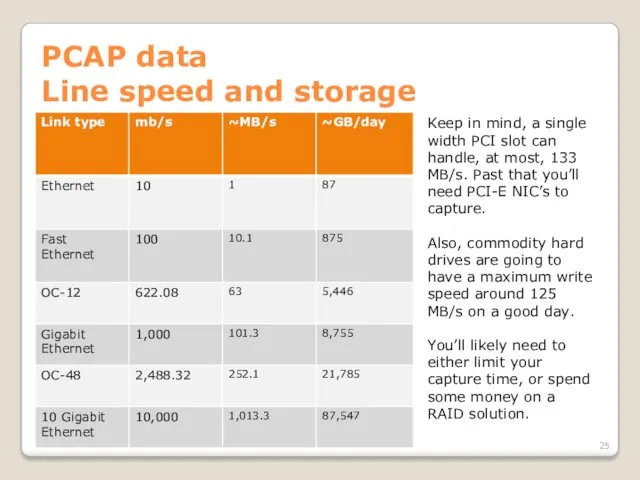
- 25. PCAP data Line speed and storage Keep in mind, a single width PCI slot can handle,
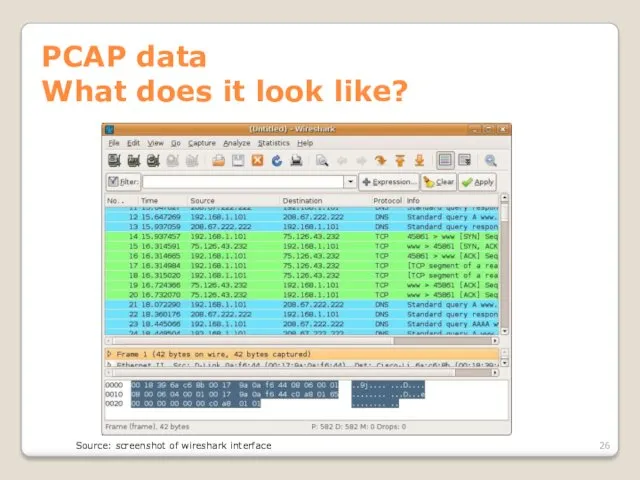
- 26. PCAP data What does it look like? Source: screenshot of wireshark interface
- 27. PCAP data How we get it Network taps Devices that are connected between two other network
- 28. PCAP data How we get it Network taps - keywords Half-duplex: Multiple monitor ports only reproduce
- 29. PCAP data How we get it Network taps – dealing with fiber Fiber taps actually split
- 30. PCAP data How we get it Network taps Source: netoptics.com, hackaday.com
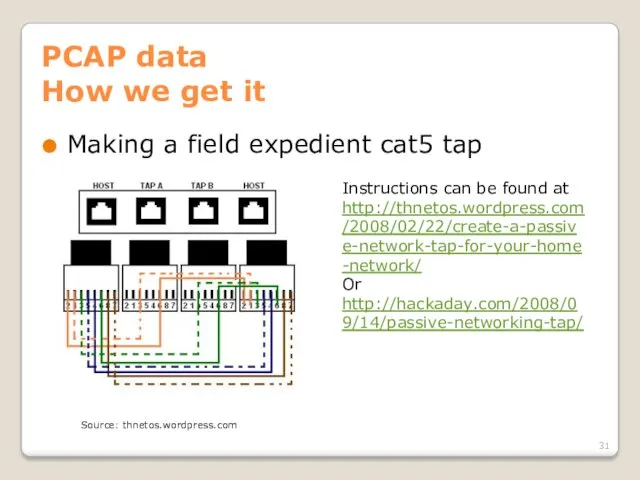
- 31. PCAP data How we get it Making a field expedient cat5 tap Instructions can be found
- 32. PCAP data How we get it SPAN ports Ports on most enterprise grade switches/routers which mirror
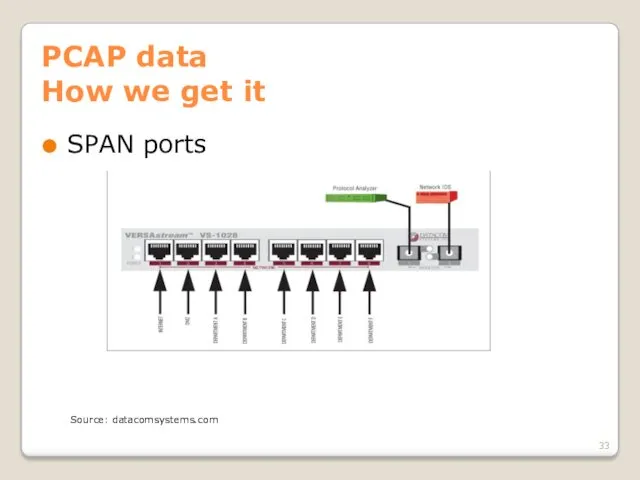
- 33. PCAP data How we get it SPAN ports Source: datacomsystems.com
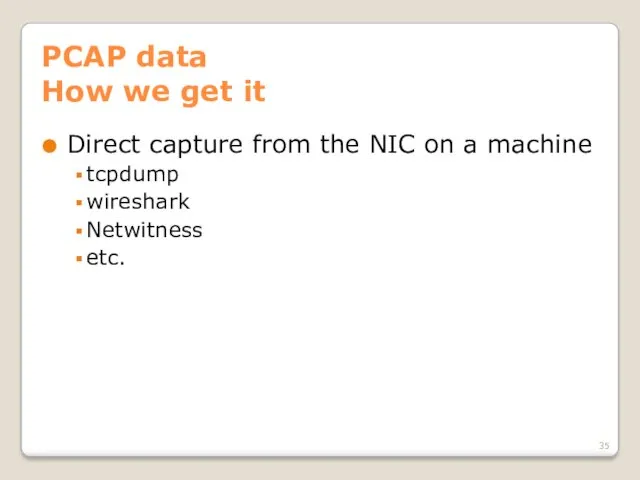
- 34. PCAP data How we get it Direct capture from the NIC on a machine You’ll always
- 35. PCAP data How we get it Direct capture from the NIC on a machine tcpdump wireshark
- 36. Network coverage – an aside Network coverage is how much of the traffic on the network
- 37. Network coverage – an aside Since different segments of the network carry different traffic, where you
- 38. Network coverage – an aside Things to think about NAT – solve with placement of sensors
- 39. Network coverage – an aside On the outside of your firewall, you see the attacks that
- 40. Network coverage – an aside In addition to the amount of the network that’s covered, we
- 41. PCAP data Hands on Now that we know where, why, and how to collect PCAP data,
- 42. PCAP data Doing analysis - Wireshark Wireshark is your good old fashioned, run of the mill,
- 43. PCAP data Doing analysis - Wireshark What we’ll be doing today Learning the layout of the
- 44. PCAP data Doing analysis - Wireshark Sources for pcaps http://wiki.wireshark.org/SampleCaptures http://packetlife.net/captures/ http://www.pcapr.net http://www.icir.org/enterprise-tracing/download.html Your own machine
- 45. PCAP data Doing analysis - Wireshark So that’s Wireshark. Pretty nice, huh? When it comes to
- 46. PCAP data Doing analysis - Wireshark But what if we don’t have time to do all
- 47. PCAP data Doing analysis - Netwitness What we’ll be doing today Learning the interface Importing some
- 48. PCAP data Doing analysis - Netwitness Netwitness is a tool for getting a quick picture of
- 49. PCAP data Doing analysis – Other tools In addition to sitting down and doing deep dive
- 50. PCAP data Generating flow and alert data Useful when someone hands you a big wad of
- 51. PCAP Data Conclusion When you have PCAP you can see pretty much everything. It’s very heavy
- 52. Day 1 Agenda and motivation Intro to forensic data types Working with PCAP data What it
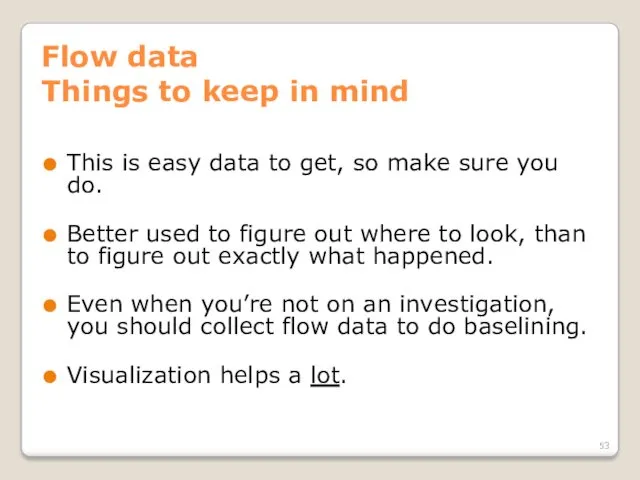
- 53. Flow data Things to keep in mind This is easy data to get, so make sure
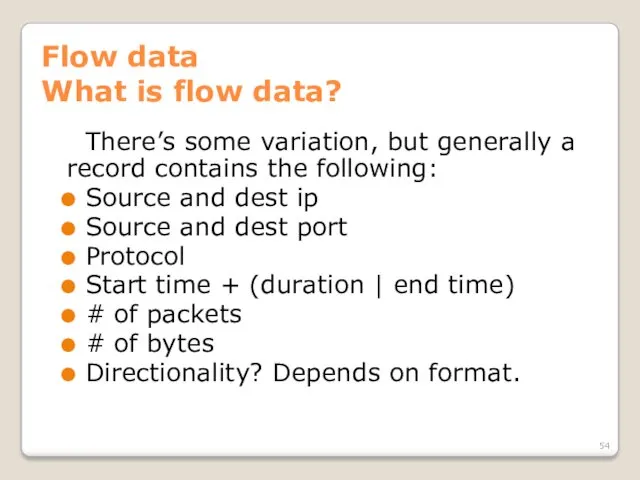
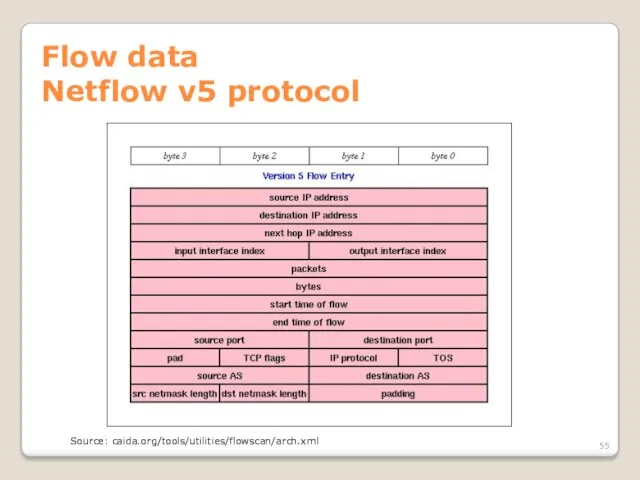
- 54. Flow data What is flow data? There’s some variation, but generally a record contains the following:
- 55. Flow data Netflow v5 protocol Source: caida.org/tools/utilities/flowscan/arch.xml
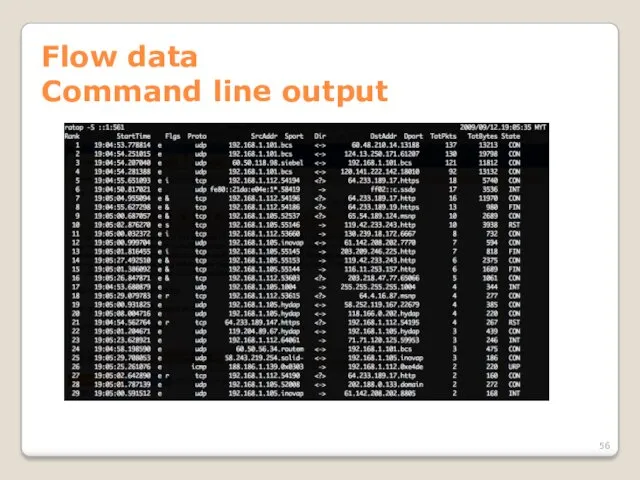
- 56. Flow data Command line output
- 57. Flow data Directionality Some types of flow records are unidirectional (SiLK, rw tools), and others are
- 58. Flow data Directionality Depending on what you need, you can convert between bidirectional and unidirectional using
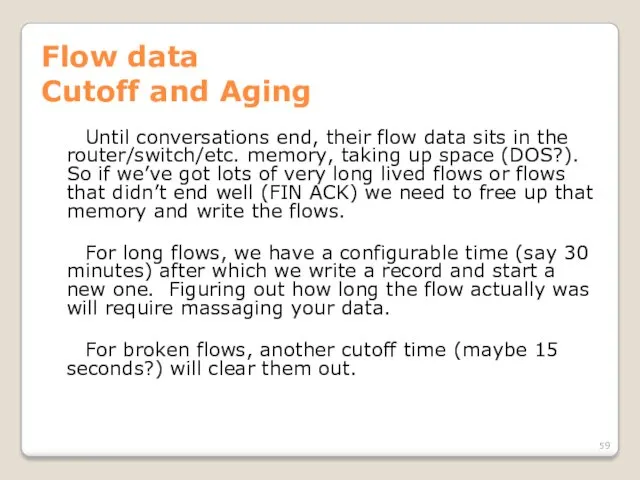
- 59. Flow data Cutoff and Aging Until conversations end, their flow data sits in the router/switch/etc. memory,
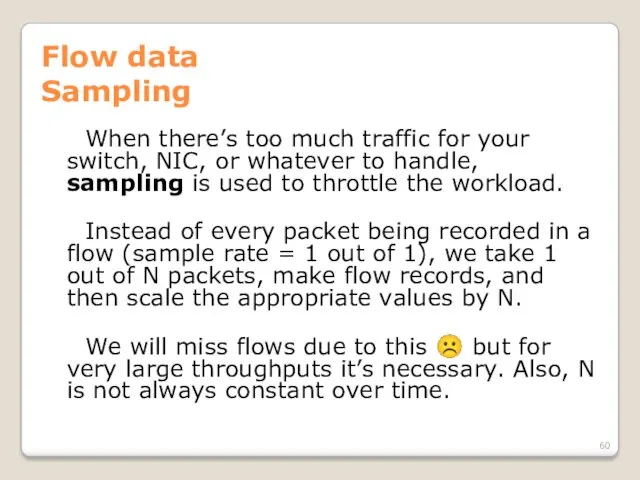
- 60. Flow data Sampling When there’s too much traffic for your switch, NIC, or whatever to handle,
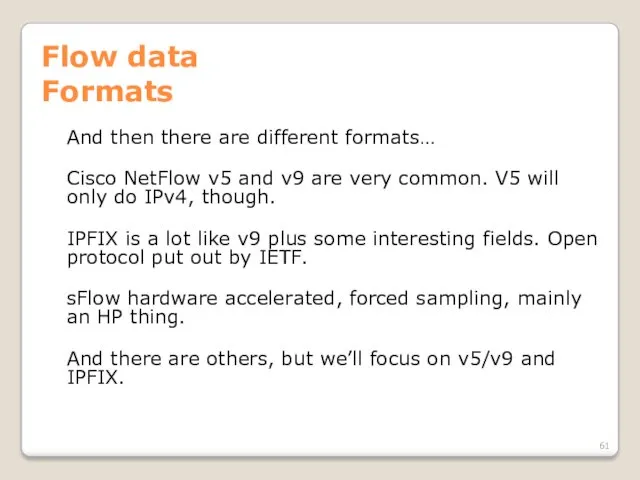
- 61. Flow data Formats And then there are different formats… Cisco NetFlow v5 and v9 are very
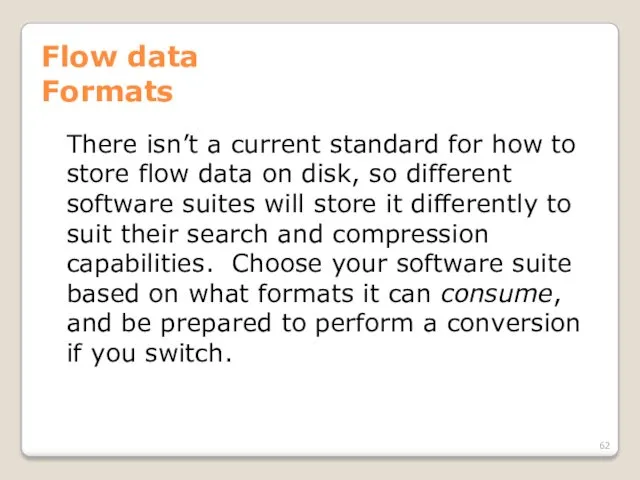
- 62. Flow data Formats There isn’t a current standard for how to store flow data on disk,
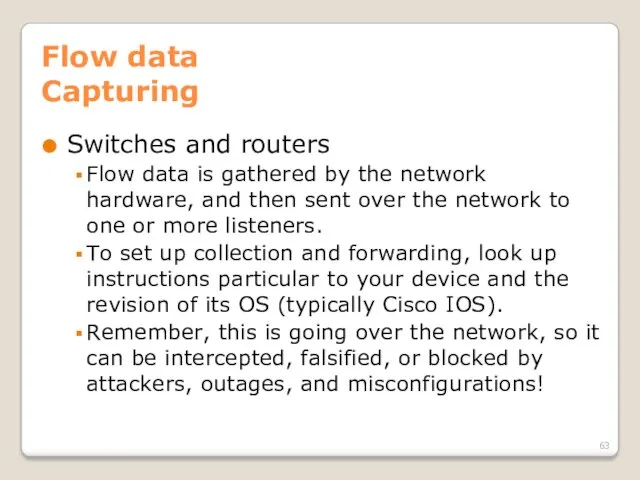
- 63. Flow data Capturing Switches and routers Flow data is gathered by the network hardware, and then
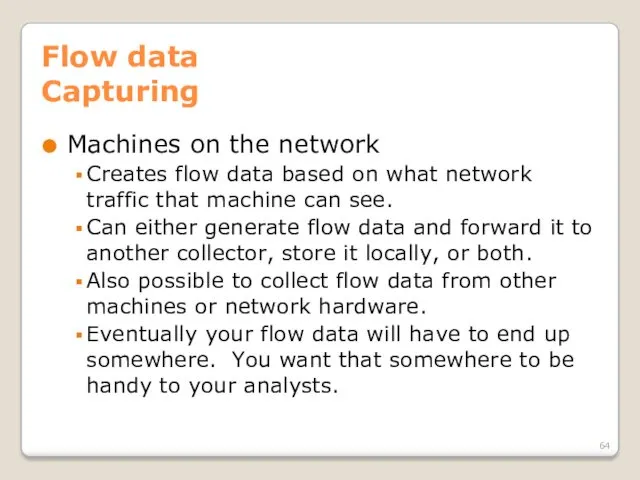
- 64. Flow data Capturing Machines on the network Creates flow data based on what network traffic that
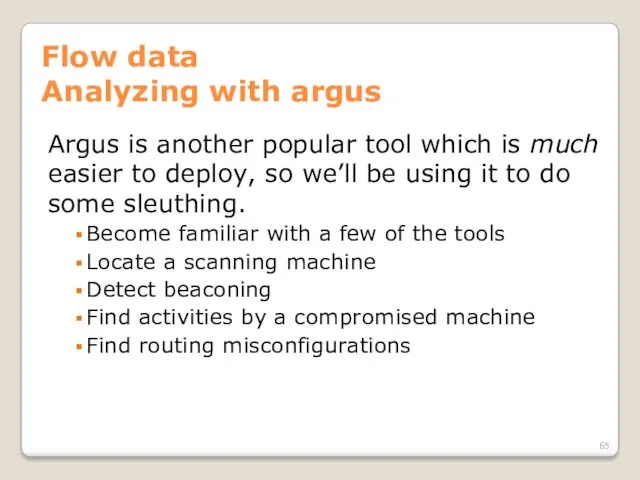
- 65. Flow data Analyzing with argus Argus is another popular tool which is much easier to deploy,
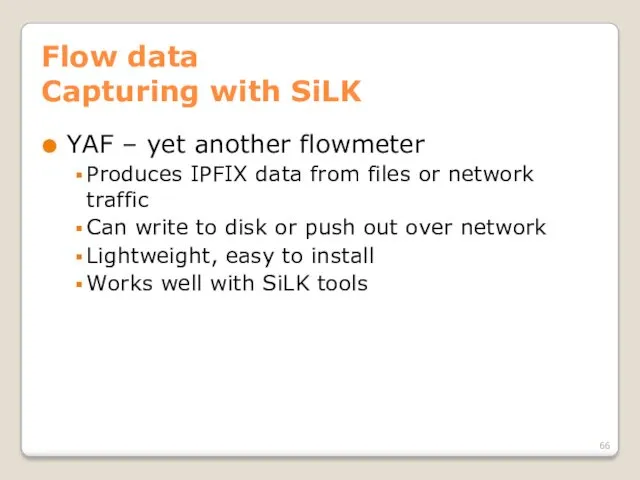
- 66. Flow data Capturing with SiLK YAF – yet another flowmeter Produces IPFIX data from files or
- 67. Flow data Capturing – consolidating in SiLK rwflowpack Part of the SiLK toolset Designed to receive
- 68. Flow data Analyzing with SiLK SiLK tools Produced by CERT NetSA Relatively easy to use We’ve
- 69. Flow data SiLK tools - conclusion Free, very powerful, extensible, pretty easy to use. Command line
- 70. Flow data Visualizing Open source Afterglow + graphviz: cheap, but too much work to set up
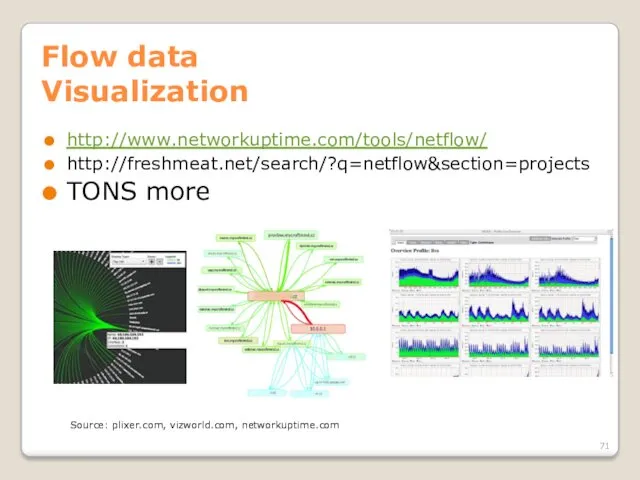
- 71. Flow data Visualization http://www.networkuptime.com/tools/netflow/ http://freshmeat.net/search/?q=netflow§ion=projects TONS more Source: plixer.com, vizworld.com, networkuptime.com
- 72. Flow data Continuing research Flowcon, Centaur Jam, etc. Come join us! Share your tools! Statistical anomaly/group
- 73. Day 1 Agenda and motivation Intro to forensic data types Working with PCAP data What it
- 74. PCAP reCAP Most granular data we can collect Takes a lot of resources to gather Great
- 75. FLOW reFLOW Info about conversations on the network Cheap and easy to collect Quick to analyze
- 76. Learning styles to use More tool use? More theory? More collaboration! You’ve got threats. I’ve got
- 77. Questions about anything up to now?
- 78. Day 1 Agenda and motivation Intro to forensic data types Working with PCAP data What it
- 79. Log/Alert data What are we dealing with? Logs are any continual text output stored by applications
- 80. Log data Typical sources Web server Web proxy DNS Operating system (/var/log/*) SMTP Whatever you’re using
- 81. Alert data Typical sources IDS Firewall Host based IDS SIEM (Security Information & Event Manager) Your
- 82. Alert data Redundant IDS, etc? Extra configuration Add personnel When one dies- “Multiple TippingPoint IPS Malformed
- 83. Alert data Let’s go set up some triggers Here’s how you go about getting good alerts
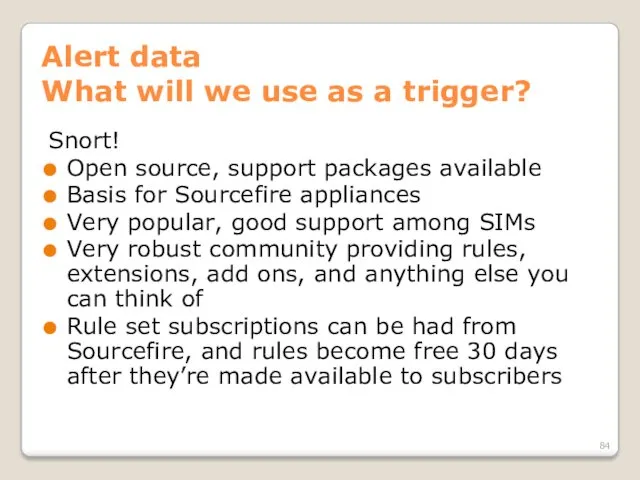
- 84. Alert data What will we use as a trigger? Snort! Open source, support packages available Basis
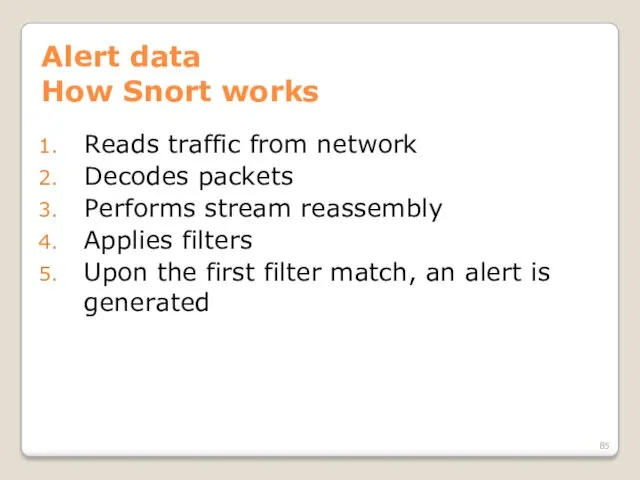
- 85. Alert data How Snort works Reads traffic from network Decodes packets Performs stream reassembly Applies filters
- 86. Alert data Writing Snort rules Fire up your VM’s. Time to go to work. We’re going
- 87. Alert data Writing better rules Write to the vulnerability, not the exploit Understand the base rate
- 88. Log/Alert data Priority of sources Obviously not all data is equal, so here’s the basic order
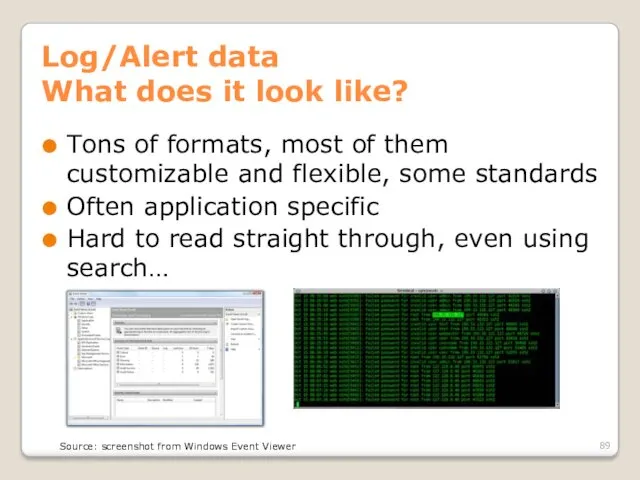
- 89. Log/Alert data What does it look like? Tons of formats, most of them customizable and flexible,
- 90. Alert data Event formats CEE – Common Event Expression CVE – Vulnerability CCE – Configuration CWE
- 91. Log/Alert data Dealing with disparate data There’s too much text and not enough context. We need
- 92. Log/Alert data SIM, SEM, SIEM… SIM = Security Information Management SEM = Security Event Management SIEM
- 93. Log/Alert data SIEMs Perform event correlation, reduce false positives Help filter logs and alerts to bring
- 94. Log/Alert data Some common managers/SIEMs Splunk: free version will read 500MB/day of logs, has a decent
- 95. Log/Alert data Using Splunk Splunk is common enough that it’s worth your time to get to
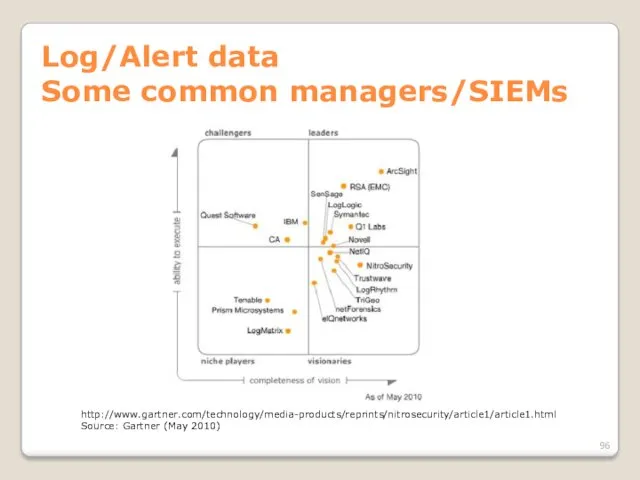
- 96. Log/Alert data Some common managers/SIEMs http://www.gartner.com/technology/media-products/reprints/nitrosecurity/article1/article1.html Source: Gartner (May 2010)
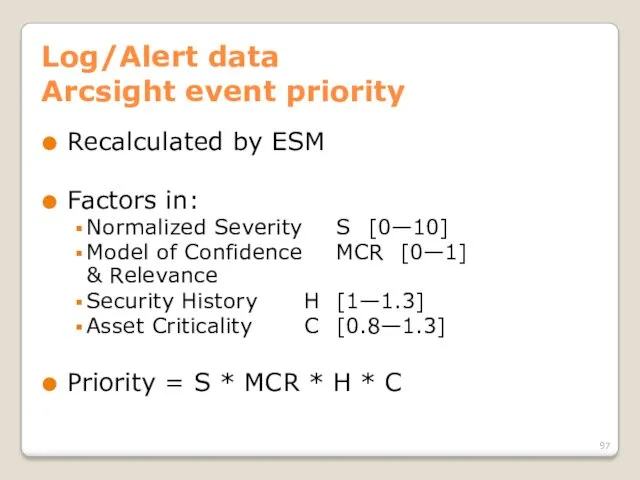
- 97. Log/Alert data Arcsight event priority Recalculated by ESM Factors in: Normalized Severity S [0—10] Model of
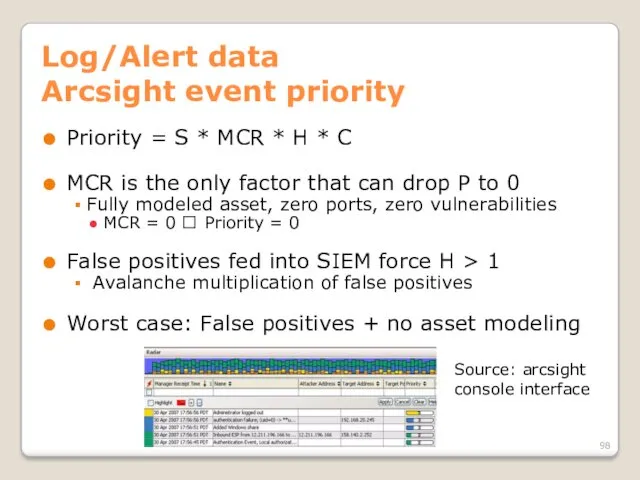
- 98. Log/Alert data Arcsight event priority Priority = S * MCR * H * C MCR is
- 99. Log/Alert data Using SIEMs effectively Understand the complexity of the tools you are using and allocate
- 100. Deploying a monitoring solution What you need to monitor a network will vary greatly depending on
- 101. Extended topics (if we have time) Privacy/confidentiality laws Attacking network monitoring devices Evading network monitoring Wireless
- 103. Скачать презентацию
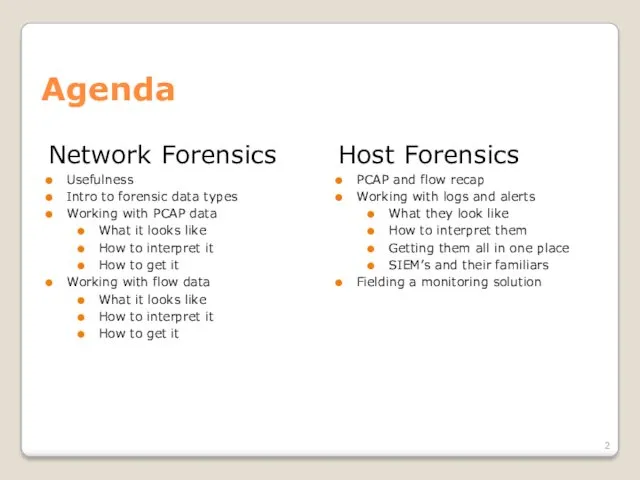
Network Forensics
Usefulness
Intro to forensic data types
Working with PCAP data
What it looks
Network Forensics
Usefulness
Intro to forensic data types
Working with PCAP data
What it looks
Introduction
Network forensics is the capture, recording, and analysis of network events
Introduction
Network forensics is the capture, recording, and analysis of network events

Benefits
Why do you care
If this isn’t in your toolbelt already, you’ll
Benefits
Why do you care
If this isn’t in your toolbelt already, you’ll
Disclaimer
The information and views presented during this course concerning software or
Disclaimer
The information and views presented during this course concerning software or
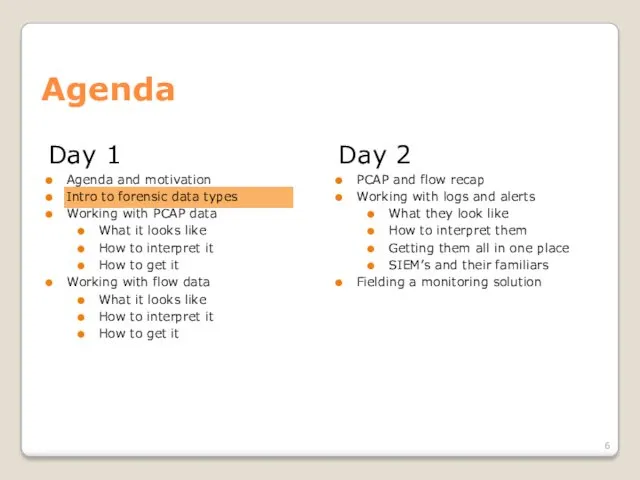
Day 1
Agenda and motivation
Intro to forensic data types
Working with PCAP data
What
Day 1
Agenda and motivation
Intro to forensic data types
Working with PCAP data
What
Performing Network Forensics
What do we need to know?
What does our network
Performing Network Forensics
What do we need to know?
What does our network
Performing Network Forensics
What do we have to work with?
Loads of recorded
Performing Network Forensics
What do we have to work with?
Loads of recorded
Main types of forensic data
We’ll be grouping forensic data into three
Main types of forensic data
We’ll be grouping forensic data into three
Forensic Data Type #1
Full Packet Capture (PCAP)
A full copy* of a
Forensic Data Type #1
Full Packet Capture (PCAP)
A full copy* of a
Forensic Data Type #2
Flow Data
Records of conversations on the network
Stores info
Forensic Data Type #2
Flow Data
Records of conversations on the network
Stores info
Forensic Data Type #3
Log/Alert data
Any text that gets written to a
Forensic Data Type #3
Log/Alert data
Any text that gets written to a
Forensic Bonus Data
People
This is when someone comes up to you and
Forensic Bonus Data
People
This is when someone comes up to you and
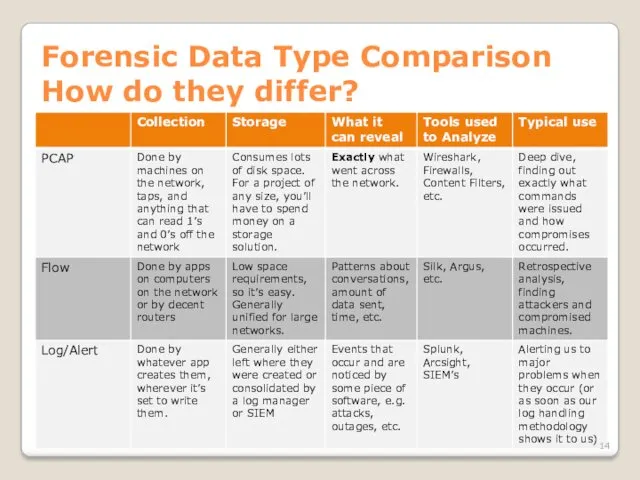
Forensic Data Type Comparison
How do they differ?
Forensic Data Type Comparison
How do they differ?
So what do we capture and when?
Whatever they’ll let you capture
A
So what do we capture and when?
Whatever they’ll let you capture
A
So what do we capture and when?
First get your easy wins
Turn
So what do we capture and when?
First get your easy wins
Turn
So what do we capture and when?
Find out what you’re missing
Look
So what do we capture and when?
Find out what you’re missing
Look
So what do we capture and when?
Increase monitoring in trouble spots
Grab
So what do we capture and when?
Increase monitoring in trouble spots
Grab
So what do we capture and when?
Breakdown
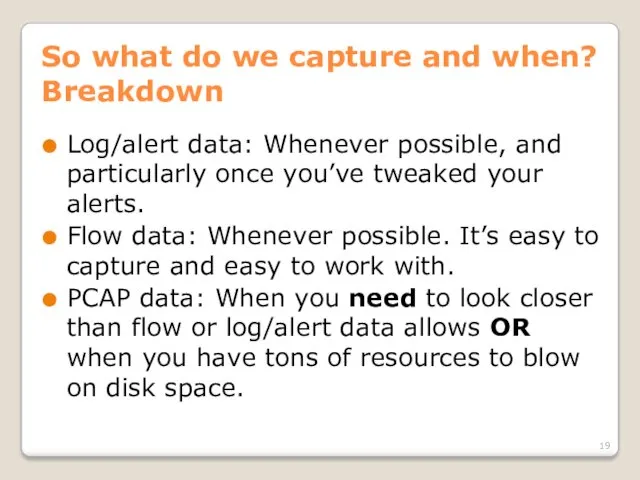
Log/alert data: Whenever possible, and
So what do we capture and when?
Breakdown
Log/alert data: Whenever possible, and
How you’ll typically start an investigation
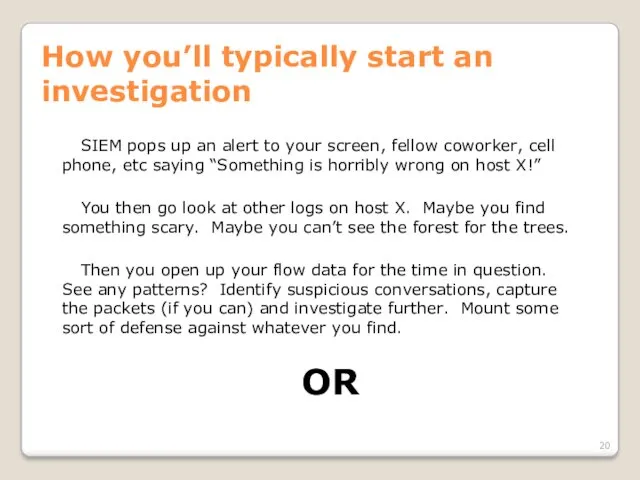
SIEM pops up an alert to
How you’ll typically start an investigation
SIEM pops up an alert to
How you’ll typically start an investigation
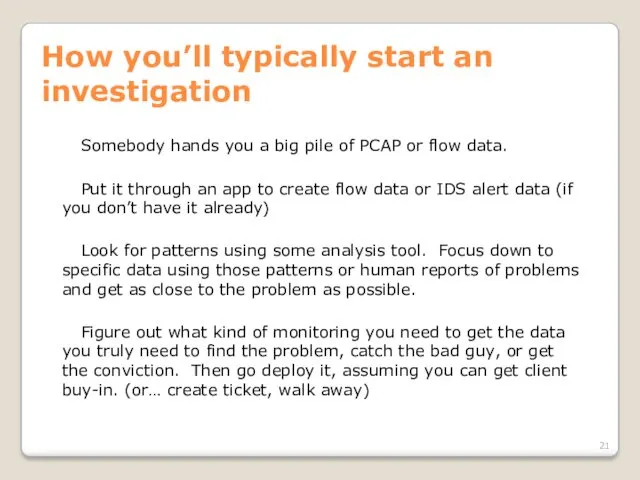
Somebody hands you a big pile
How you’ll typically start an investigation
Somebody hands you a big pile
How we’re going to learn this
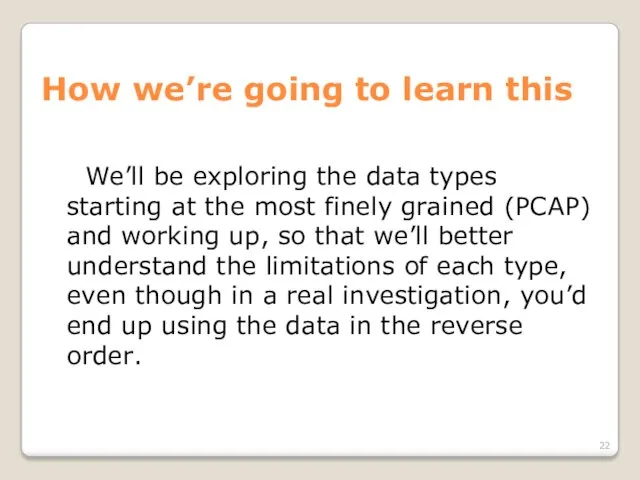
We’ll be exploring the data types
How we’re going to learn this
We’ll be exploring the data types
Day 1
Agenda and motivation
Intro to forensic data types
Working with PCAP data
What
Day 1
Agenda and motivation
Intro to forensic data types
Working with PCAP data
What
PCAP data
Things to think about
PCAP is a straight copy of ALL*
PCAP data
Things to think about
PCAP is a straight copy of ALL*
PCAP data
Line speed and storage
Keep in mind, a single width PCI
PCAP data
Line speed and storage
Keep in mind, a single width PCI
PCAP data
What does it look like?
Source: screenshot of wireshark interface
PCAP data
What does it look like?
Source: screenshot of wireshark interface
PCAP data
How we get it
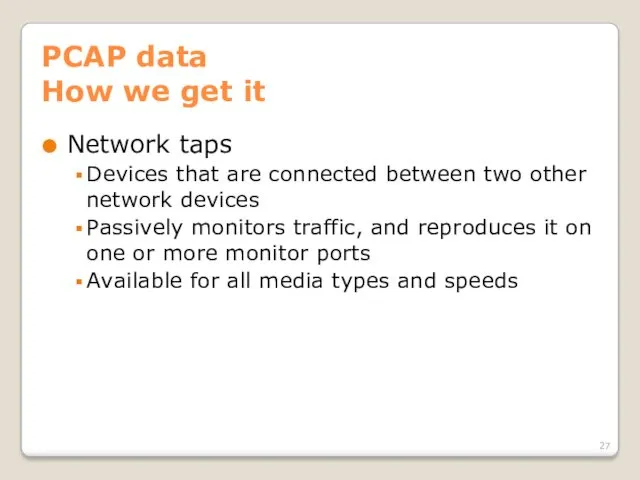
Network taps
Devices that are connected between
PCAP data
How we get it
Network taps
Devices that are connected between
PCAP data
How we get it
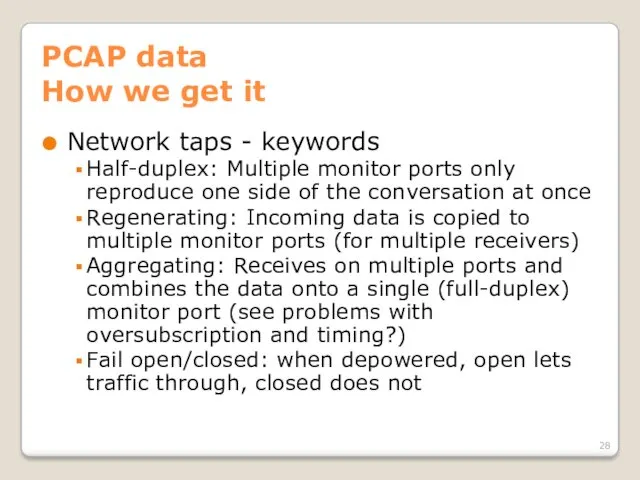
Network taps - keywords
Half-duplex: Multiple monitor ports
PCAP data
How we get it
Network taps - keywords
Half-duplex: Multiple monitor ports
PCAP data
How we get it
Network taps – dealing with fiber
Fiber taps
PCAP data
How we get it
Network taps – dealing with fiber
Fiber taps
PCAP data
How we get it
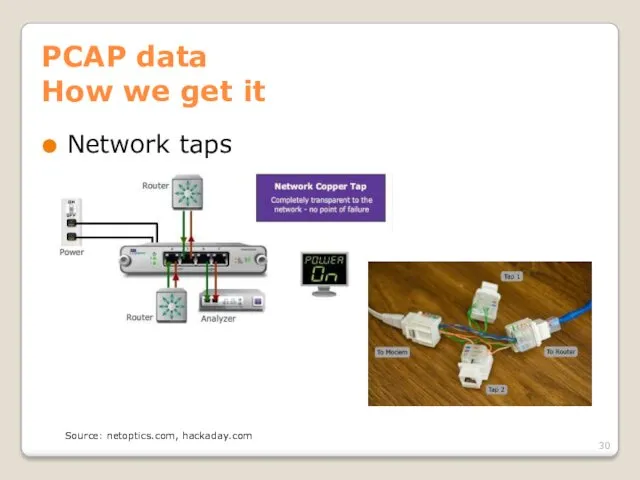
Network taps
Source: netoptics.com, hackaday.com
PCAP data
How we get it
Network taps
Source: netoptics.com, hackaday.com
PCAP data
How we get it
Making a field expedient cat5 tap
Instructions
PCAP data
How we get it
Making a field expedient cat5 tap
Instructions
PCAP data
How we get it
SPAN ports
Ports on most enterprise grade switches/routers
PCAP data
How we get it
SPAN ports
Ports on most enterprise grade switches/routers
PCAP data
How we get it
SPAN ports
Source: datacomsystems.com
PCAP data
How we get it
SPAN ports
Source: datacomsystems.com
PCAP data
How we get it
Direct capture from the NIC on a
PCAP data
How we get it
Direct capture from the NIC on a
PCAP data
How we get it
Direct capture from the NIC on a
PCAP data
How we get it
Direct capture from the NIC on a
Network coverage – an aside
Network coverage is how much of the
Network coverage – an aside
Network coverage is how much of the
Network coverage – an aside
Since different segments of the network carry
Network coverage – an aside
Since different segments of the network carry
Network coverage – an aside
Things to think about
NAT – solve with
Network coverage – an aside
Things to think about
NAT – solve with
Network coverage – an aside
On the outside of your firewall, you
Network coverage – an aside
On the outside of your firewall, you
Network coverage – an aside
In addition to the amount of the
Network coverage – an aside
In addition to the amount of the
PCAP data
Hands on
Now that we know where, why, and how to
PCAP data
Hands on
Now that we know where, why, and how to
PCAP data
Doing analysis - Wireshark
Wireshark is your good old fashioned, run
PCAP data
Doing analysis - Wireshark
Wireshark is your good old fashioned, run
PCAP data
Doing analysis - Wireshark
What we’ll be doing today
Learning the layout
PCAP data
Doing analysis - Wireshark
What we’ll be doing today
Learning the layout
PCAP data
Doing analysis - Wireshark
Sources for pcaps
http://wiki.wireshark.org/SampleCaptures
http://packetlife.net/captures/
http://www.pcapr.net
http://www.icir.org/enterprise-tracing/download.html
Your own machine
PCAP data
Doing analysis - Wireshark
Sources for pcaps
http://wiki.wireshark.org/SampleCaptures
http://packetlife.net/captures/
http://www.pcapr.net
http://www.icir.org/enterprise-tracing/download.html
Your own machine
PCAP data
Doing analysis - Wireshark
So that’s Wireshark. Pretty nice, huh? When
PCAP data
Doing analysis - Wireshark
So that’s Wireshark. Pretty nice, huh? When
PCAP data
Doing analysis - Wireshark
But what if we don’t have time
PCAP data
Doing analysis - Wireshark
But what if we don’t have time
PCAP data
Doing analysis - Netwitness
What we’ll be doing today
Learning the interface
Importing
PCAP data
Doing analysis - Netwitness
What we’ll be doing today
Learning the interface
Importing
PCAP data
Doing analysis - Netwitness
Netwitness is a tool for getting a
PCAP data
Doing analysis - Netwitness
Netwitness is a tool for getting a
PCAP data
Doing analysis – Other tools
In addition to sitting down and
PCAP data
Doing analysis – Other tools
In addition to sitting down and
PCAP data
Generating flow and alert data
Useful when someone hands you
PCAP data
Generating flow and alert data
Useful when someone hands you
PCAP Data
Conclusion
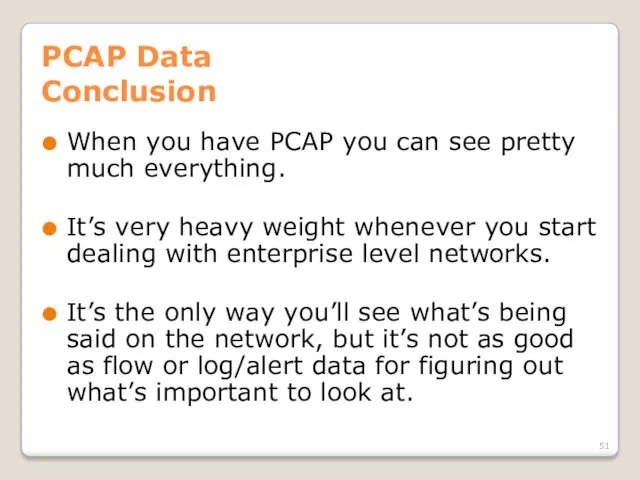
When you have PCAP you can see pretty much everything.
It’s
PCAP Data
Conclusion
When you have PCAP you can see pretty much everything.
It’s
Day 1
Agenda and motivation
Intro to forensic data types
Working with PCAP data
What
Day 1
Agenda and motivation
Intro to forensic data types
Working with PCAP data
What
Flow data
Things to keep in mind
This is easy data to get,
Flow data
Things to keep in mind
This is easy data to get,
Flow data
What is flow data?
There’s some variation, but generally a record
Flow data
What is flow data?
There’s some variation, but generally a record
Flow data
Netflow v5 protocol
Source: caida.org/tools/utilities/flowscan/arch.xml
Flow data
Netflow v5 protocol
Source: caida.org/tools/utilities/flowscan/arch.xml
Flow data
Command line output
Flow data
Command line output
Flow data
Directionality
Some types of flow records are unidirectional (SiLK, rw tools),
Flow data
Directionality
Some types of flow records are unidirectional (SiLK, rw tools),
Flow data
Directionality
Depending on what you need, you can convert between bidirectional
Flow data
Directionality
Depending on what you need, you can convert between bidirectional
Flow data
Cutoff and Aging
Until conversations end, their flow data sits in
Flow data
Cutoff and Aging
Until conversations end, their flow data sits in
Flow data
Sampling
When there’s too much traffic for your switch, NIC, or
Flow data
Sampling
When there’s too much traffic for your switch, NIC, or
Flow data
Formats
And then there are different formats…
Cisco NetFlow v5 and v9
Flow data
Formats
And then there are different formats…
Cisco NetFlow v5 and v9
Flow data
Formats
There isn’t a current standard for how to store flow
Flow data
Formats
There isn’t a current standard for how to store flow
Flow data
Capturing
Switches and routers
Flow data is gathered by the network hardware,
Flow data
Capturing
Switches and routers
Flow data is gathered by the network hardware,
Flow data
Capturing
Machines on the network
Creates flow data based on what network
Flow data
Capturing
Machines on the network
Creates flow data based on what network
Flow data
Analyzing with argus
Argus is another popular tool which is much
Flow data
Analyzing with argus
Argus is another popular tool which is much
Flow data
Capturing with SiLK
YAF – yet another flowmeter
Produces IPFIX data from
Flow data
Capturing with SiLK
YAF – yet another flowmeter
Produces IPFIX data from
Flow data
Capturing – consolidating in SiLK
rwflowpack
Part of the SiLK toolset
Designed to
Flow data
Capturing – consolidating in SiLK
rwflowpack
Part of the SiLK toolset
Designed to
Flow data
Analyzing with SiLK
SiLK tools
Produced by CERT NetSA
Relatively easy to use
We’ve
Flow data
Analyzing with SiLK
SiLK tools
Produced by CERT NetSA
Relatively easy to use
We’ve
Flow data
SiLK tools - conclusion
Free, very powerful, extensible, pretty easy to
Flow data
SiLK tools - conclusion
Free, very powerful, extensible, pretty easy to
Flow data
Visualizing
Open source
Afterglow + graphviz: cheap, but too much work to
Flow data
Visualizing
Open source
Afterglow + graphviz: cheap, but too much work to
Flow data
Visualization
http://www.networkuptime.com/tools/netflow/
http://freshmeat.net/search/?q=netflow§ion=projects
TONS more
Source: plixer.com, vizworld.com, networkuptime.com
Flow data
Visualization
http://www.networkuptime.com/tools/netflow/
http://freshmeat.net/search/?q=netflow§ion=projects
TONS more
Source: plixer.com, vizworld.com, networkuptime.com
Flow data
Continuing research
Flowcon, Centaur Jam, etc.
Come join us!
Share your tools!
Statistical anomaly/group
Flow data
Continuing research
Flowcon, Centaur Jam, etc.
Come join us!
Share your tools!
Statistical anomaly/group
Day 1
Agenda and motivation
Intro to forensic data types
Working with PCAP data
What
Day 1
Agenda and motivation
Intro to forensic data types
Working with PCAP data
What
PCAP reCAP
Most granular data we can collect
Takes a lot of resources
PCAP reCAP
Most granular data we can collect
Takes a lot of resources
FLOW reFLOW
Info about conversations on the network
Cheap and easy to collect
Quick
FLOW reFLOW
Info about conversations on the network
Cheap and easy to collect
Quick
Learning styles to use
More tool use?
More theory?
More collaboration!
You’ve got threats. I’ve
Learning styles to use
More tool use?
More theory?
More collaboration!
You’ve got threats. I’ve

Questions about anything up to now?
Questions about anything up to now?
Day 1
Agenda and motivation
Intro to forensic data types
Working with PCAP data
What
Day 1
Agenda and motivation
Intro to forensic data types
Working with PCAP data
What
Log/Alert data
What are we dealing with?
Logs are any continual text output
Log/Alert data
What are we dealing with?
Logs are any continual text output
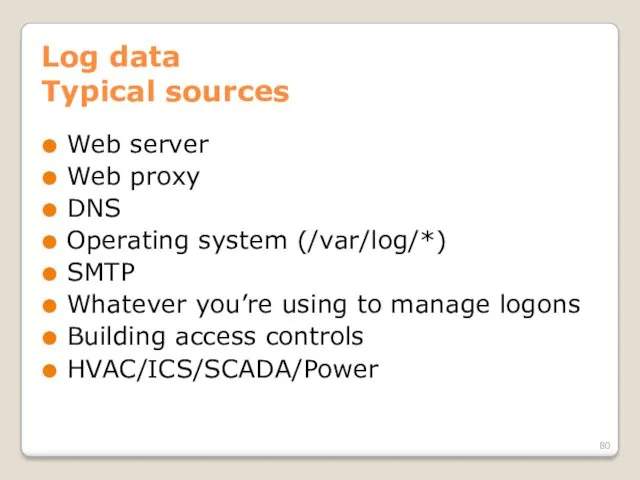
Log data
Typical sources
Web server
Web proxy
DNS
Operating system (/var/log/*)
SMTP
Whatever you’re using to
Log data
Typical sources
Web server
Web proxy
DNS
Operating system (/var/log/*)
SMTP
Whatever you’re using to
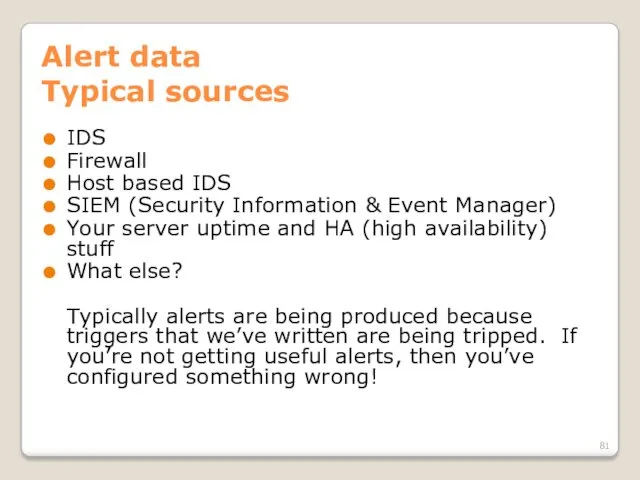
Alert data
Typical sources
IDS
Firewall
Host based IDS
SIEM (Security Information & Event Manager)
Your
Alert data
Typical sources
IDS
Firewall
Host based IDS
SIEM (Security Information & Event Manager)
Your
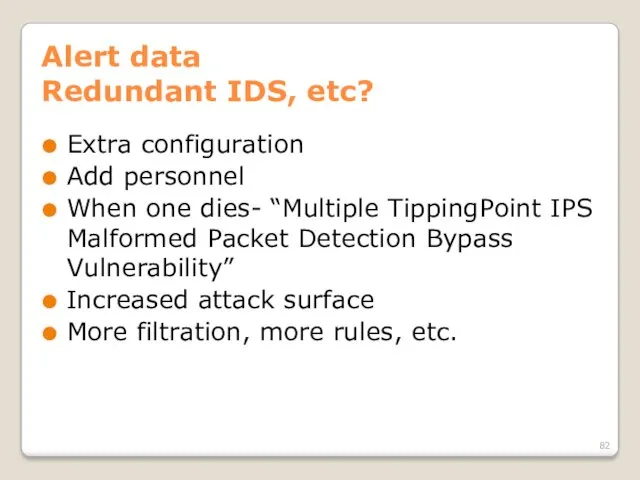
Alert data
Redundant IDS, etc?
Extra configuration
Add personnel
When one dies- “Multiple TippingPoint IPS
Alert data
Redundant IDS, etc?
Extra configuration
Add personnel
When one dies- “Multiple TippingPoint IPS
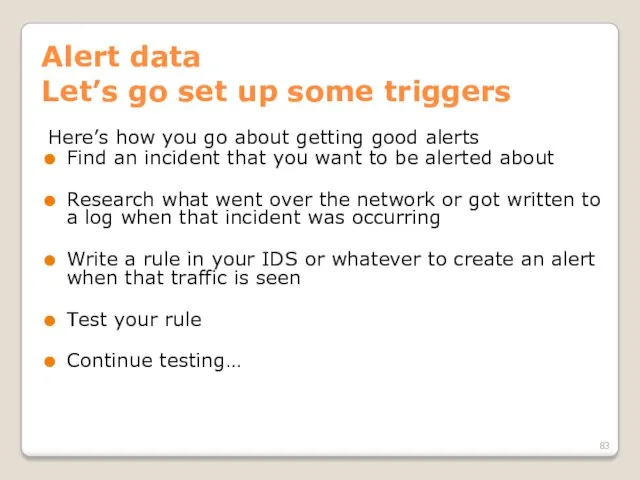
Alert data
Let’s go set up some triggers
Here’s how you go about
Alert data
Let’s go set up some triggers
Here’s how you go about
Alert data
What will we use as a trigger?
Snort!
Open source, support packages
Alert data
What will we use as a trigger?
Snort!
Open source, support packages
Alert data
How Snort works
Reads traffic from network
Decodes packets
Performs stream reassembly
Applies filters
Upon
Alert data
How Snort works
Reads traffic from network
Decodes packets
Performs stream reassembly
Applies filters
Upon
Alert data
Writing Snort rules
Fire up your VM’s. Time to go to
Alert data
Writing Snort rules
Fire up your VM’s. Time to go to
Alert data
Writing better rules
Write to the vulnerability, not the exploit
Understand the
Alert data
Writing better rules
Write to the vulnerability, not the exploit
Understand the
Log/Alert data
Priority of sources
Obviously not all data is equal, so here’s
Log/Alert data
Priority of sources
Obviously not all data is equal, so here’s
Log/Alert data
What does it look like?
Tons of formats, most of them
Log/Alert data
What does it look like?
Tons of formats, most of them
Alert data
Event formats
CEE – Common Event Expression
CVE – Vulnerability
CCE – Configuration
CWE
Alert data
Event formats
CEE – Common Event Expression
CVE – Vulnerability
CCE – Configuration
CWE
Log/Alert data
Dealing with disparate data
There’s too much text and not enough
Log/Alert data
Dealing with disparate data
There’s too much text and not enough
Log/Alert data
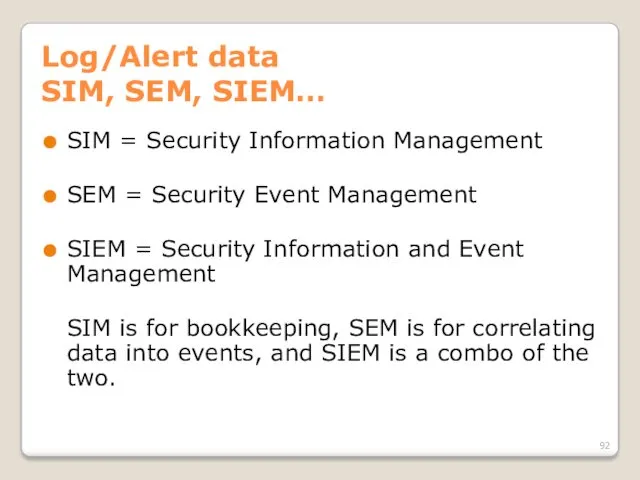
SIM, SEM, SIEM…
SIM = Security Information Management
SEM = Security Event
Log/Alert data
SIM, SEM, SIEM…
SIM = Security Information Management
SEM = Security Event
Log/Alert data
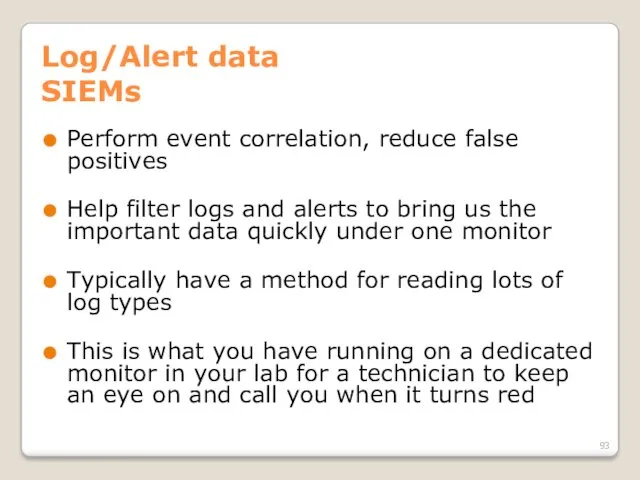
SIEMs
Perform event correlation, reduce false positives
Help filter logs and alerts
Log/Alert data
SIEMs
Perform event correlation, reduce false positives
Help filter logs and alerts
Log/Alert data
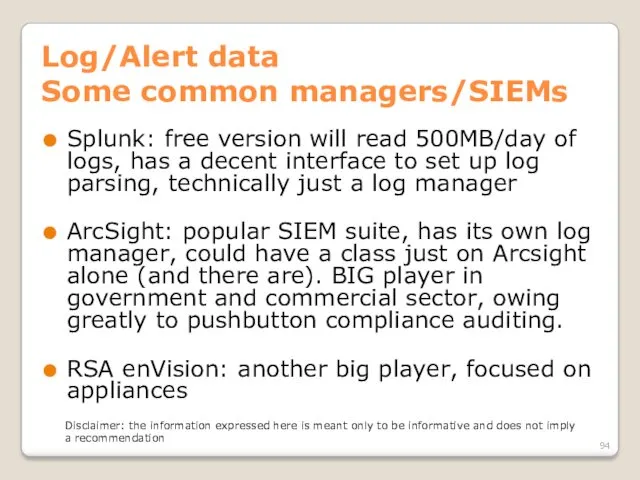
Some common managers/SIEMs
Splunk: free version will read 500MB/day of logs,
Log/Alert data
Some common managers/SIEMs
Splunk: free version will read 500MB/day of logs,
Log/Alert data
Using Splunk
Splunk is common enough that it’s worth your time
Log/Alert data
Using Splunk
Splunk is common enough that it’s worth your time
Log/Alert data
Some common managers/SIEMs
http://www.gartner.com/technology/media-products/reprints/nitrosecurity/article1/article1.html
Source: Gartner (May 2010)
Log/Alert data
Some common managers/SIEMs
http://www.gartner.com/technology/media-products/reprints/nitrosecurity/article1/article1.html
Source: Gartner (May 2010)
Log/Alert data
Arcsight event priority
Recalculated by ESM
Factors in:
Normalized Severity S [0—10]
Model of
Log/Alert data
Arcsight event priority
Recalculated by ESM
Factors in:
Normalized Severity S [0—10]
Model of
Log/Alert data
Arcsight event priority
Priority = S * MCR * H *
Log/Alert data
Arcsight event priority
Priority = S * MCR * H *
Log/Alert data
Using SIEMs effectively
Understand the complexity of the tools you are
Log/Alert data
Using SIEMs effectively
Understand the complexity of the tools you are
Deploying a monitoring solution
What you need to monitor a network will
Deploying a monitoring solution
What you need to monitor a network will
Extended topics
(if we have time)
Privacy/confidentiality laws
Attacking network monitoring devices
Evading network monitoring
Wireless
Extended topics
(if we have time)
Privacy/confidentiality laws
Attacking network monitoring devices
Evading network monitoring
Wireless
 Потоки, анімація, багатовіконність на Java
 Администрирование SQL server. Безопасность. (Часть 1)
 Шифрование информации
 Фоторедактирование как профессиональная деятельность
 Nathaniel SlidesCarnival
 Сети связи
 Язык SQL
 Программы с простейшей структурой. Среда программирования Turbo С / С++
 Welcome to CAD/CAM services
 Основы языка программирования C++
 Роль графического дизайнера в мультипликации
 Неуправляемое движение объектов
 Устройство компьютера. §31. История развития вычислительной техники. 10 класс
 Сортировка. Метод сортировки
 Мультимедиа - интегрированная информационная среда
 Нормальная форма
 Возможности текстового процессора Word
 Pascal Модуль GraphABC
 Памятка для обучающихся об информационной безопасности студентов
 Язык программирования C#
 Основы алгоритмизации и программирования. Функции. Простые функции
 Программирование на языке Паскаль
 Система сбора и анализа сведений о преподавателях
 Назначение и принцип работы BIOS
 Программная обработка данных
 Лайфхаки Word
 3 класс Обработка информации
 Word Pad программасымен практикалық сабақ