- The Market Forces of Supply and Demand

Содержание
- 2. The Market Forces of Supply and Demand Supply and demand are the two words that economists
- 3. Markets A market is a group of buyers and sellers of a particular good or service.
- 4. Markets Buyers determine demand. Sellers determine supply.
- 5. Market Type: A Competitive Market A competitive market is a market. . . with many buyers
- 6. Competition: Perfect and Otherwise Products are the same Numerous buyers and sellers so that each has
- 7. Competition: Perfect and Otherwise Monopoly One seller, and seller controls price Oligopoly Few sellers Not always
- 8. Competition: Perfect and Otherwise Monopolistic Competition Many sellers Slightly differentiated products Each seller may set price
- 9. Demand Quantity demanded is the amount of a good that buyers are willing and able to
- 10. Law of Demand The law of demand states that there is an inverse relationship between price
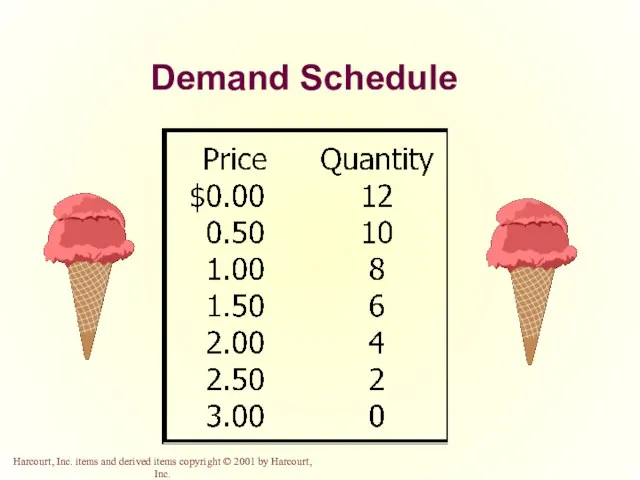
- 11. Demand Schedule The demand schedule is a table that shows the relationship between the price of
- 12. Demand Schedule
- 13. Determinants of Demand Market price Consumer income Prices of related goods Tastes Expectations
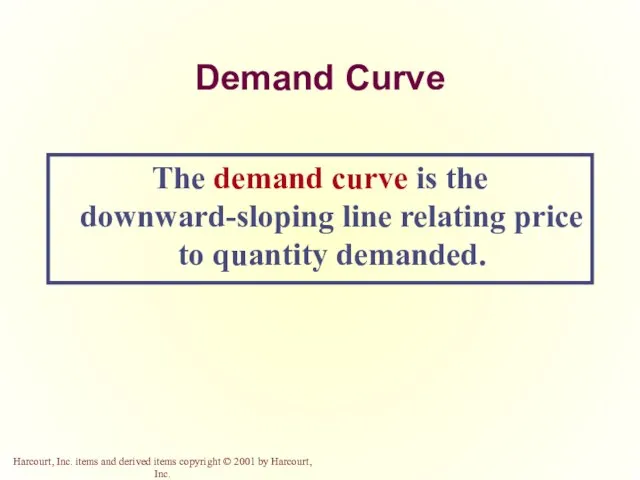
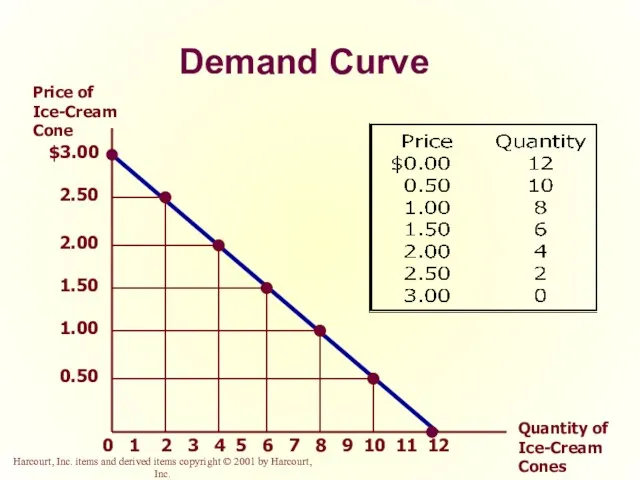
- 14. Demand Curve The demand curve is the downward-sloping line relating price to quantity demanded.
- 15. Demand Curve $3.00 2.50 2.00 1.50 1.00 0.50 2 1 3 4 5 6 7 8
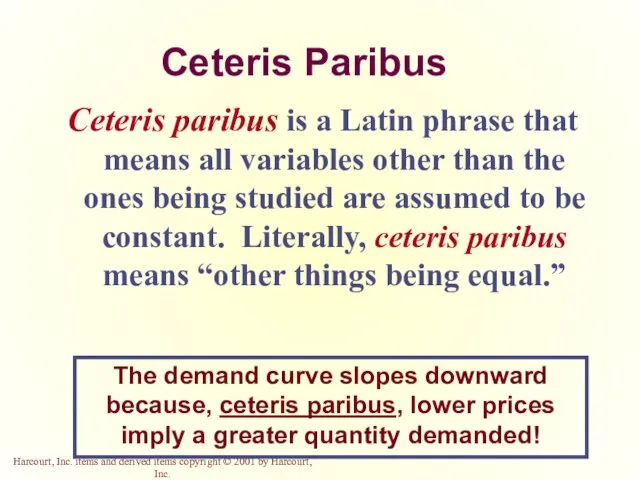
- 16. Ceteris Paribus Ceteris paribus is a Latin phrase that means all variables other than the ones
- 17. Market Demand Market demand refers to the sum of all individual demands for a particular good
- 18. Determinants of Demand Market price Consumer income Prices of related goods Tastes Expectations
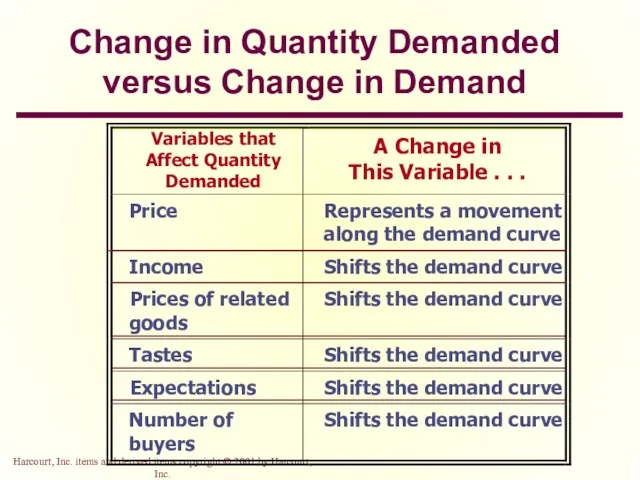
- 19. Change in Quantity Demanded versus Change in Demand Change in Quantity Demanded Movement along the demand
- 20. Changes in Quantity Demanded 0 D1 Price of Cigarettes per Pack Number of Cigarettes Smoked per
- 21. Change in Quantity Demanded versus Change in Demand Change in Demand A shift in the demand
- 22. Changes in Demand 0 D1 Price of Ice-Cream Cone Quantity of Ice-Cream Cones D3 D2 Increase
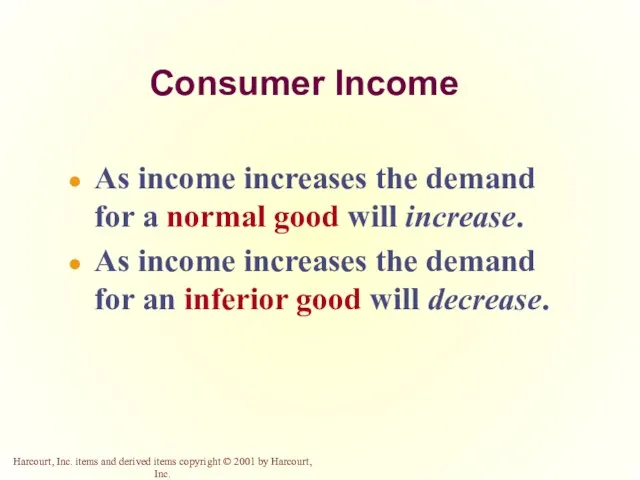
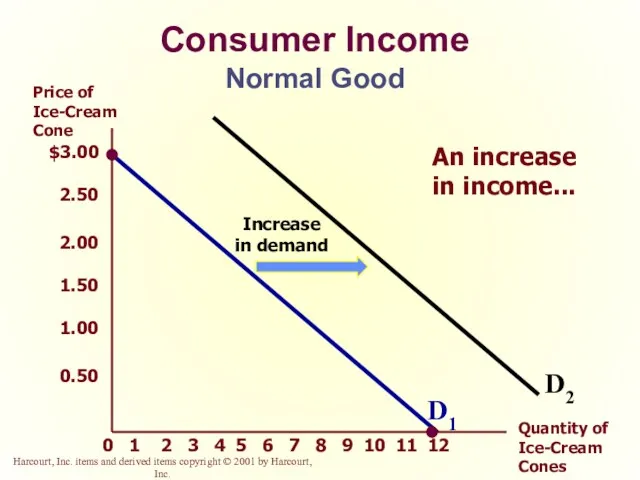
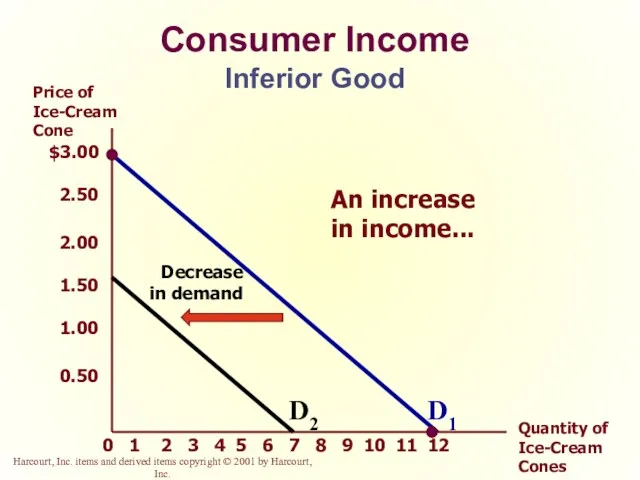
- 23. Consumer Income As income increases the demand for a normal good will increase. As income increases
- 24. Consumer Income Normal Good $3.00 2.50 2.00 1.50 1.00 0.50 2 1 3 4 5 6
- 25. Consumer Income Inferior Good $3.00 2.50 2.00 1.50 1.00 0.50 2 1 3 4 5 6
- 26. Prices of Related Goods Substitutes & Complements When a fall in the price of one good
- 27. Change in Quantity Demanded versus Change in Demand
- 28. Supply Quantity supplied is the amount of a good that sellers are willing and able to
- 29. Law of Supply The law of supply states that there is a direct (positive) relationship between
- 30. Determinants of Supply Market price Input prices Technology Expectations Number of producers
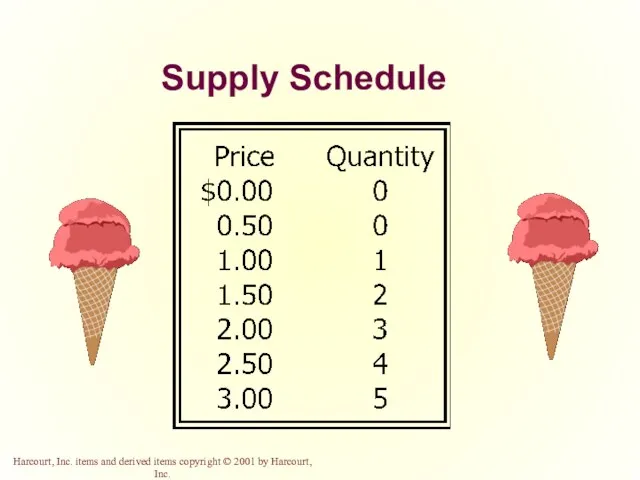
- 31. Supply Schedule The supply schedule is a table that shows the relationship between the price of
- 32. Supply Schedule
- 33. Supply Curve The supply curve is the upward-sloping line relating price to quantity supplied.
- 34. Supply Curve $3.00 2.50 2.00 1.50 1.00 0.50 2 1 3 4 5 6 7 8
- 35. Market Supply Market supply refers to the sum of all individual supplies for all sellers of
- 36. Determinants of Supply Market price Input prices Technology Expectations Number of producers
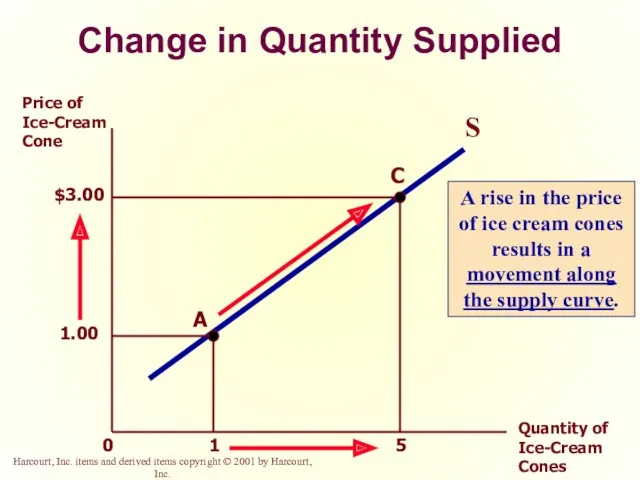
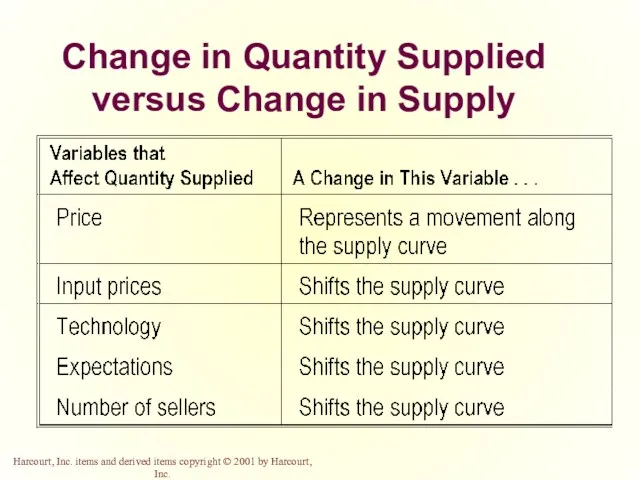
- 37. Change in Quantity Supplied versus Change in Supply Change in Quantity Supplied Movement along the supply
- 38. Change in Quantity Supplied 1 5 Price of Ice-Cream Cone Quantity of Ice-Cream Cones 0 S
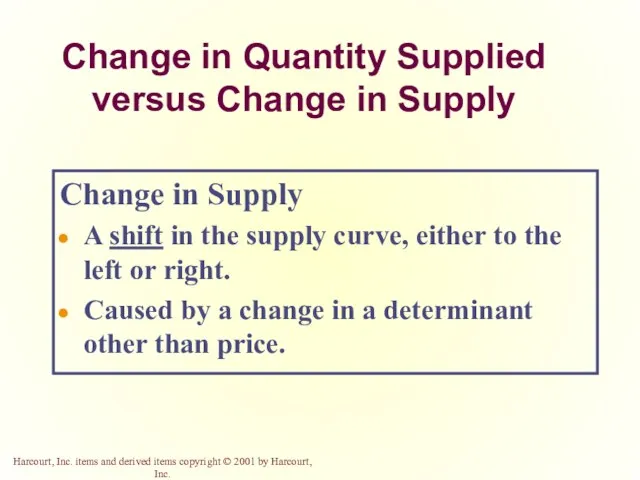
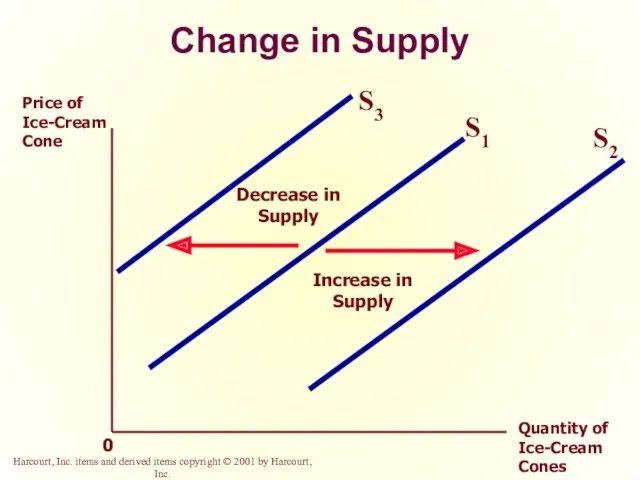
- 39. Change in Quantity Supplied versus Change in Supply Change in Supply A shift in the supply
- 40. Change in Supply Price of Ice-Cream Cone Quantity of Ice-Cream Cones 0 S1
- 41. Change in Quantity Supplied versus Change in Supply
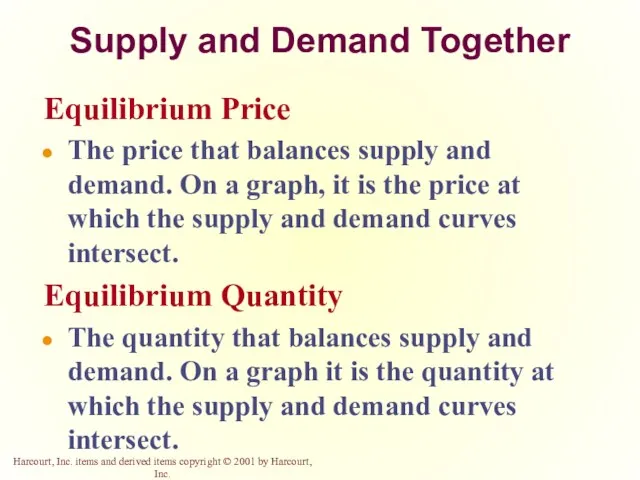
- 42. Supply and Demand Together Equilibrium Price The price that balances supply and demand. On a graph,
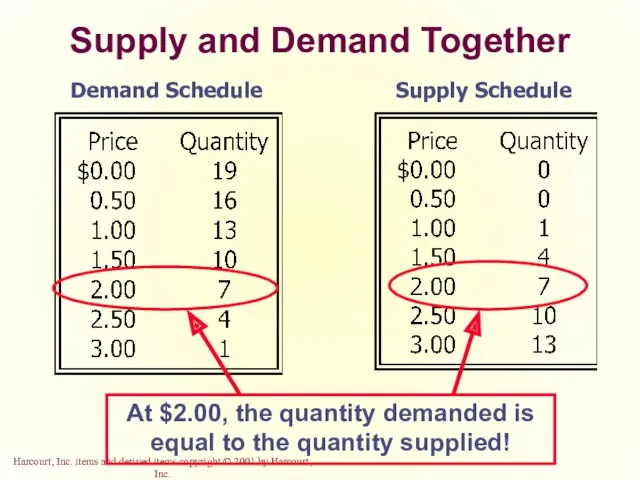
- 43. Supply and Demand Together Demand Schedule Supply Schedule At $2.00, the quantity demanded is equal to
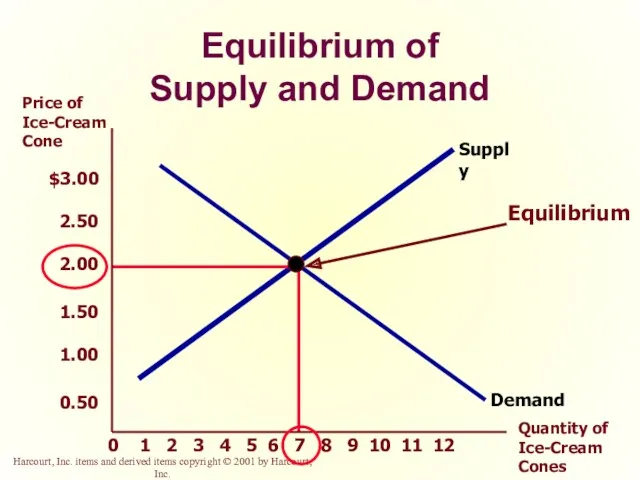
- 44. Price of Ice-Cream Cone Quantity of Ice-Cream Cones Equilibrium of Supply and Demand 2 1 3
- 45. Price of Ice-Cream Cone Quantity of Ice-Cream Cones 2 1 3 4 5 6 7 8
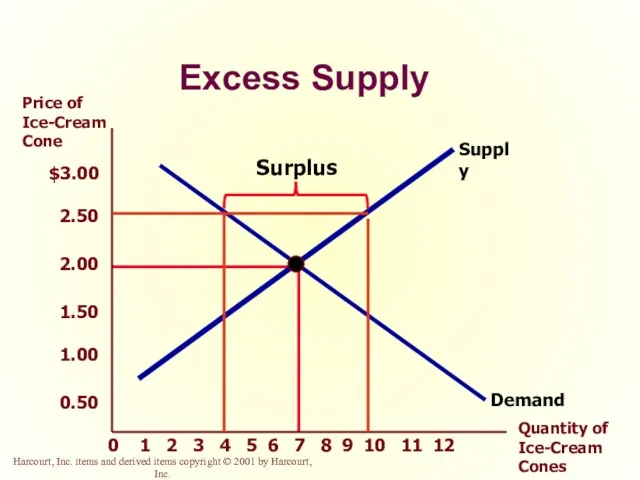
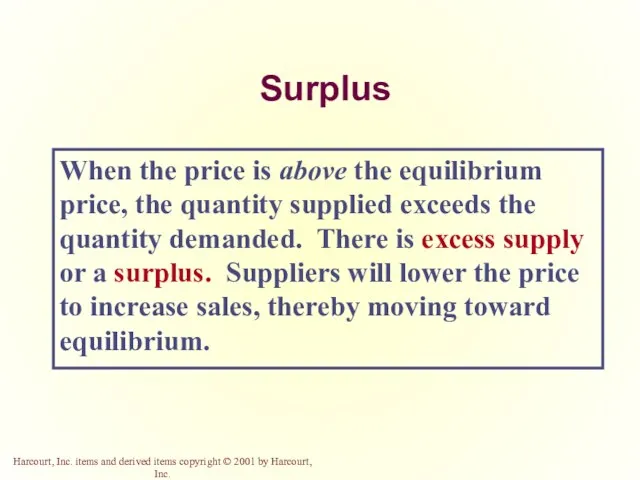
- 46. Surplus When the price is above the equilibrium price, the quantity supplied exceeds the quantity demanded.
- 47. Excess Demand Quantity of Ice-Cream Cones Price of Ice-Cream Cone $2.00 0 1 2 3 4
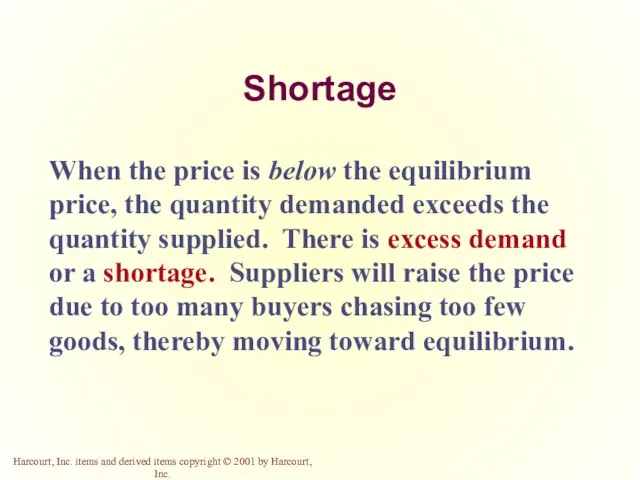
- 48. Shortage When the price is below the equilibrium price, the quantity demanded exceeds the quantity supplied.
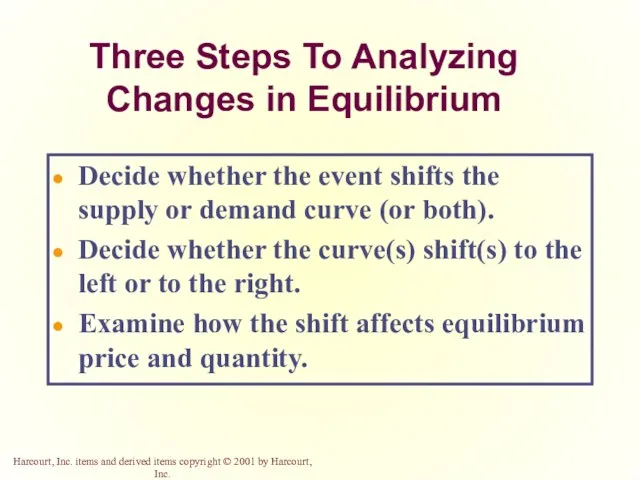
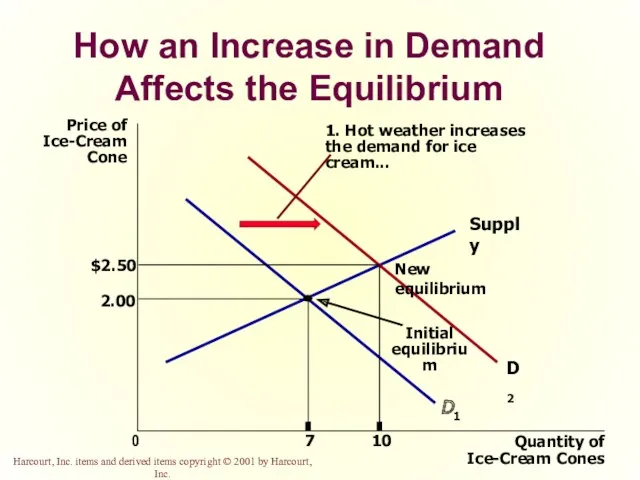
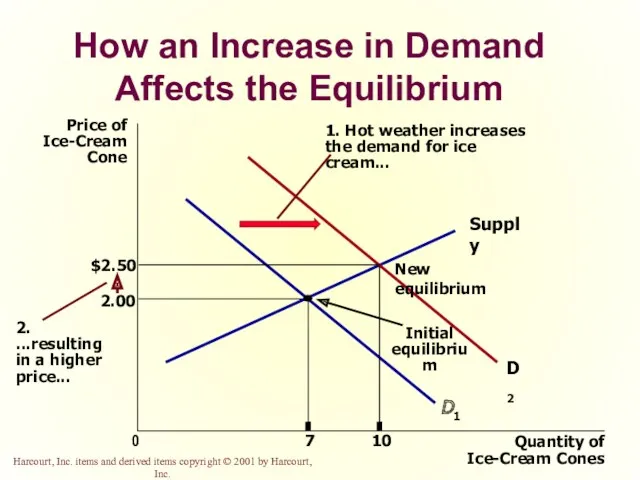
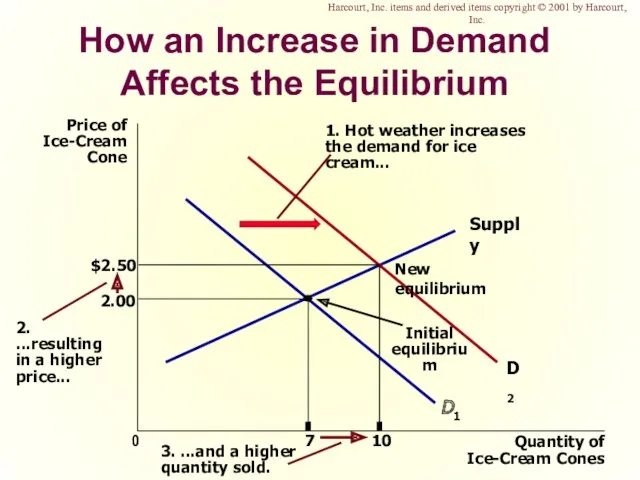
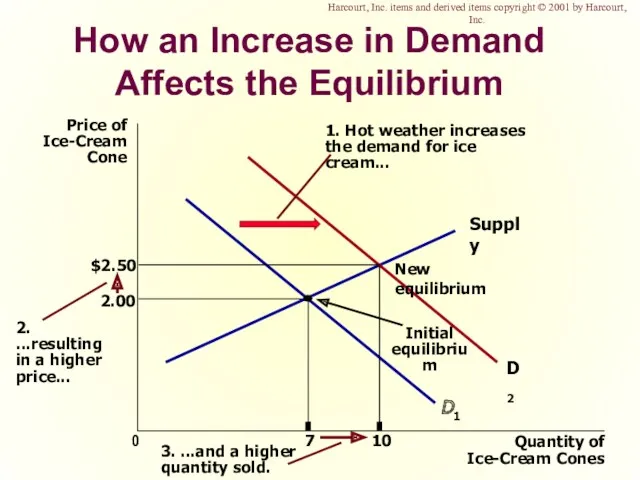
- 49. Three Steps To Analyzing Changes in Equilibrium Decide whether the event shifts the supply or demand
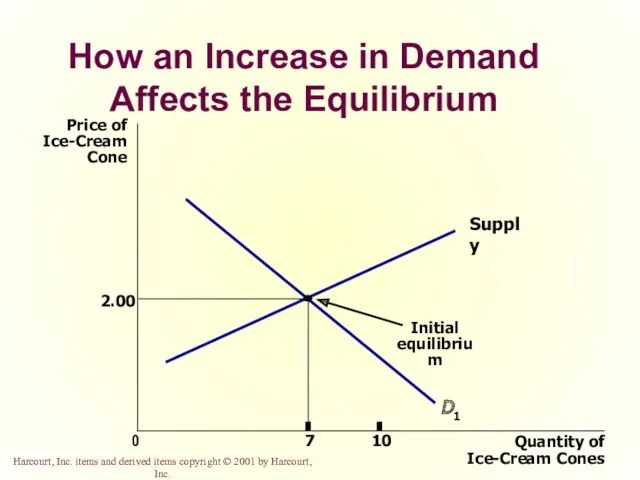
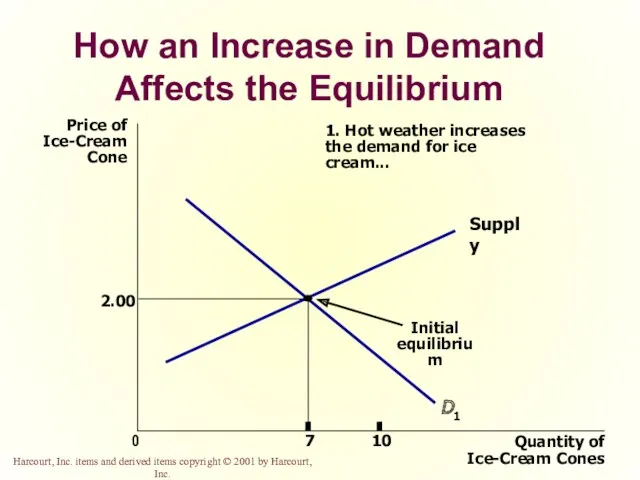
- 50. How an Increase in Demand Affects the Equilibrium Price of Ice-Cream Cone 2.00 0 7 Quantity
- 51. Shifts in Curves versus Movements along Curves A shift in the supply curve is called a
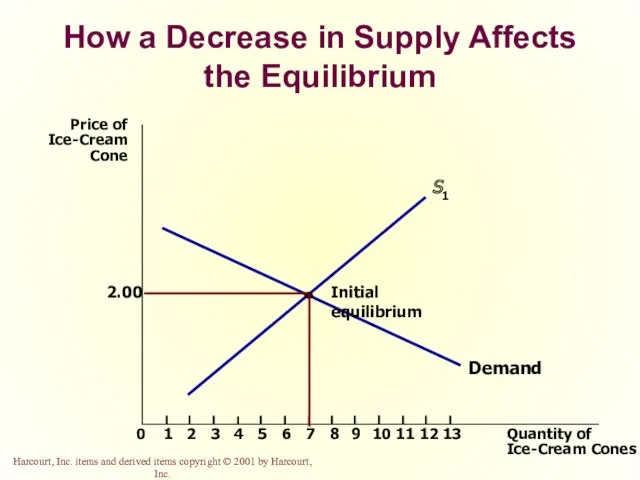
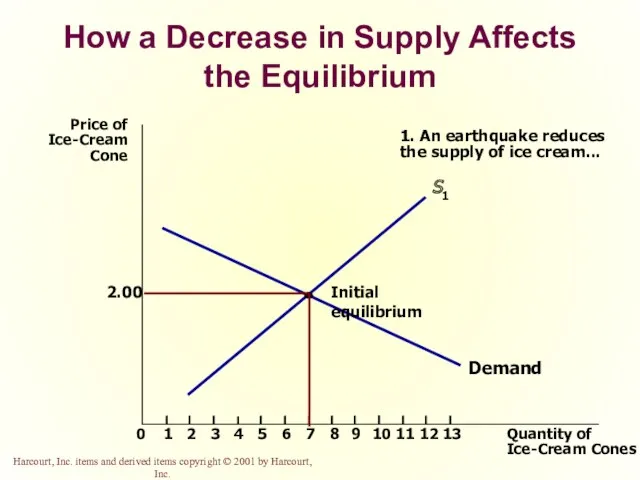
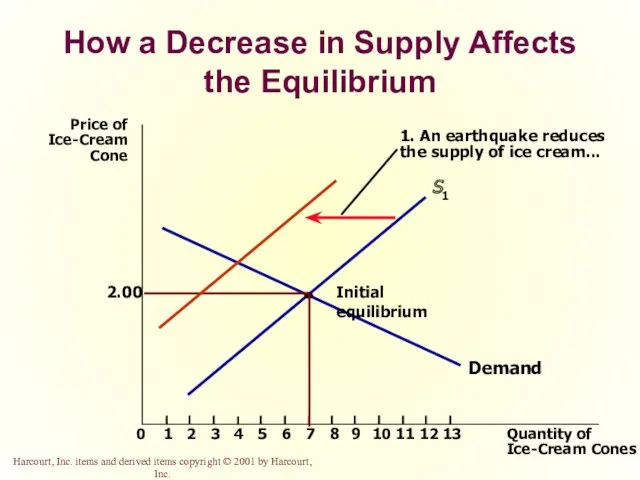
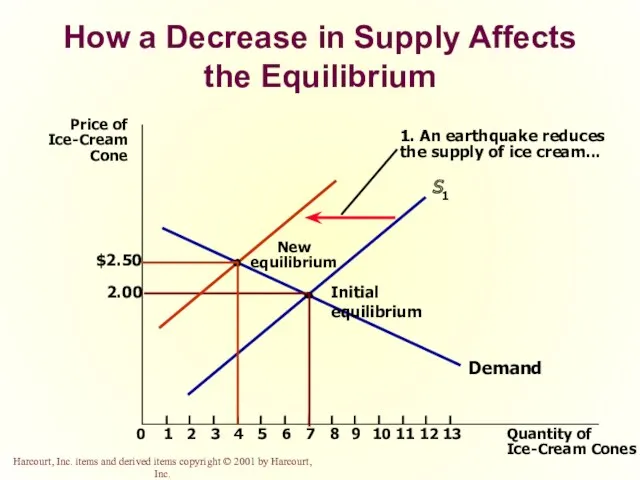
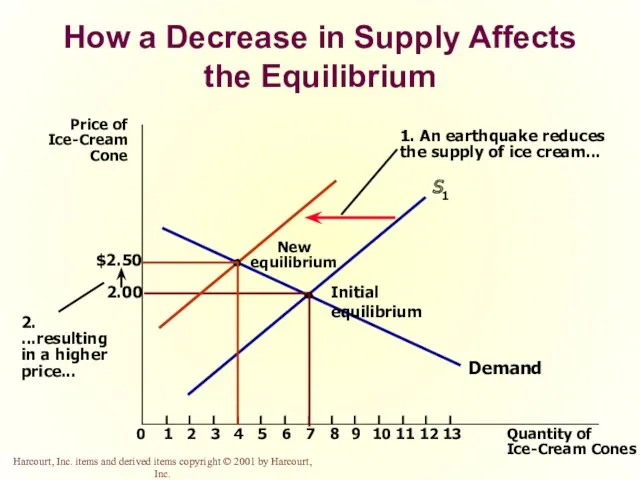
- 52. How a Decrease in Supply Affects the Equilibrium Price of Ice-Cream Cone 2.00 0 1 2
- 53. What Happens to Price and Quantity When Supply or Demand Shifts?
- 54. Summary Economists use the model of supply and demand to analyze competitive markets. The demand curve
- 55. Summary According to the law of demand, as the price of a good rises, the quantity
- 56. Summary The supply curve shows how the quantity of a good supplied depends upon the price.
- 57. Summary In addition to price, other determinants of quantity supplied include input prices, technology, and expectations.
- 58. Summary Supply and demand together determine the prices of the economy’s goods and services. In market
- 60. How an Increase in Demand Affects the Equilibrium
- 61. How an Increase in Demand Affects the Equilibrium
- 62. How an Increase in Demand Affects the Equilibrium
- 63. How an Increase in Demand Affects the Equilibrium
- 64. How an Increase in Demand Affects the Equilibrium Harcourt, Inc. items and derived items copyright ©
- 65. How an Increase in Demand Affects the Equilibrium Harcourt, Inc. items and derived items copyright ©
- 66. How a Decrease in Supply Affects the Equilibrium
- 67. How a Decrease in Supply Affects the Equilibrium
- 68. How a Decrease in Supply Affects the Equilibrium
- 69. How a Decrease in Supply Affects the Equilibrium
- 70. How a Decrease in Supply Affects the Equilibrium
- 72. Скачать презентацию
The Market Forces of
Supply and Demand
Supply and demand are the
The Market Forces of
Supply and Demand
Supply and demand are the
Markets
A market is a group of buyers and sellers of
Markets
A market is a group of buyers and sellers of
Markets
Buyers determine demand.
Sellers determine supply.
Markets
Buyers determine demand.
Sellers determine supply.
Market Type:
A Competitive Market
A competitive market is a market. .
Market Type:
A Competitive Market
A competitive market is a market. .
Competition:
Perfect and Otherwise
Products are the same
Numerous buyers and sellers so
Competition:
Perfect and Otherwise
Products are the same
Numerous buyers and sellers so
Competition:
Perfect and Otherwise
Monopoly
One seller, and seller controls price
Oligopoly
Few sellers
Not always
Competition:
Perfect and Otherwise
Monopoly
One seller, and seller controls price
Oligopoly
Few sellers
Not always
Competition:
Perfect and Otherwise
Monopolistic Competition
Many sellers
Slightly differentiated products
Each seller may set
Competition:
Perfect and Otherwise
Monopolistic Competition
Many sellers
Slightly differentiated products
Each seller may set
Demand
Quantity demanded
is the amount
of a good that buyers are
Demand
Quantity demanded is the amount of a good that buyers are
Law of Demand
The law of demand states that there is an
Law of Demand
The law of demand states that there is an
Demand Schedule
The demand schedule is a table
that shows the relationship
Demand Schedule
The demand schedule is a table that shows the relationship
Demand Schedule
Demand Schedule
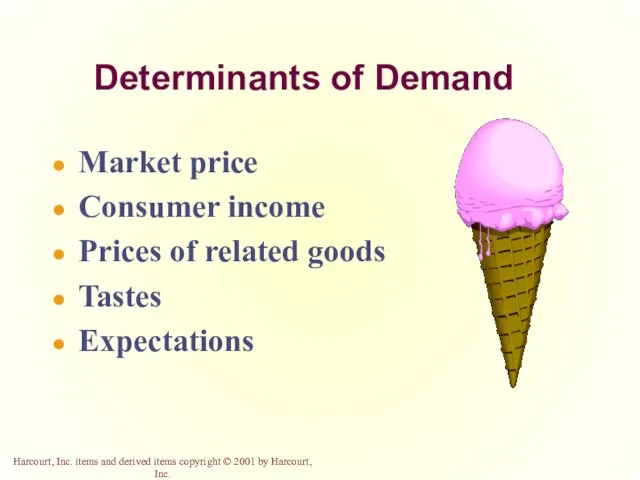
Determinants of Demand
Market price
Consumer income
Prices of related goods
Tastes
Expectations
Determinants of Demand
Market price
Consumer income
Prices of related goods
Tastes
Expectations
Demand Curve
The demand curve is the downward-sloping line relating price to
Demand Curve
The demand curve is the downward-sloping line relating price to
Demand Curve
$3.00
2.50
2.00
1.50
1.00
0.50
2
1
3
4
5
6
7
8
9
10
12
11
Price of Ice-Cream Cone
Quantity of Ice-Cream Cones
0
Demand Curve
$3.00
2.50
2.00
1.50
1.00
0.50
2
1
3
4
5
6
7
8
9
10
12
11
Price of Ice-Cream Cone
Quantity of Ice-Cream Cones
0
Ceteris Paribus
Ceteris paribus is a Latin phrase that means all variables
Ceteris Paribus
Ceteris paribus is a Latin phrase that means all variables
Market Demand
Market demand refers to the sum of all individual demands
Market Demand
Market demand refers to the sum of all individual demands
Determinants of Demand
Market price
Consumer income
Prices of related goods
Tastes
Expectations
Determinants of Demand
Market price
Consumer income
Prices of related goods
Tastes
Expectations
Change in Quantity Demanded versus Change in Demand
Change in Quantity Demanded
Movement
Change in Quantity Demanded versus Change in Demand
Change in Quantity Demanded
Movement
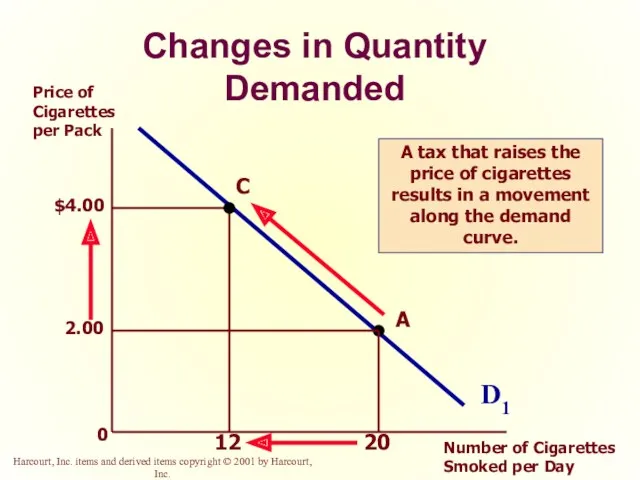
Changes in Quantity Demanded
0
D1
Price of Cigarettes per Pack
Number of Cigarettes Smoked
Changes in Quantity Demanded
0
D1
Price of Cigarettes per Pack
Number of Cigarettes Smoked
Change in Quantity Demanded versus Change in Demand
Change in Demand
A shift
Change in Quantity Demanded versus Change in Demand
Change in Demand
A shift
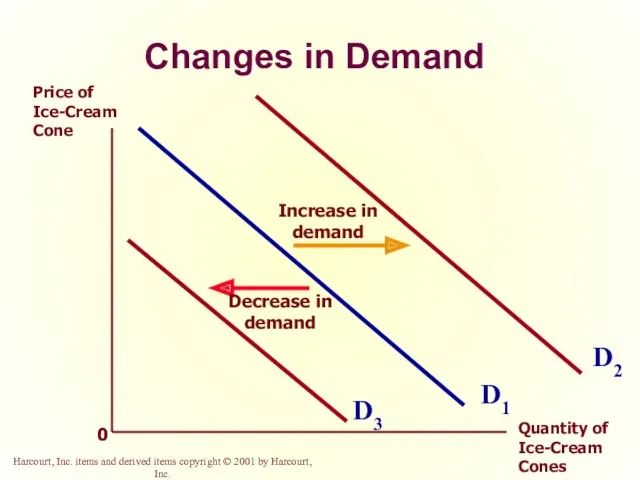
Changes in Demand
0
D1
Price of Ice-Cream Cone
Quantity of Ice-Cream Cones
D3
D2
Increase in demand
Decrease
Changes in Demand
0
D1
Price of Ice-Cream Cone
Quantity of Ice-Cream Cones
D3
D2
Increase in demand
Decrease
Consumer Income
As income increases the demand for a normal good will
Consumer Income
As income increases the demand for a normal good will
Consumer Income
Normal Good
$3.00
2.50
2.00
1.50
1.00
0.50
2
1
3
4
5
6
7
8
9
10
12
11
Price of Ice-Cream Cone
Quantity of Ice-Cream Cones
0
Increase
in demand
An increase
Consumer Income
Normal Good
$3.00
2.50
2.00
1.50
1.00
0.50
2
1
3
4
5
6
7
8
9
10
12
11
Price of Ice-Cream Cone
Quantity of Ice-Cream Cones
0
Increase
in demand
An increase
Consumer Income
Inferior Good
$3.00
2.50
2.00
1.50
1.00
0.50
2
1
3
4
5
6
7
8
9
10
12
11
Price of Ice-Cream Cone
Quantity of Ice-Cream Cones
0
Decrease
in demand
An increase
Consumer Income
Inferior Good
$3.00
2.50
2.00
1.50
1.00
0.50
2
1
3
4
5
6
7
8
9
10
12
11
Price of Ice-Cream Cone
Quantity of Ice-Cream Cones
0
Decrease
in demand
An increase
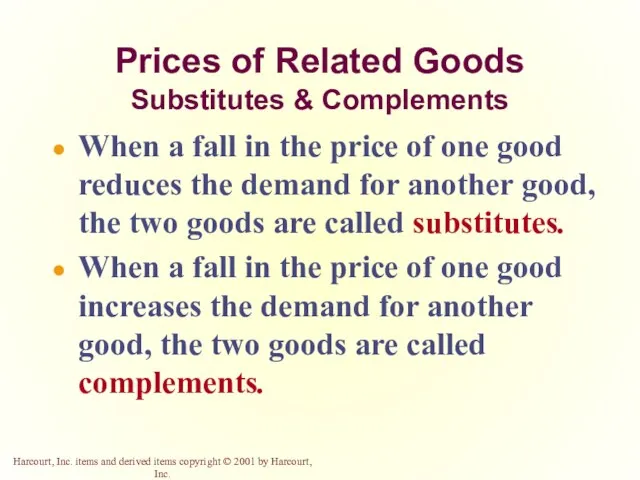
Prices of Related Goods
Substitutes & Complements
When a fall in the price
Prices of Related Goods
Substitutes & Complements
When a fall in the price
Change in Quantity Demanded versus Change in Demand
Change in Quantity Demanded versus Change in Demand
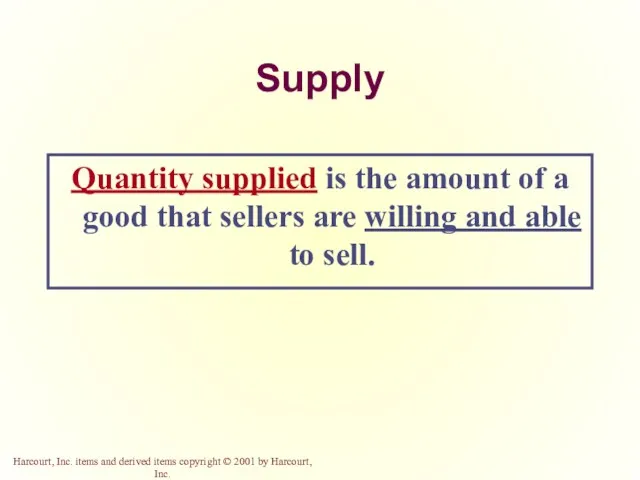
Supply
Quantity supplied is the amount of a good that sellers are
Supply
Quantity supplied is the amount of a good that sellers are
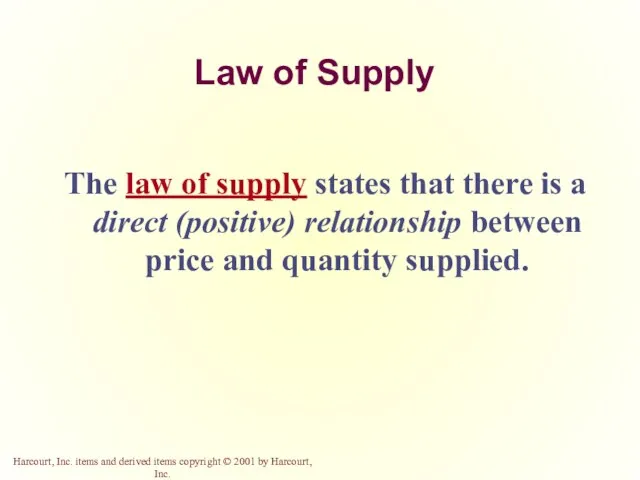
Law of Supply
The law of supply states that there is a
Law of Supply
The law of supply states that there is a
Determinants of Supply
Market price
Input prices
Technology
Expectations
Number of producers
Determinants of Supply
Market price
Input prices
Technology
Expectations
Number of producers
Supply Schedule
The supply schedule is a table that shows the relationship
Supply Schedule
The supply schedule is a table that shows the relationship
Supply Schedule
Supply Schedule
Supply Curve
The supply curve is the upward-sloping line relating price to
Supply Curve
The supply curve is the upward-sloping line relating price to
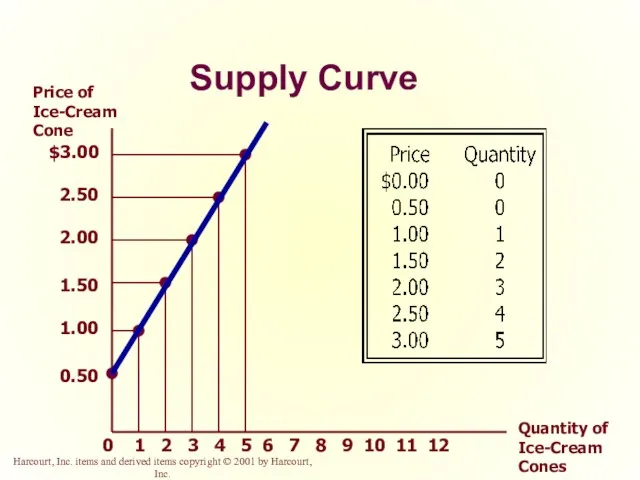
Supply Curve
$3.00
2.50
2.00
1.50
1.00
0.50
2
1
3
4
5
6
7
8
9
10
12
11
Price of Ice-Cream Cone
Quantity of Ice-Cream Cones
0
Supply Curve
$3.00
2.50
2.00
1.50
1.00
0.50
2
1
3
4
5
6
7
8
9
10
12
11
Price of Ice-Cream Cone
Quantity of Ice-Cream Cones
0
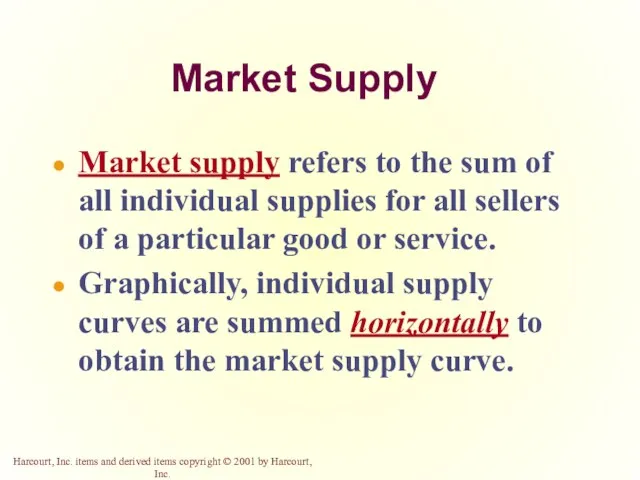
Market Supply
Market supply refers to the sum of all individual supplies
Market Supply
Market supply refers to the sum of all individual supplies
Determinants of Supply
Market price
Input prices
Technology
Expectations
Number of producers
Determinants of Supply
Market price
Input prices
Technology
Expectations
Number of producers
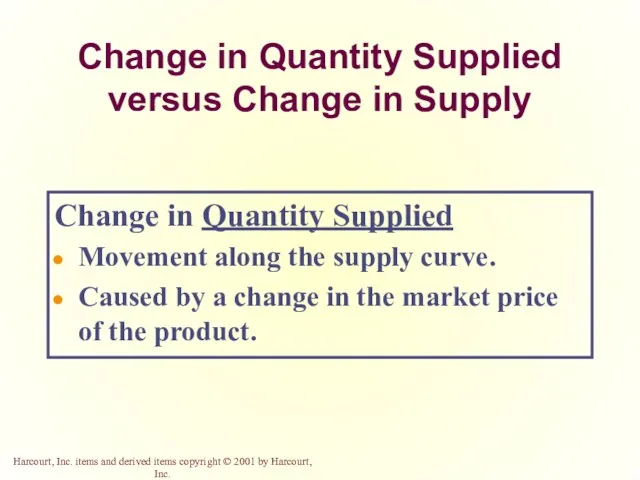
Change in Quantity Supplied versus Change in Supply
Change in Quantity Supplied
Movement
Change in Quantity Supplied versus Change in Supply
Change in Quantity Supplied
Movement
Change in Quantity Supplied
1
5
Price of Ice-Cream Cone
Quantity of Ice-Cream Cones
0
S
Change in Quantity Supplied
1
5
Price of Ice-Cream Cone
Quantity of Ice-Cream Cones
0
S
Change in Quantity Supplied versus Change in Supply
Change in Supply
A shift
Change in Quantity Supplied versus Change in Supply
Change in Supply
A shift
Change in Supply
Price of Ice-Cream Cone
Quantity of Ice-Cream Cones
0
S1
Change in Supply
Price of Ice-Cream Cone
Quantity of Ice-Cream Cones
0
S1
Change in Quantity Supplied versus Change in Supply
Change in Quantity Supplied versus Change in Supply
Supply and Demand Together
Equilibrium Price
The price that balances supply and demand.
Supply and Demand Together
Equilibrium Price
The price that balances supply and demand.
Supply and Demand Together
Demand Schedule
Supply Schedule
At $2.00, the quantity demanded is
Supply and Demand Together
Demand Schedule
Supply Schedule
At $2.00, the quantity demanded is
Price of Ice-Cream Cone
Quantity of Ice-Cream Cones
Equilibrium of
Supply and Demand
2
1
3
4
5
6
7
8
9
10
12
11
0
$3.00
2.50
2.00
1.50
1.00
0.50
Price of Ice-Cream Cone
Quantity of Ice-Cream Cones
Equilibrium of
Supply and Demand
2
1
3
4
5
6
7
8
9
10
12
11
0
$3.00
2.50
2.00
1.50
1.00
0.50
Price of Ice-Cream Cone
Quantity of Ice-Cream Cones
2
1
3
4
5
6
7
8
9
10
12
11
0
$3.00
2.50
2.00
1.50
1.00
0.50
Supply
Demand
Surplus
Excess Supply
Price of Ice-Cream Cone
Quantity of Ice-Cream Cones
2
1
3
4
5
6
7
8
9
10
12
11
0
$3.00
2.50
2.00
1.50
1.00
0.50
Supply
Demand
Surplus
Excess Supply
Surplus
When the price is above the equilibrium price, the quantity supplied
Surplus
When the price is above the equilibrium price, the quantity supplied
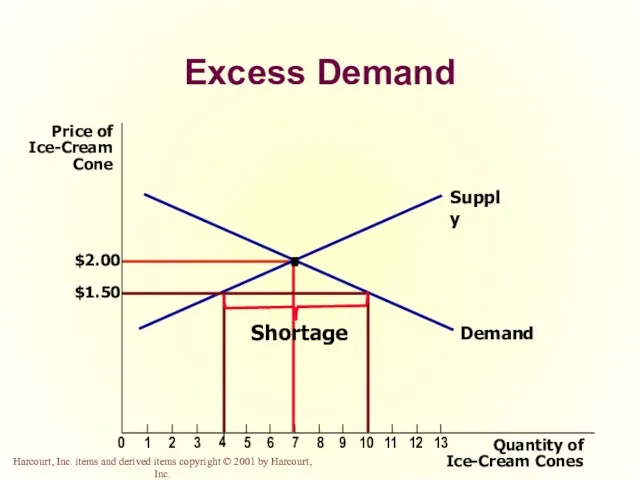
Excess Demand
Quantity of
Ice-Cream Cones
Price of
Ice-Cream
Cone
$2.00
0
1
2
3
4
5
6
7
8
9
10
11
12
13
Supply
Demand
$1.50
Shortage
Excess Demand
Quantity of
Ice-Cream Cones
Price of
Ice-Cream
Cone
$2.00
0
1
2
3
4
5
6
7
8
9
10
11
12
13
Supply
Demand
$1.50
Shortage
Shortage
When the price is below the equilibrium price, the quantity demanded
Shortage
When the price is below the equilibrium price, the quantity demanded
Three Steps To Analyzing Changes in Equilibrium
Decide whether the event shifts
Three Steps To Analyzing Changes in Equilibrium
Decide whether the event shifts
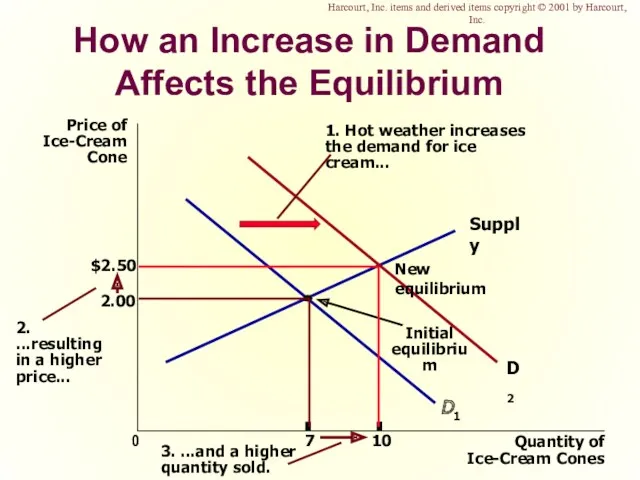
How an Increase in Demand Affects the Equilibrium
Price of
Ice-Cream
Cone
2.00
0
7
Quantity of
Ice-Cream Cones
Supply
Initial
equilibrium
D1
1.
How an Increase in Demand Affects the Equilibrium
Price of
Ice-Cream
Cone
2.00
0
7
Quantity of
Ice-Cream Cones
Supply
Initial
equilibrium
D1
1.
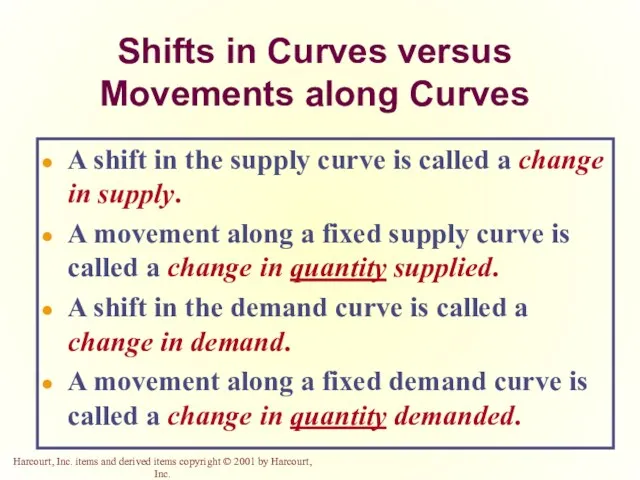
Shifts in Curves versus Movements along Curves
A shift in the supply
Shifts in Curves versus Movements along Curves
A shift in the supply
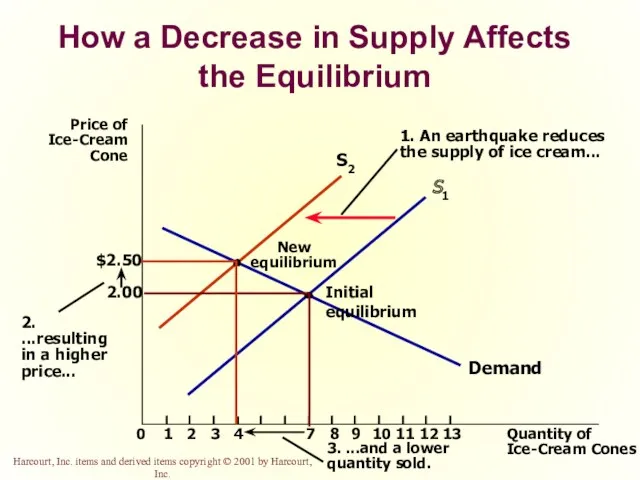
How a Decrease in Supply Affects the Equilibrium
Price of
Ice-Cream
Cone
2.00
0
1
2
3
4
7
8
9
11
12
Quantity of
Ice-Cream Cones
13
Demand
Initial
How a Decrease in Supply Affects the Equilibrium
Price of
Ice-Cream
Cone
2.00
0
1
2
3
4
7
8
9
11
12
Quantity of
Ice-Cream Cones
13
Demand
Initial
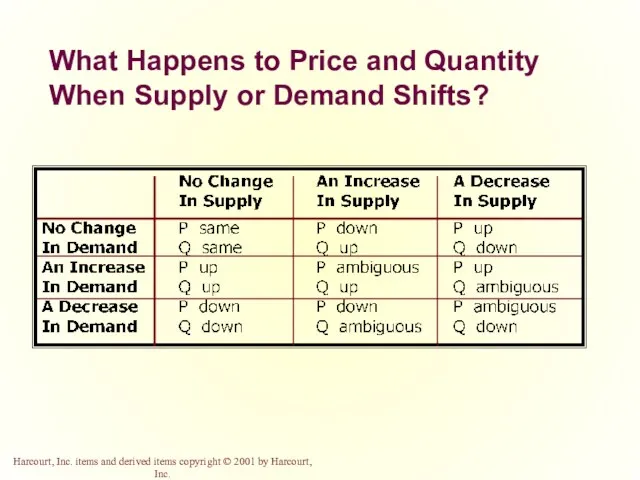
What Happens to Price and Quantity When Supply or Demand Shifts?
What Happens to Price and Quantity When Supply or Demand Shifts?
Summary
Economists use the model of supply and demand to analyze competitive
Summary
Economists use the model of supply and demand to analyze competitive
Summary
According to the law of demand, as the price of a
Summary
According to the law of demand, as the price of a
Summary
The supply curve shows how the quantity of a good supplied
Summary
The supply curve shows how the quantity of a good supplied
Summary
In addition to price, other determinants of quantity supplied include input
Summary
In addition to price, other determinants of quantity supplied include input
Summary
Supply and demand together determine the prices of the economy’s goods
Summary
Supply and demand together determine the prices of the economy’s goods
How an Increase in Demand Affects the Equilibrium
How an Increase in Demand Affects the Equilibrium
How an Increase in Demand Affects the Equilibrium
How an Increase in Demand Affects the Equilibrium
How an Increase in Demand Affects the Equilibrium
How an Increase in Demand Affects the Equilibrium
How an Increase in Demand Affects the Equilibrium
How an Increase in Demand Affects the Equilibrium
How an Increase in Demand Affects the Equilibrium
Harcourt, Inc. items and
How an Increase in Demand Affects the Equilibrium
Harcourt, Inc. items and
How an Increase in Demand Affects the Equilibrium
Harcourt, Inc. items and
How an Increase in Demand Affects the Equilibrium
Harcourt, Inc. items and
How a Decrease in Supply Affects the Equilibrium
How a Decrease in Supply Affects the Equilibrium
How a Decrease in Supply Affects the Equilibrium
How a Decrease in Supply Affects the Equilibrium
How a Decrease in Supply Affects the Equilibrium
How a Decrease in Supply Affects the Equilibrium
How a Decrease in Supply Affects the Equilibrium
How a Decrease in Supply Affects the Equilibrium
How a Decrease in Supply Affects the Equilibrium
How a Decrease in Supply Affects the Equilibrium
 Электронный обмен данными (EDI)
 Товар. Категории представлений товаров
 Тренинг группы А. Продукты компании HERBALIFE
 Зарождение идеи Zara
 Текст рекламного объявления
 Школа проектов - дети в науке. Поможем вашему ребенку стать успешным. Запуск – январь 2019 г
 Супермаркет Виктория. Информация по бонусной карте сети Моя Виктория
 Личный бренд – маркетинг предпринимателя в социальных сетях
 Матрицы принятия решений. Матрица БКГ (BCG Matrix)
 Міжнародний досвід розвитку систем управління якістю. Вітчизняні системи управління якістю. (Тема 2)
 Омега-3. Онлайн мастер-класс
 Beach Words
 Обзор конкурентов. Curiosity-mobile
 Сувенирная продукция, как маркетинговый инструмент рекламной кампании
 Маркетинговые исследования и ситуационный анализ
 Комплексне обслуговування нерухомості. Геотаргетинг всі міста +обл. центри
 Прайс-лист Рыболовные товары
 Обучающая презентация по продуктам Эвалар
 Управление интегрированными коммуникациями
 Конкурентные преимущества иван-чая
 Качество изделий: основные понятия
 Кондитерская промышленность в России
 Высококачественные, современные центрифуги. Компания Центромаш (3)
 Радио Европа плюс Могилёв
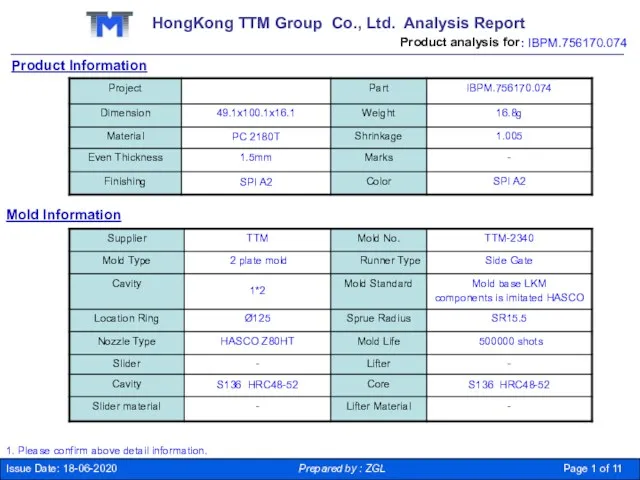 HongKong TTM Group Co
 Стажировки в зарубежных ИТ компаниях
 Zerts. Маркетинг план
 Большая конференция по маркетинговой и продуктовой аналитике