- The pharmaceutical industry

Содержание
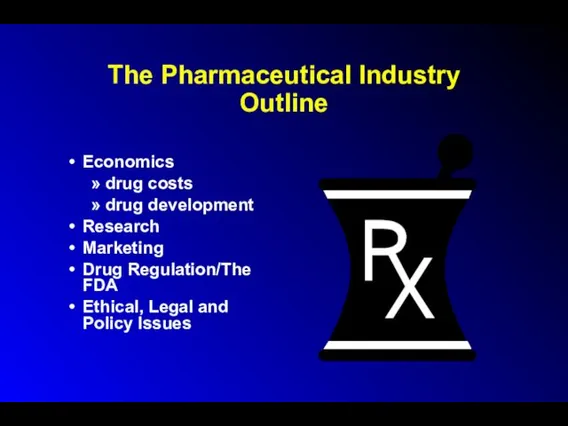
- 2. The Pharmaceutical Industry Outline Economics drug costs drug development Research Marketing Drug Regulation/The FDA Ethical, Legal
- 3. Home Care 80-90% of illnesses cared for outside formal health care system Family (women), friends, media
- 4. Self Medication Inappropriate self (and child) medication - diarrhea - the common cold - other viral
- 5. Self Medication Enemas for diarrhea and fever Mix benadryl and alcohol for insomnia Educational brochures have
- 6. Inappropriate Self-medication: The Common Cold Greater than 800 OTC medications available Not beneficial in children under
- 7. Inappropriate Self Medication: Diarrhea Greater than 100 OTC medications available 15% of children less than 3
- 8. Inappropriate OTC Medication Use in Children Ineffective Potential for ADEs and ODs Profile of users’ parents:
- 9. Prescription Drugs 10,000 FDA-approved drugs 70% of all office visits lead to prescriptions 1.5 - 2.0
- 10. Prescription Drugs >10% of U.S. medical costs account for 44% of increase in health care costs
- 11. U.S. Drug Use 81% have used at least one drug in the preceding week HTN and
- 12. Prescription Drugs Over $300/person/year, or $22,500 over a 75-year lifetime Increased life expectancy from 55-75 from
- 13. Economics of the Pharmaceutical Industry Worldwide sales > $145 billion/year US = Largest markets (40 %
- 14. Economics 18.6% profit margin in 1999 16.4% in 2000 ($24 billion) -Largest of any industry -4
- 15. Economics of the Pharmaceutical Industry Greater than 5000 companies worldwide -less than 100 companies account for
- 16. Mergers and Acquisitions Drug company mergers - Pfizer-Warner-Lambert, Upjohn-Pharmacia, Glaxo-Wellcome-SmithKliine Beecham, etc. Pfizer acquired Pharmacia in
- 17. Mergers and Acquisitions Acquisition of generic divisions and PBM’s -Merck-Medco -Glaxo-Wellcome-Smith-Kline Beecham-DPS -Lilly - PCS Health
- 18. Economics Sales revenues tripled over last decade Prices increased 150% (verses 50% CPI Spending up 17%
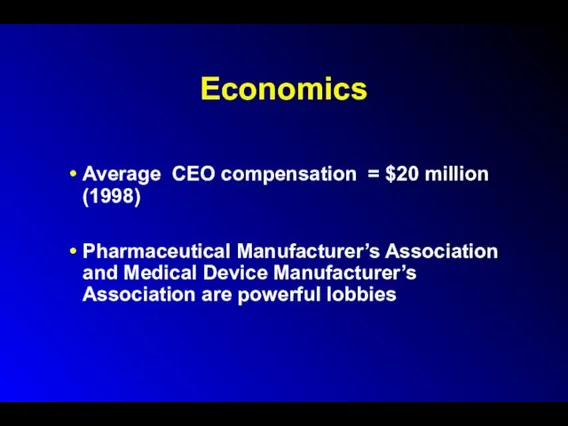
- 19. Economics Average CEO compensation = $20 million (1998) Pharmaceutical Manufacturer’s Association and Medical Device Manufacturer’s Association
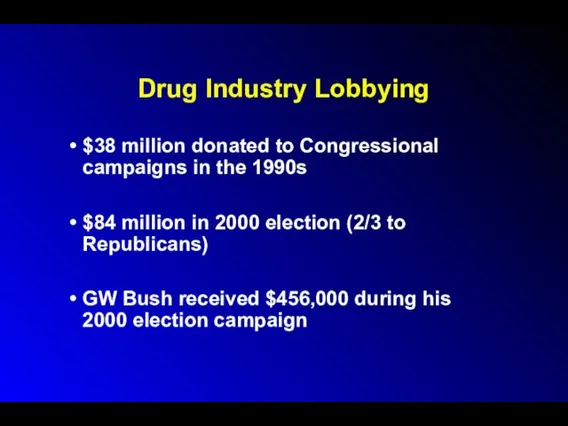
- 20. Drug Industry Lobbying $38 million donated to Congressional campaigns in the 1990s $84 million in 2000
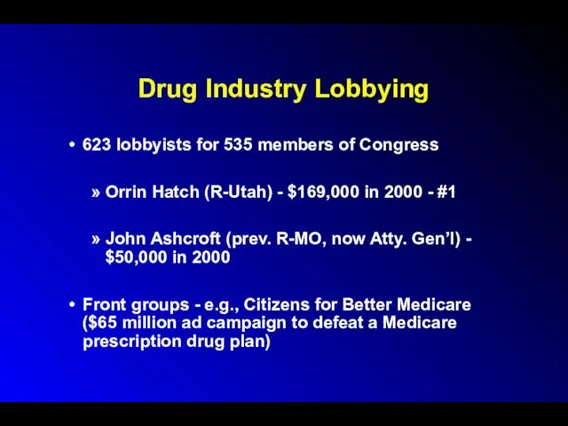
- 21. Drug Industry Lobbying 623 lobbyists for 535 members of Congress Orrin Hatch (R-Utah) - $169,000 in
- 22. Drug Costs U.S. highest in the world 54% > Europe 34% to 80% > Canada (drug
- 23. Drug Costs U.S. only large industrialized country not regulating drug prices AND the only major economic
- 24. Drug Pricing Policies and Regulations Product Pricing Control France, Italy, Spain Reference Pricing Germany, Netherlands Profit
- 25. Decreasing Costs Formularies Generics Volume discounts/mail order prescriptions Patient activism -e.g., AIDS/ACT UP Crossing the border
- 26. Drugs: Who Pays? 55% out-of-pocket 25% private insurance 17% medicaid 3% Other (VA, Workman’s Comp, IHS,
- 27. Drug Development: Who Pays? $20 billion in 1999 Pharmaceutical companies R & D budget increasing U.S.
- 28. Drug Development Costs 1991 PHRMA study (flawed): up to $800 million per drug Other estimate: $300
- 29. Where Prescription Dollars Go Research and development - 12% -preclinical testing - 6% -clinical testing -
- 30. The Elderly and Prescription Drug Coverage Elderly represent 12% of U.S. population, yet account for 33%
- 31. The Elderly and Prescription Drug Coverage Average outpatient drug expenditure from $59 - $1,1153 Drug expenditures
- 32. Race, The Elderly and Prescription Drug Coverage Older black Americans are more likely than whites to
- 33. The Elderly and Prescription Drug Coverage Consequences: The elderly, chronically ill without coverage are twice as
- 34. The Elderly and Prescription Drug Coverage Universal outpatient drug coverage cost-saving -pharmaceutical industry strongly opposed Bush/Congressional
- 35. The Elderly and Prescription Drug Coverage 2001 California Medicare Prescription Drug Discount Program 75% compliance by
- 36. Expired Drugs Initial packaging date usually 2-3 yrs from the date of manufacture Pharmacists repackage –
- 37. Drug Reimbursement Systems Copayments -income variation -exempted groups Cost-sharing Expenditure limits Positive and negative prescribing lists
- 38. Pharmaceutical Benefits Managers 100-115 million patients affected Purpose -Improve prescribing practices -Control Costs Open vs closed
- 39. Pharmaceutical Benefits Manufacturers Data -may not decrease costs, due to increased OTC medications use, longer hospital
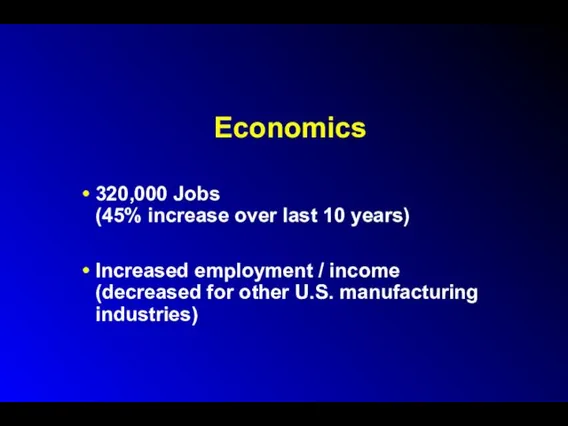
- 40. Economics 320,000 Jobs (45% increase over last 10 years) Increased employment / income (decreased for other
- 41. Generics Increased market share -1983 = 15% -1993 = 40% -2000 = 42% $20 billion sales
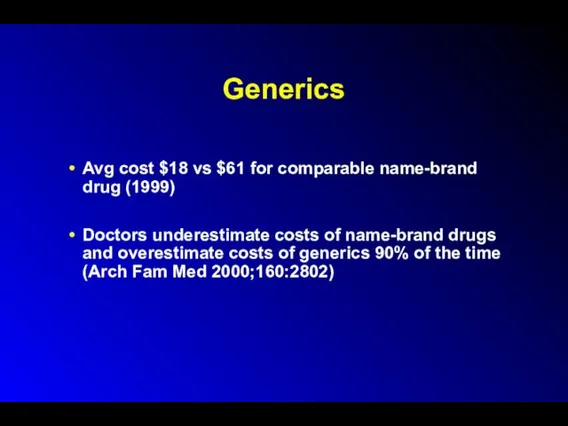
- 42. Generics Avg cost $18 vs $61 for comparable name-brand drug (1999) Doctors underestimate costs of name-brand
- 43. Generics Drug Price Competition and Patent Term Restoration Act (1984) -requires bioequivalence, rather than therapeutic equivalence
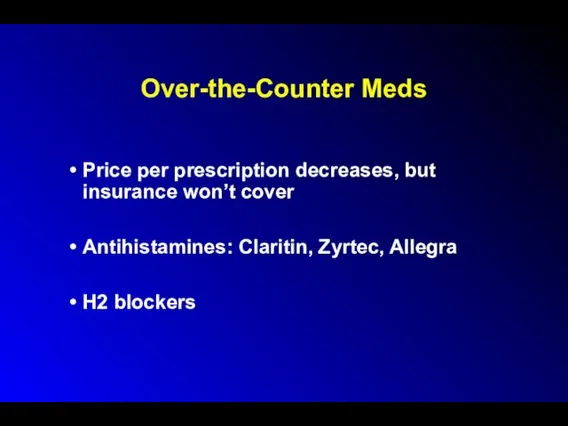
- 44. Over-the-Counter Meds Price per prescription decreases, but insurance won’t cover Antihistamines: Claritin, Zyrtec, Allegra H2 blockers
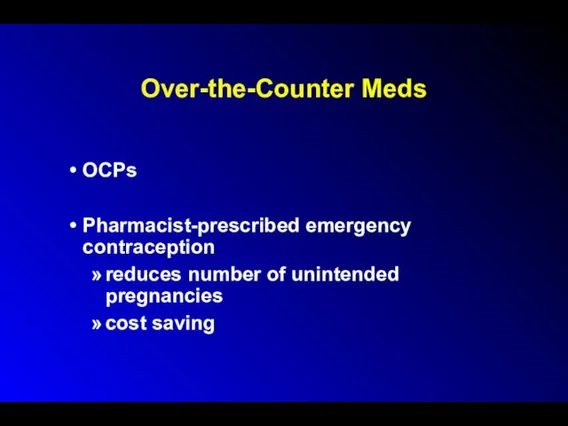
- 45. Over-the-Counter Meds OCPs Pharmacist-prescribed emergency contraception reduces number of unintended pregnancies cost saving
- 46. Generics - Litigation Under Hatch-Waxman Law of 1984, lawsuits brought by pharmaceutical companies against generic manufacturers,
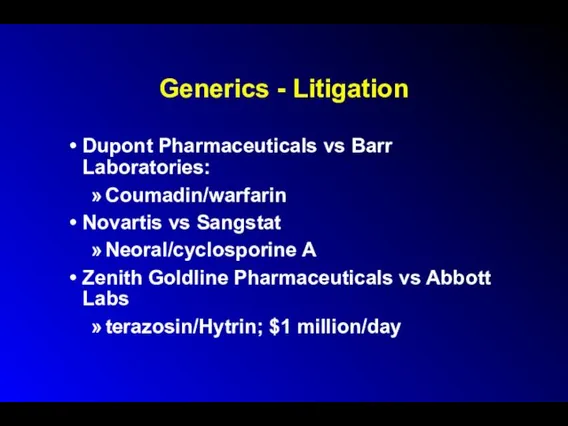
- 47. Generics - Litigation Dupont Pharmaceuticals vs Barr Laboratories: Coumadin/warfarin Novartis vs Sangstat Neoral/cyclosporine A Zenith Goldline
- 48. Lobbying, Patent Extensions and Alternate Formulations Lobbying and Congressional bills Schering Plough / Claritin - $20
- 49. Lobbying 1998: agribusiness spent $119.3 million lobbying Congress 1998: environmental groups spent $4.7 million on all
- 50. Lobbying All industry = $1.2 billion/yr (not including campaign contributions and soft money) All single issue
- 51. Pharmaceutical Company Advertising $15 billion/year in 2000 over $6 billion - advertising and marketing over $7
- 52. Pharmaceutical Company Advertising – Drug Samples $8 billion/year in samples (10-20% of office visits) Only ½
- 53. Drug Samples Prescription Drug Marketing Act of 1987 prohibits sales of samples Requires practitioner signatures Mandates
- 54. Drug Samples Pros/Cons Alternatives: Coupons Vouchers Medication Assistance Programs
- 55. Truthfulness in Drug Ads Wilkes et al. Ann Int Med 1992:116:912-9 10 leading medical journals 109
- 56. Truthfulness in Drug Ads: FDA Requirements True statements -effectiveness -contradictions -side effects Balance Instructions for use
- 57. Truthfulness in Drug Ads: Data 57% little of no educational value 40% not balanced 33% misleading
- 58. Truthfulness in Drug Ads 500 FDA violations from 1997-mid-2001 - includes 90 DTC ads Increased FDA
- 59. Untruthfulness in Drug Ads: Reasons Advertisement income Business branch handles ads Oversight by journals would be
- 60. Truthfulness in Drug Ads Higher percentage of ads misleading in Third World Most agents available OTC
- 61. Doctors are Influenced Formulary Requests (JAMA 1994;271:684-9) Met with drug rep – 3.4X more likely to
- 62. Dubious Advertising Tactics Sponsored symposia and publications “Buying” ghost-written editorials Non-peer-reviewed papers in “throwaway” journals >100
- 63. Dubious Advertising Tactics Disorders Made to Order: GAD, Social Anxiety Disorder, ADHD, etc. Sales of antipsychotics
- 64. Direct to Consumer Advertising Began in 1980, briefly banned 1983-85 Expenditures: $155 million—1985 $356 million--1995 $1
- 65. Direct to Consumer Advertising US and New Zealand only countries to allow prime time TV advertising
- 66. Direct to Consumer Advertising: Use of Celebrities Micky Mantle – Voltaren Bob Dole – Viagra Joan
- 67. Direct to Consumer Advertising Better educated/informed patients Discovery of unrecognized illnesses: diabetes, hypertension, hep C, ED,
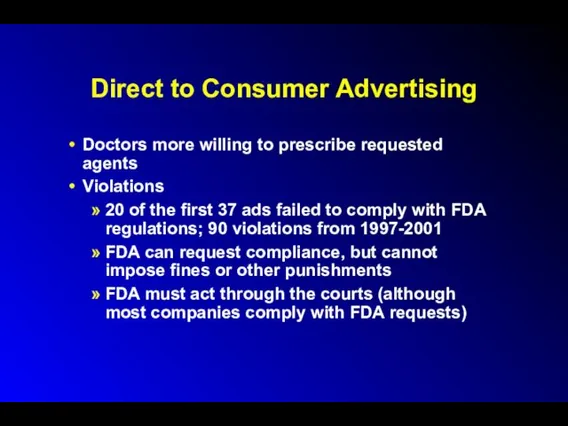
- 68. Direct to Consumer Advertising Doctors more willing to prescribe requested agents Violations 20 of the first
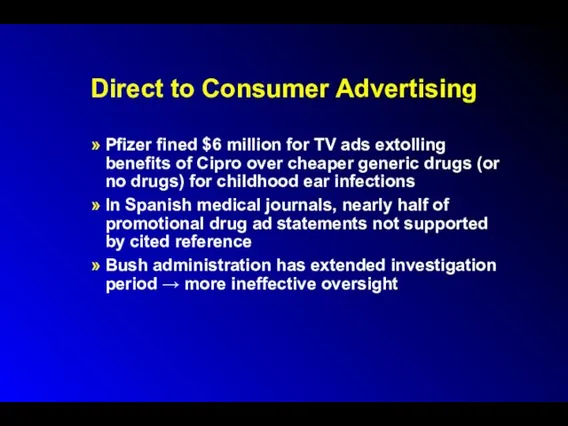
- 69. Direct to Consumer Advertising Pfizer fined $6 million for TV ads extolling benefits of Cipro over
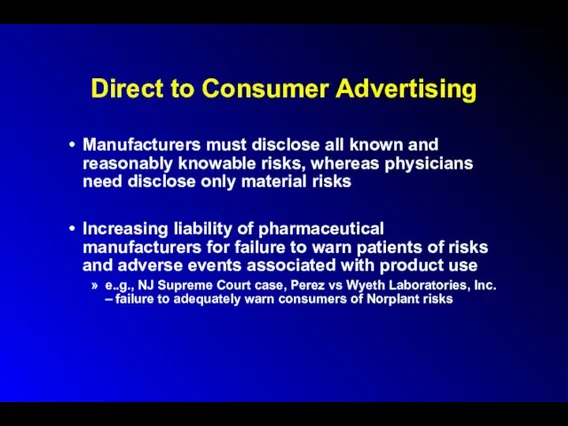
- 70. Direct to Consumer Advertising Manufacturers must disclose all known and reasonably knowable risks, whereas physicians need
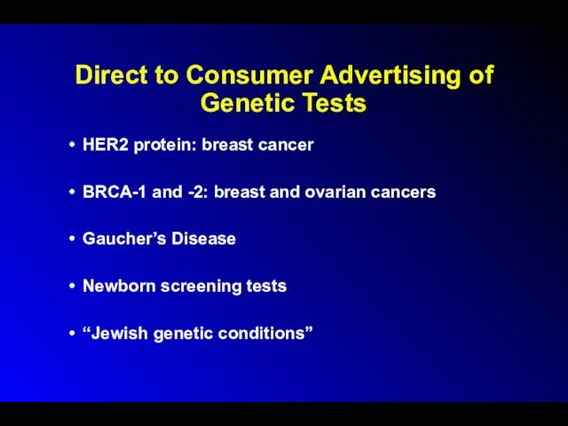
- 71. Direct to Consumer Advertising of Genetic Tests HER2 protein: breast cancer BRCA-1 and -2: breast and
- 72. Direct to Consumer Advertising of Genetic Tests Overstate the value of genetic tests for clinical care
- 73. Direct to Consumer Advertising of Genetic Tests Inappropriate: Public has limited sophistication regarding genetics in general
- 74. Direct to Consumer Marketing of High-Tech Screening Tests E.g., Electron-beam CT / low-dose spiral CT for
- 75. Sources of Accurate and Reliable Drug Information The Medical Letter Peer-reviewed studies and reviews The FDA
- 76. Pharmaceutical Industry Research Expensive $150-500 million / new drug Patent protection = 20 years (was 17
- 77. The Drug Approval Process Discovery/Characterization Animal studies - acute toxicity - LD50 - Subacute toxicity -
- 78. The Drug Approval Process Human Testing - Phase I: Pharmacological action, dose tolerance, toxicity, absorption, metabolism,
- 79. FDA Classification of Therapeutic Potential Before 1992: Type A - important therapeutic gain Type B -
- 80. Controlled Substances Schedule I: No accepted medical use; high abuse potential -LSD, Heroin, ?Marijuana Schedule II:
- 81. Controlled Substances Schedule III: Lower abuse potential -Paregoric, Glutethimide, Pentobarbital Schedule IV: Lower abuse potential -Diazepam,
- 82. Pharmaceutical Industry Research IND phases 1, 2, and 3 10,000 synthesized/tested compounds 10 enter clinical trials
- 83. Issues in Drug Company Research 22% of new drugs developed over the last 2 decades truly
- 84. Seeding Trials Sponsored by sales and marketing dept., rather than research division “Investigators” chosen not for
- 85. Seeding Trials Up to 25% of patients enrolled in clinical trials Disproportionate amount paid for “investigator’s”
- 86. Issues in Drug Company Research Species extinction/loss of biodiversity Taxol- Yew tree Indigenous peoples’ rights over
- 87. Issues in Drug Company Research Novel therapeutic agents vs. copycat drugs Methodological Flaws Study design bias
- 88. Issues in Drug Company Research Methodological Flaws (cont.) economic analyses not performed therapeutic benefit claims more
- 89. Issues in Drug Company Research 60% of industry-sponsored trials are contracted out to for-profit research firms,
- 90. Issues in Drug Company Research Symposia Many are drug-company sponsored More likely to have a run-in
- 91. Non-Compliance Short term = 20% Long term (CHF, DM, TB) = 40-60% Long term (other studies):
- 92. Risks of Noncompliance Poorer health outcomes -e.g., CAD/B-Blockers - MI Increases ER visits and hospitalizations -10%
- 93. Monitoring Compliance Direct Methods Direct observation Pill counts Pharmacy records Serum/urine drug/marker levels Expected biologic effects
- 94. Monitoring Compliance Indirect Methods Patient interview Asking patients Physician estimate 50% Sensitivity
- 95. Reasons for Noncompliance Poor patient education Cost M.D. awareness poor Doctors more likely to under- than
- 96. Improving Compliance Patient education Patient satisfaction Cost consciousness Eliminate copayments
- 97. Improving Compliance Decrease dosing frequency Tailor to specific patient activities Tid > q 8 hours Easy-to-use
- 98. Adverse Drug Events Improper use by patients $20 billion in direct costs $55 billion indirect costs
- 99. Adverse Drug Events (Harvard Medical Practice Study) 6.5 ADEs/100 admissions 1% fatal (est. 140,000 deaths/yr. in
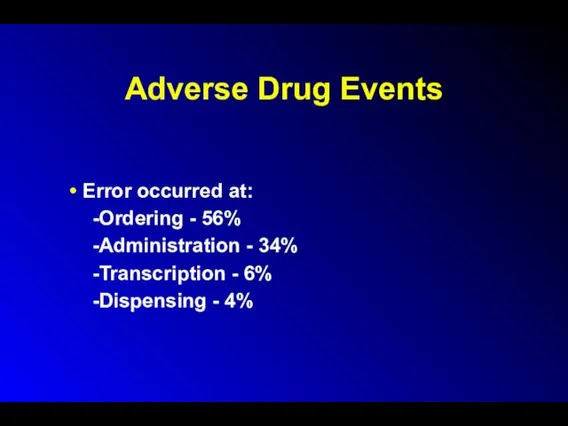
- 100. Adverse Drug Events Error occurred at: -Ordering - 56% -Administration - 34% -Transcription - 6% -Dispensing
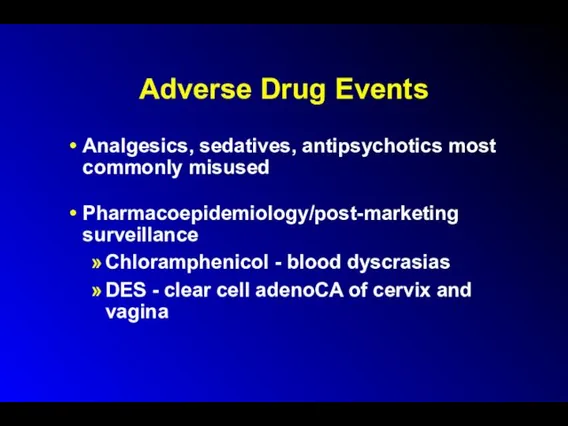
- 101. Adverse Drug Events Analgesics, sedatives, antipsychotics most commonly misused Pharmacoepidemiology/post-marketing surveillance Chloramphenicol - blood dyscrasias DES
- 102. Drug knowledge dissemination Dose and identity checking Patient information availability Order transcription Adverse Drug Events: Reasons
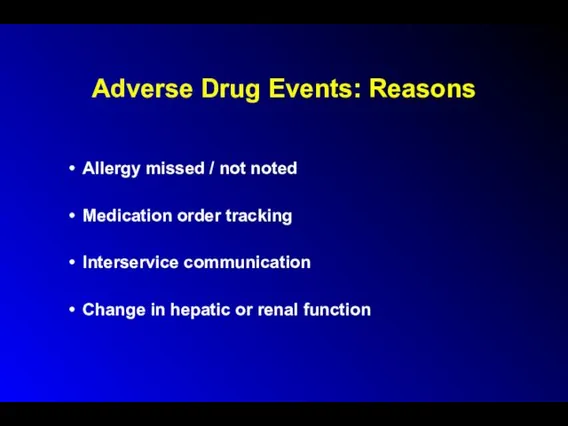
- 103. Adverse Drug Events: Reasons Allergy missed / not noted Medication order tracking Interservice communication Change in
- 104. Adverse Drug Events 4th leading cause of death (?) Increased length of stay Increased risk of
- 105. Alternative Medicine expenditures = $27 billion out of pocket in 1997 $17.8 billion on supplements in
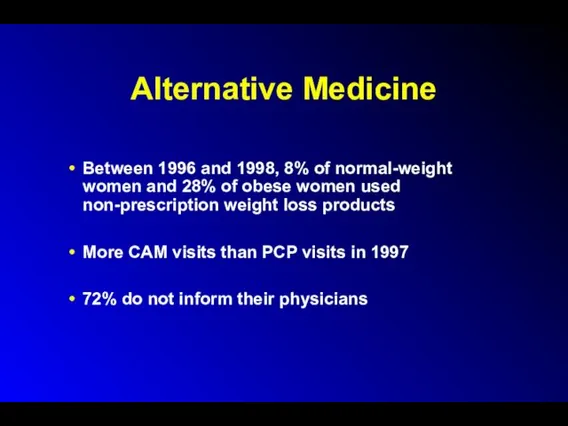
- 106. Alternative Medicine Between 1996 and 1998, 8% of normal-weight women and 28% of obese women used
- 107. Efficacy of Herbal Products Gingko biloba – possible minimal effects on dementia; likely unhelpful for intermittent
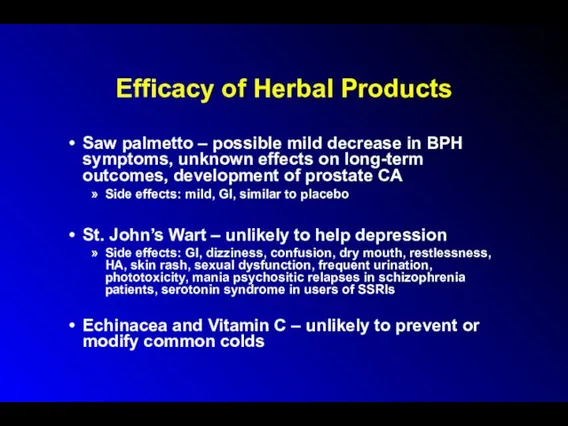
- 108. Efficacy of Herbal Products Saw palmetto – possible mild decrease in BPH symptoms, unknown effects on
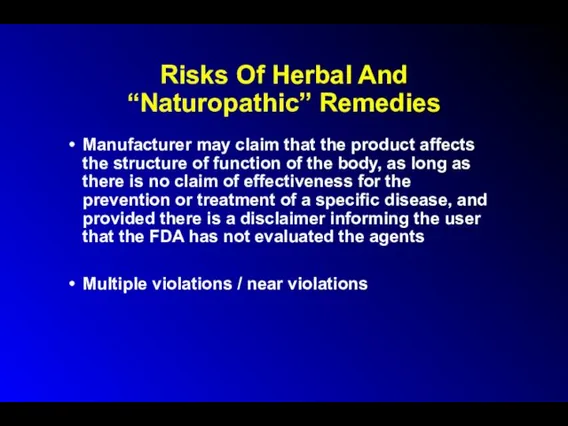
- 109. Risks Of Herbal And “Naturopathic” Remedies Manufacturer may claim that the product affects the structure of
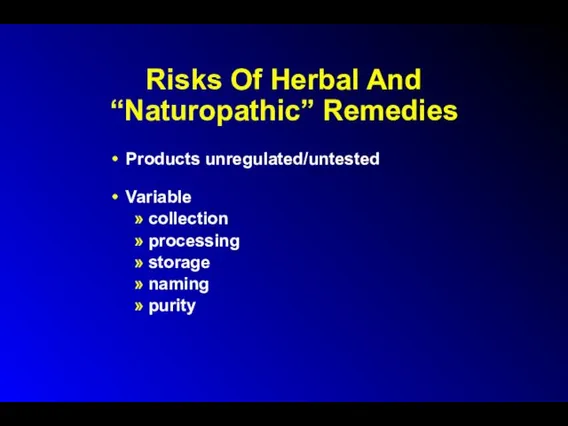
- 110. Risks Of Herbal And “Naturopathic” Remedies Products unregulated/untested Variable collection processing storage naming purity
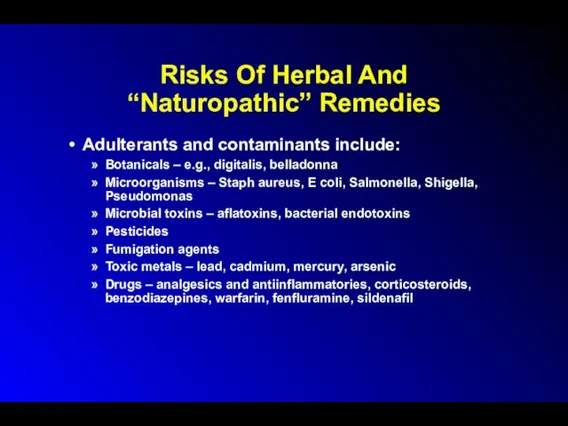
- 111. Risks Of Herbal And “Naturopathic” Remedies Adulterants and contaminants include: Botanicals – e.g., digitalis, belladonna Microorganisms
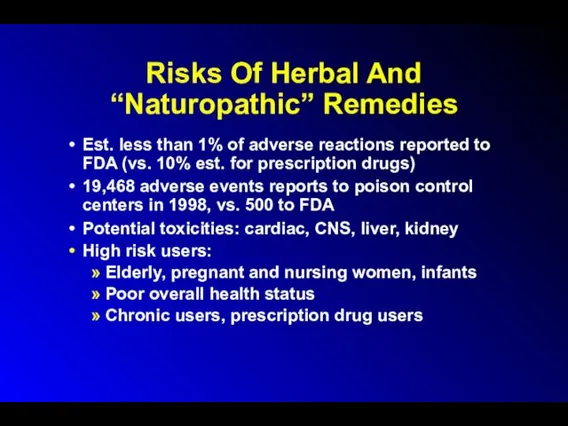
- 112. Risks Of Herbal And “Naturopathic” Remedies Est. less than 1% of adverse reactions reported to FDA
- 113. Risks of Herbal and “Naturopathic” Remedies Dietary supplements containing ephedrine, caffeine HTN, MI, CVA, psychosis, seizures
- 114. Risks of Herbal and “Naturopathic” Remedies GE-L-tryptophan → EMS (1989): 5,000 in US affected, 37 deaths,
- 115. Risks of Herbal and “Naturopathic” Remedies potentiation of anesthetic effects by kava and valerian increased metabolism
- 116. Glucosamine/Chondroitin Meta-analysis showed unlikely to be beneficial for RA and OA Major source = sharks Mass
- 117. Pet Pharmaceuticals $3 billion market Clonicalm (clomipramine) for separation anxiety in dogs Anipryl (seligeline) for canine
- 118. Blurring the line between drugs and cosmetics 1999 spending on cosmetics: Hair care products: $8 billion
- 119. Botox Botulinum toxin: Cause of botulism potential biowarfare/bioterror agent Medical Uses: blepharospasm, spasmodic torticollis, certain types
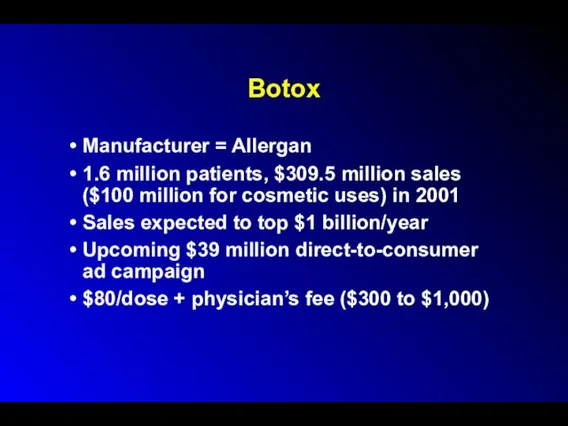
- 120. Botox Manufacturer = Allergan 1.6 million patients, $309.5 million sales ($100 million for cosmetic uses) in
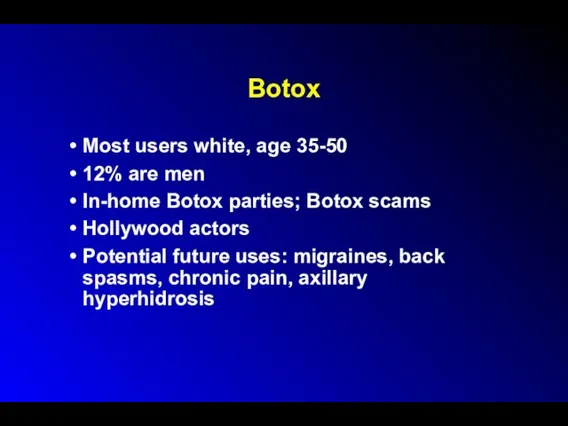
- 121. Botox Most users white, age 35-50 12% are men In-home Botox parties; Botox scams Hollywood actors
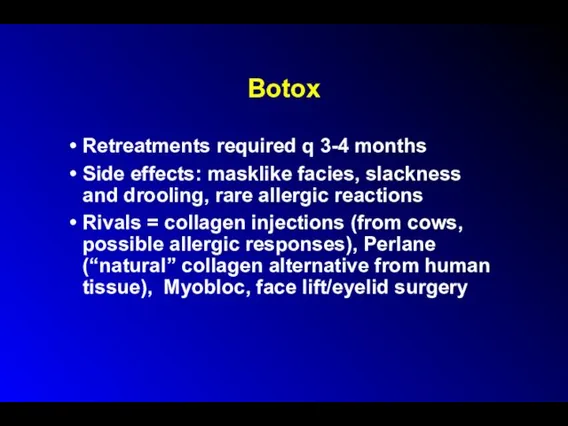
- 122. Botox Retreatments required q 3-4 months Side effects: masklike facies, slackness and drooling, rare allergic reactions
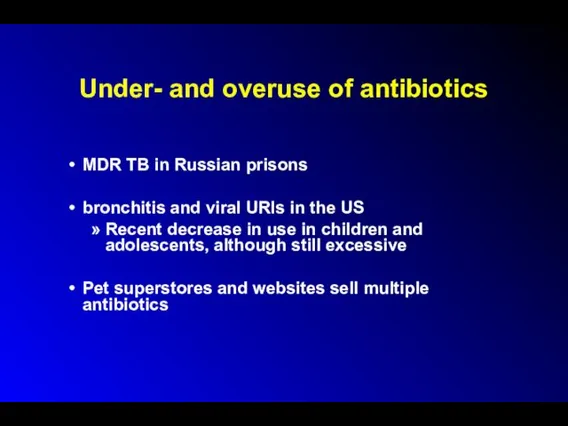
- 123. Under- and overuse of antibiotics MDR TB in Russian prisons bronchitis and viral URIs in the
- 124. Factory Farms, Antibiotics and Anthrax: Putting Profits Before Public Health Martin Donohoe, MD, FACP
- 125. Outline Factory Farming Agricultural Antibiotics Cipro and Anthrax Bayer Conclusions
- 126. Factory Farming Factory farms have replaced industrial factories as the # 1 polluters of American waterways
- 127. Factory Farming Cattle manure 1.2 billion tons Pig manure 116 million tons Chicken droppings 14 million
- 128. Factory Farm Waste Overall number of hog farms down from 600,000 to 157,000 over the last
- 129. Factory Farm Waste Most untreated Ferments in open pools Seeps into local water supply, estuaries Kills
- 130. Agricultural Antibiotic Use Agriculture accounts for 70% of U.S. antibiotic use Use up 50% over the
- 131. Consequences of Agricultural Antibiotic Use Campylobacter fluoroquinolone resistance VREF (poss. due to avoparcin use in chickens)
- 132. Antibiotic Resistant Pathogens CDC: “Antibiotic use in food animals is the dominant source of antibiotic resistance
- 133. Alternatives to Agricultural Antibiotic Use Decrease overcrowding Better diet/sanitation/living conditions Control heat stress Vaccination Increased use
- 134. Alternatives to Agricultural Antibiotic Use: Vegetarianism ↓ water/grain needs ↓ animal fecal waste ↓ rendering/mad cow
- 135. Alternatives to Agricultural Antibiotic Use: Vegetarianism European Union bans antibiotics as growth promoters in animal feed
- 136. Food-Borne Illness ¼ of US population affected per year Each day 200,000 sickened, 900 hospitalized, 14
- 137. Campylobacter Most common food-borne infection in US 2.5 million case of diarrhea and 100 deaths per
- 138. Campylobacter Resistance to Fluoroquinolones Increasing 13% in 1998, 18% in 1999 Fluoroquinolone use up 40% over
- 139. Fluoroquinolones Animal Use Sarafloxacin (Saraflox) – Abbott Labs – voluntarily withdrawn from market Enrofloxacin (Baytril) –
- 140. Anthrax Cipro – patent expires 2004 Doxycycline – generic Penicillin - generic Huge potential profits 280
- 141. Cipro Best selling antibiotic in the world for the last 8 years Eleventh most prescribed drug
- 142. Bayer and Cipro 1997 onward – Bayer pays Barr Pharmaceuticals and two other competitors $200 million
- 143. Cost of Cipro Drugstore = $4.50/pill US government = $0.95/pill for anthrax stockpile (twice what is
- 144. Cost of Cipro US government has the authority, under existing law, to license generic production of
- 145. Why? Weakening of case at WTO meetings that the massive suffering consequent to 25 million AIDS
- 146. Other Consequences Opens door to other situations involving parallel importing and compulsory licensing Threatens pharmaceutical industry’s
- 147. Bayer Based in Leverkusen, Germany 120,000 employees worldwide Annual sales = $28 billion US = largest
- 148. Bayer Pharmaceuticals Third largest manufacturer of herbicides in the world Dominates insecticide market
- 149. Bayer Number one biotech company in Europe (after 2001 purchase of Aventis CropScience) Controls over half
- 150. History of Bayer WW I: invented modern chemical warfare; developed “School for Chemical Warfare” WW II:
- 151. History of Bayer Early 1990s – admitted knowingly selling HIV-tainted blood clotting products which infected up
- 152. History of Bayer 1995 onward - failed to follow promise to withdraw its most toxic pesticides
- 153. History of Bayer 1998 –pays Scottish adult volunteers $750 to swallow doses of the insecticide Guthion
- 154. History of Bayer 2000 – fined by OSHA for workplace safety violations related to MDA (carcinogen)
- 155. History of Bayer 2001 – FDA-reported violations in quality control contribute to worldwide clotting factor shortage
- 156. Bayer’s Corporate Agenda Bluewash: signatory to UN’s Global Compact Greenwash: “crop protection” (pesticides) Promotion of anti-environmental
- 157. Bayer’s Corporate Agenda Corporate Front Groups: “Global Crop Protection Federation” Harrassment / SLAPP suits against watchdog
- 158. Bayer’s Corporate Agenda Lobbying / Campaign donations / Influence peddling: Member of numerous lobbying groups attacking
- 159. Bayer Fortune Magazine (2001): one of the “most admired companies” in the United States Multinational Monitor
- 160. Conclusions Triumph of corporate profits and influence-peddling over urgent public health needs Stronger regulation needed over:
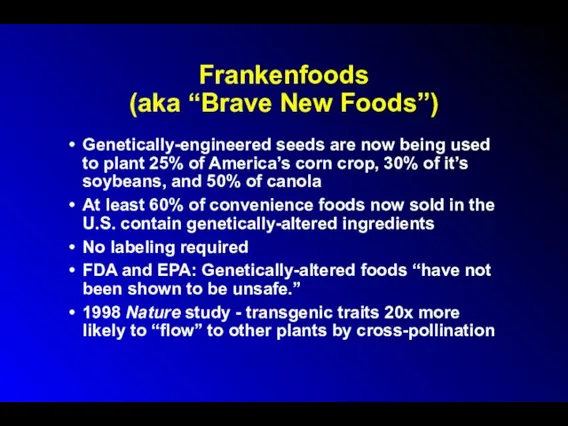
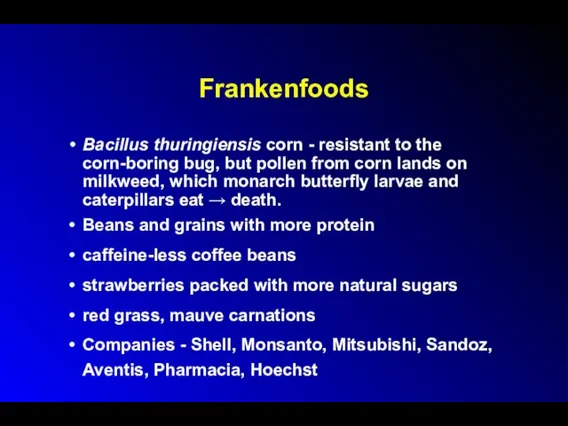
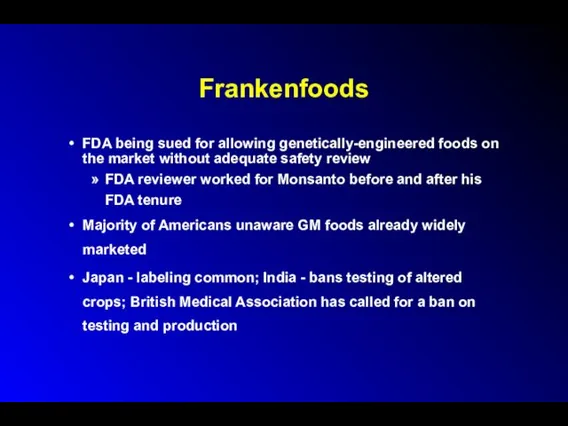
- 161. Frankenfoods (aka “Brave New Foods”) Genetically-engineered seeds are now being used to plant 25% of America’s
- 162. Frankenfoods Bacillus thuringiensis corn - resistant to the corn-boring bug, but pollen from corn lands on
- 163. Frankenfoods FDA being sued for allowing genetically-engineered foods on the market without adequate safety review FDA
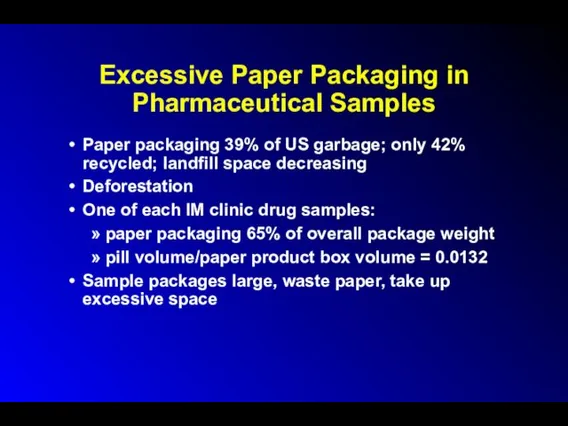
- 164. Excessive Paper Packaging in Pharmaceutical Samples Paper packaging 39% of US garbage; only 42% recycled; landfill
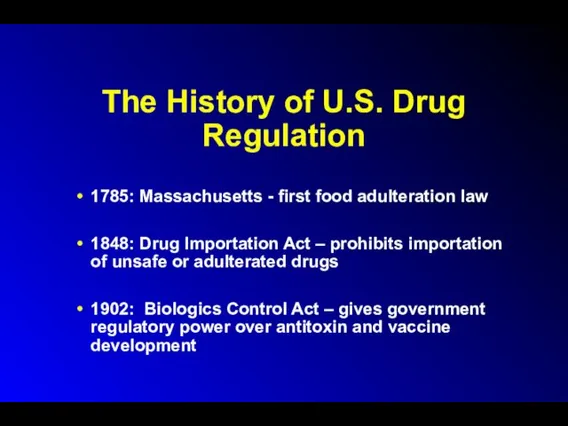
- 165. The History of U.S. Drug Regulation 1785: Massachusetts - first food adulteration law 1848: Drug Importation
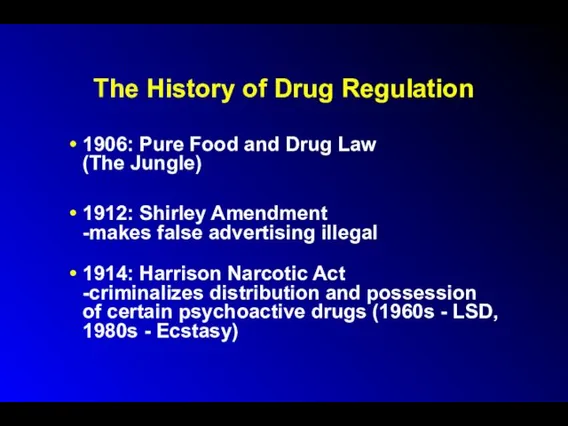
- 166. The History of Drug Regulation 1906: Pure Food and Drug Law (The Jungle) 1912: Shirley Amendment
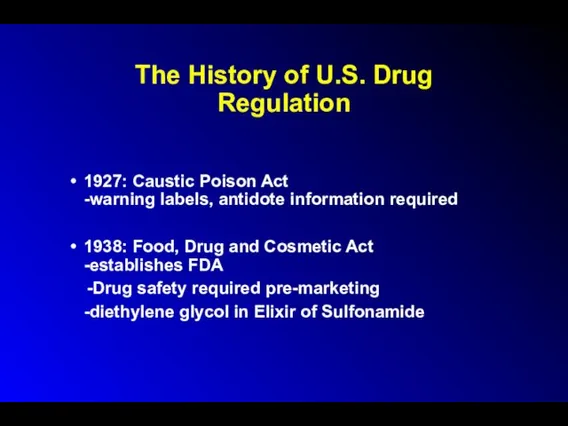
- 167. The History of U.S. Drug Regulation 1927: Caustic Poison Act -warning labels, antidote information required 1938:
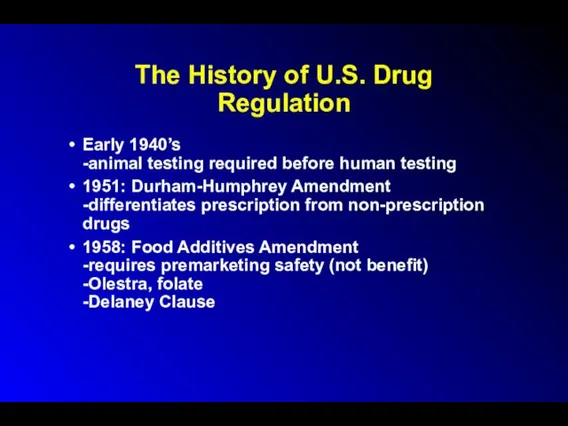
- 168. The History of U.S. Drug Regulation Early 1940’s -animal testing required before human testing 1951: Durham-Humphrey
- 169. The History of U.S. Drug Regulation 1962: Kefauver-Harris Amendment -response to thalidomide crisis -requires pre-marketing effectiveness
- 170. The History of Drug Regulation 1976: Medical Device Amendment 1977: Pregnant and (potentially pregnant) women excluded
- 171. The History of U.S. Drug Regulation 1981: Drug Ad Regulations passed 1982: Tamper-Resistant Packaging Regulations -Tylenol/Cyanide
- 172. The History of U.S. Drug Regulation ODA: More than 40 drugs developed, including 28 new molecular
- 173. The History of U.S. Drug Regulation 1994: Dietary Supplement Health and Education Act -supplements excluded from
- 174. The FDA: Current Issues Nicotine/Cigarette regulation Policies re transgenic foods Guidelines on industry-sponsored events, texts and
- 175. The FDA: Current Issues Waiver of informed consent during wartime -Pyridostigmine -Botulinum-toxoid vaccine Regulation of drug
- 176. The FDA Modernization and Accountability Act of 1997 (SB-830) Cuts from 2 to 1 the number
- 177. US Drug Regulation 2002: The Best Pharmaceuticals Act for Children Extends patent protection when companies promise
- 178. FDA Oversight 2100 scientists in 40 labs in Washington, D.C. and around the U.S. 1100 investigators
- 179. FDA Oversight 3000 products per year found to be unfit for consumers and withdrawn from marketplace
- 180. FDA Oversight U.S. outpaces Germany and Japan (and equals the UK) in rate of approving new
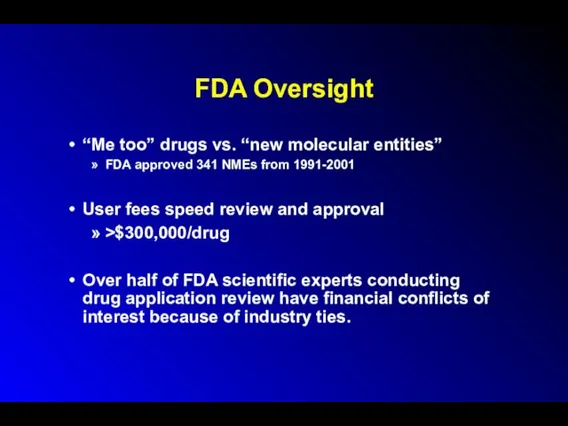
- 181. FDA Oversight “Me too” drugs vs. “new molecular entities” FDA approved 341 NMEs from 1991-2001 User
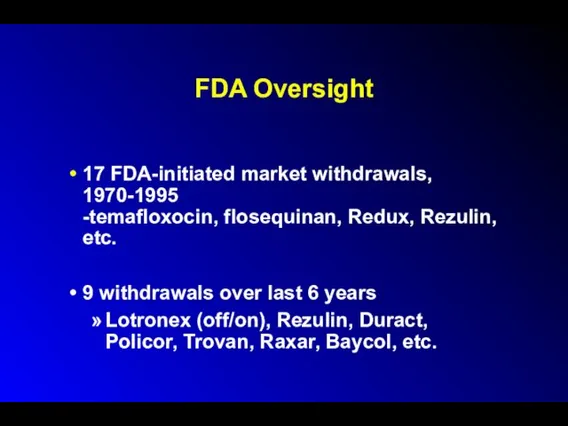
- 182. FDA Oversight 17 FDA-initiated market withdrawals, 1970-1995 -temafloxocin, flosequinan, Redux, Rezulin, etc. 9 withdrawals over last
- 183. FDA Oversight: Recalls and Safety Alerts 52 advisories involving 408,500 pacemakers and 114,645 ICDs from 1/90
- 184. FDA Oversight Ad review and phase 4 studies (post-marketing surveillance) underfunded ($17 million annually for safety
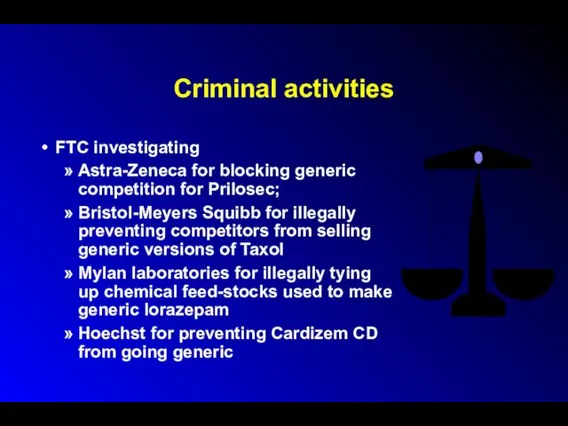
- 185. Criminal activities FTC investigating Astra-Zeneca for blocking generic competition for Prilosec; Bristol-Meyers Squibb for illegally preventing
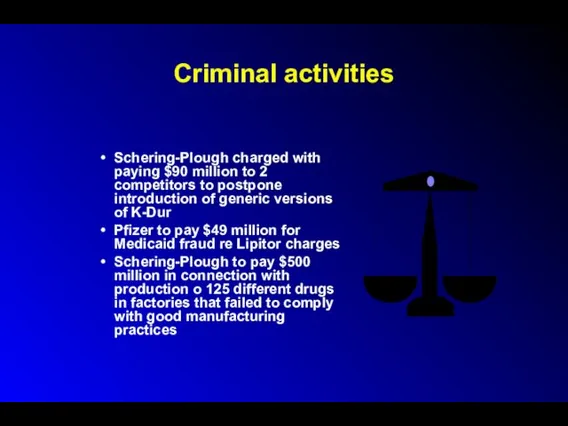
- 186. Criminal activities Schering-Plough charged with paying $90 million to 2 competitors to postpone introduction of generic
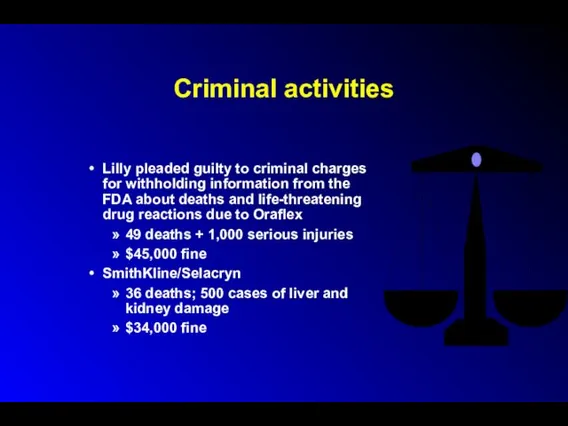
- 187. Criminal activities Lilly pleaded guilty to criminal charges for withholding information from the FDA about deaths
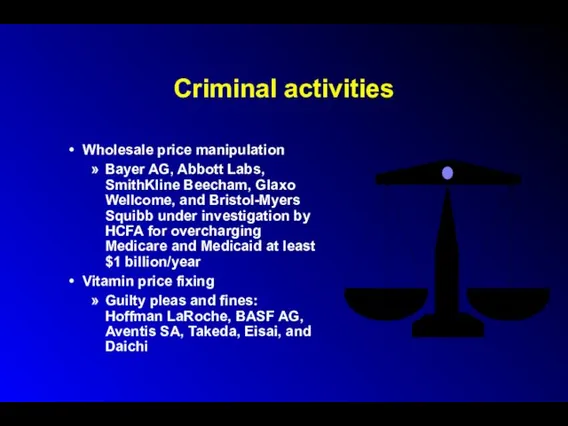
- 188. Criminal activities Wholesale price manipulation Bayer AG, Abbott Labs, SmithKline Beecham, Glaxo Wellcome, and Bristol-Myers Squibb
- 189. Investigations / Possible Criminal Activities Justice Department investigating: Metabolife for falsification of ephedra safety data Merck
- 190. Investigations / Possible Criminal Activities ?Criminal charges? Albuterol-less inhalers from Schering Plough sloppy manufacturing; delayed recall
- 191. Drug Companies Behaving Badly: The 10 Worst Corporations of 2002 *Multinational Monitor Wyeth Revealed that Ayerst
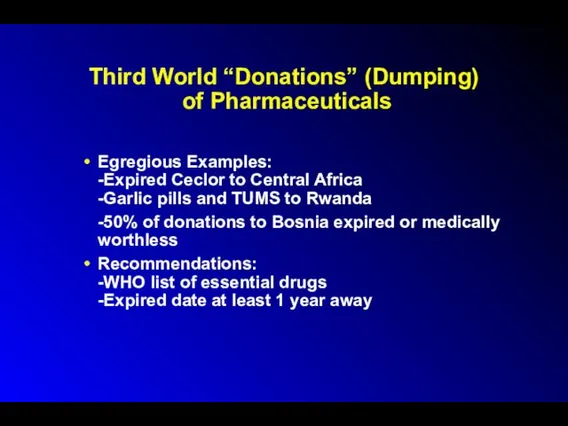
- 192. Third World “Donations” (Dumping) of Pharmaceuticals Genuine gifts Dubious “gifts” -- reasons: -clear out stocks of
- 193. Third World “Donations” (Dumping) of Pharmaceuticals Egregious Examples: -Expired Ceclor to Central Africa -Garlic pills and
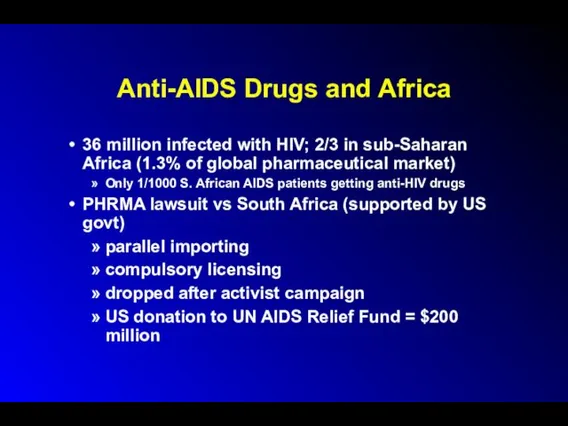
- 194. Anti-AIDS Drugs and Africa 36 million infected with HIV; 2/3 in sub-Saharan Africa (1.3% of global
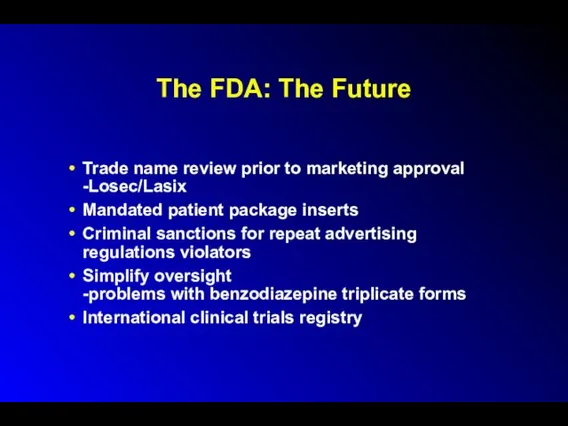
- 195. The FDA: The Future Trade name review prior to marketing approval -Losec/Lasix Mandated patient package inserts
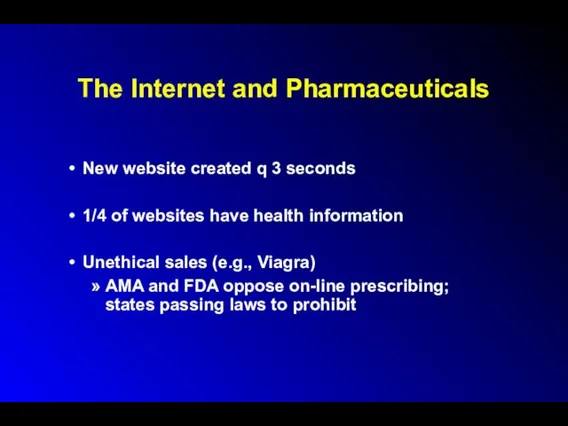
- 196. The Internet and Pharmaceuticals New website created q 3 seconds 1/4 of websites have health information
- 197. The Internet and Pharmaceuticals Free software / Physician profiling “ePocrates” Internet pharmacies $1.9 billion sales (1999);
- 198. Physician Prescribing Habits Influences -texts, journals, colleagues, marketing and advertising -ego bias -how benefits presented -average
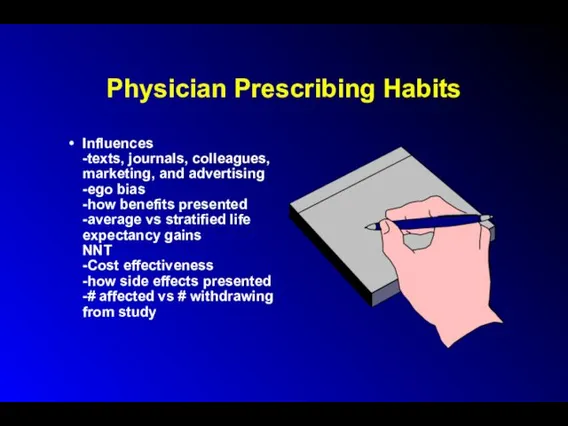
- 199. Physician Prescribing Habits Influences -texts, journals, colleagues, marketing, and advertising -ego bias -how benefits presented -average
- 200. Physician Prescribing Habits Up to 85% of residents prescribe to non-patients 50% of residents self-prescribe early
- 201. Pharmaceuticals Sales Reps’ Techniques Appeal to authority Appeal to popularity The “red herring” Appeal to pity
- 202. Pharmaceuticals Sales Reps’ Techniques Appeal to curiosity Free food/gifts Testimonials Relationship building/face time
- 203. Pharmaceutical Sales Reps’ Techniques Active learning -- reinforcement plus change Favorable but inaccurate statements Negative comments
- 204. Relating to Pharmaceutical Reps Awareness of sales tactics Question them, ask for references Level of presence
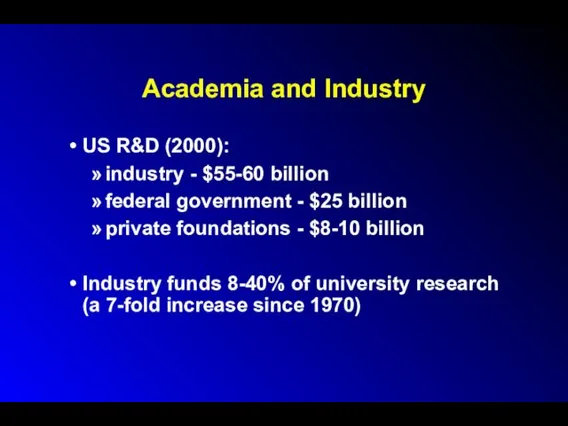
- 205. Academia and Industry US R&D (2000): industry - $55-60 billion federal government - $25 billion private
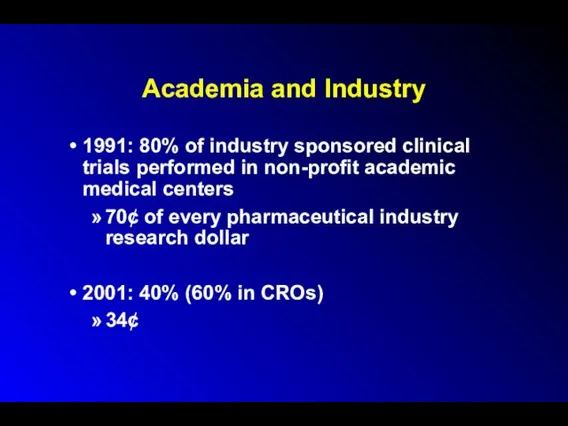
- 206. Academia and Industry 1991: 80% of industry sponsored clinical trials performed in non-profit academic medical centers
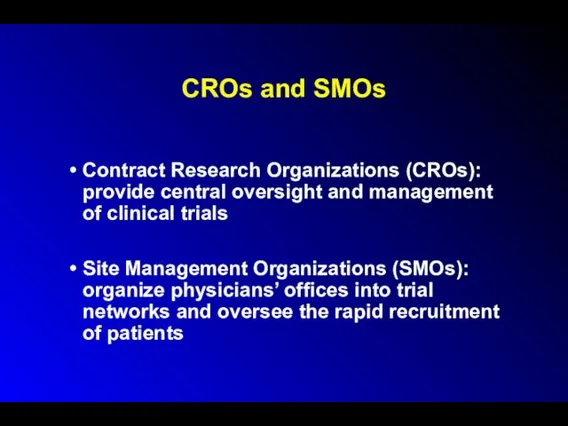
- 207. CROs and SMOs Contract Research Organizations (CROs): provide central oversight and management of clinical trials Site
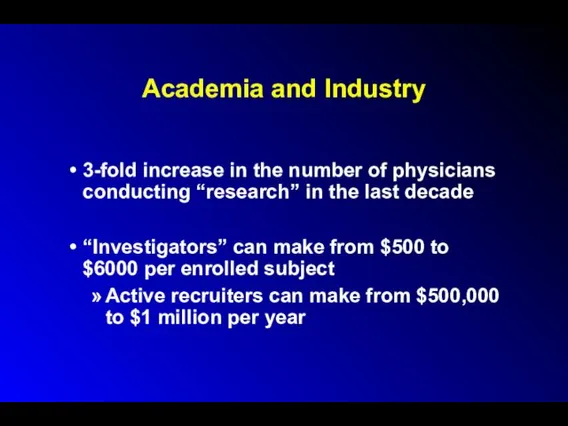
- 208. Academia and Industry 3-fold increase in the number of physicians conducting “research” in the last decade
- 209. Unfunded Studies 23% in 1 month -53% of these were case series 29% involved unaccounted-for direct
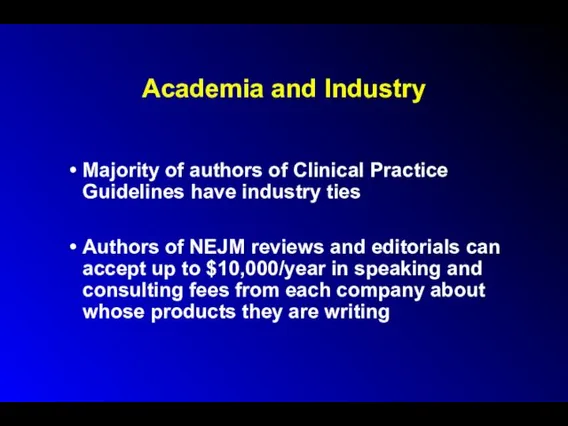
- 210. Academia and Industry Majority of authors of Clinical Practice Guidelines have industry ties Authors of NEJM
- 211. Academia and Industry Increasing exclusive university - corporate agreements MIT – 5 yr, $15 million deal
- 212. Academia, Industry and Medical Research 1999-2001: Federal authorities restricted or shut down human subject research at
- 213. Academia - Industry Collaboration ¼ of scientific investigators have industry affiliations 2/3 of academic institutions hold
- 214. Collaboration Difficulties Complicated university beaureacracies/regulations - 50% Disputes over intellectual property - 34% Changes in academic
- 215. Collaboration Difficulties Impaired sharing of knowledge, materials Difficulty in repeating/verifying important research Driven by usual academic
- 216. Educational Concerns Regarding Industry Funded Research Diversion of faculty away from teaching, towards more remunerative consultations
- 217. Concerns Re Research in the U.S. Inverse relationship between growth in NIH awards during the past
- 218. Withholding of Data Only 12% of university conflict of interest policies specify limits on permissible delays
- 219. Withholding of Data: Examples Chamberlin family - obstetrical forceps UCSF Synthroid study (Boots/Knoll Pharmaceuticals) JAMA Celebrex
- 220. Industry/Special Interest Groups and Researchers CDC gun violence studies - NRA Breast Implants - Congress, Women’s
- 221. Industry/Special Interest Groups and Researchers Spinal fusion - North American Spine Society, pedicle screw manufacturers Multiple
- 222. Harassment of Researchers Betty Dong/UCSF (Synthroid) - Boots/Knoll Pharmaceuticals Nancy Oliveri/University of Toronto (deferipone) - Apotex
- 223. Harassment of Researchers David Healy/University of Toronto (Prozac) - Eli Lilly Anne Holbrook/McMaster U/ PUD-GERD panel
- 224. The Pharmaceutical Industry and Medical Ethics Funding of conferences, Centers of Ethics, individual investigators E.g., $1
- 225. The Pharmaceutical Industry and Medical Ethics Ethics consultants serving on corporate boards E.g., Harold Shapiro continued
- 226. Recommendations for Industry-Sponsored Research Written agreements with university, not researcher Alternatives selected based on clinical relevance
- 227. Recommendations for Industry-Sponsored Research Full disclosure of conflicts of interest No gag clauses regarding publication Investigator
- 228. Industry/Special Interest Groups and Researchers/Societies Pork barrel research funding - Congress c.f., legislating medical practice -
- 229. AMA Guidelines Re Gifts to Physicians from Industry Minimal value gifts O.K. -pens, notepads, modest meals,
- 230. AMA Guidelines Re Gifts to Physicians from Industry No gifts with strings attached CME sponsorship money
- 231. AMA Guidelines Re Gifts to Physicians from Industry AMA $1 million “educational” campaign: - $325,000 from
- 232. Patients’ Attitudes Toward Pharmaceutical Company Gifts (Gibbons et al.) 200 patients, 270 physicians 1/2 of patients
- 233. Guidelines for Speakers at Industry-Sponsored Events Educational, not promotional Based on scientific data and clinical experience
- 234. Trends to Watch For Drug companies buying health providers -Zeneca Group/Salick Health Care Drug companies purchasing
- 235. Trends to Watch For Medical school / drug company alliances Novartis - UC Berkeley; Pharmacia -
- 236. Human Experimentation: US and Abroad 90% of health research dollars are spent on the health problems
- 237. Human Experimentation: US and Abroad Human Experimentation Companies For-Profit IRBs Private-practice-based “investigators”
- 238. Enhancing Cooperation Between Physicians and the Pharmaceutical Industry Improving compliance Decreasing adverse events Promotion and funding
- 239. Conclusions Pharmaceuticals and Biotechnology Industries -Tremendous contributions to health -Motivation = “alleviate suffering” -Primary responsibility =
- 240. Useful Phone Numbers FDA and Regulated Products Info 1-800-222-0185 Medwatch/Adverse Events Reporting 1-800-332-1088 Advertising/Promotion/Marketing Concerns 1-800-238-7332
- 242. Скачать презентацию
The Pharmaceutical Industry Outline
Economics
drug costs
drug development
Research
Marketing
Drug Regulation/The FDA
Ethical, Legal and Policy
The Pharmaceutical Industry Outline
Economics
drug costs
drug development
Research
Marketing
Drug Regulation/The FDA
Ethical, Legal and Policy
Home Care
80-90% of illnesses cared for outside formal health care system
Family
Home Care
80-90% of illnesses cared for outside formal health care system
Family
Self Medication
Inappropriate self (and child) medication
- diarrhea
- the common cold
- other
Self Medication
Inappropriate self (and child) medication
- diarrhea
- the common cold
- other
Self Medication
Enemas for diarrhea and fever
Mix benadryl and alcohol for insomnia
Educational
Self Medication
Enemas for diarrhea and fever
Mix benadryl and alcohol for insomnia
Educational

Inappropriate Self-medication: The Common Cold
Greater than 800 OTC medications available
Inappropriate Self-medication: The Common Cold
Greater than 800 OTC medications available
Inappropriate Self Medication: Diarrhea
Greater than 100 OTC medications available
15% of children
Inappropriate Self Medication: Diarrhea
Greater than 100 OTC medications available
15% of children
Inappropriate OTC Medication Use in Children
Ineffective
Potential for ADEs and ODs
Profile of
Inappropriate OTC Medication Use in Children
Ineffective
Potential for ADEs and ODs
Profile of
Prescription Drugs
10,000 FDA-approved drugs
70% of all office visits lead to prescriptions
1.5
Prescription Drugs
10,000 FDA-approved drugs
70% of all office visits lead to prescriptions
1.5
Prescription Drugs
>10% of U.S. medical costs
account for 44% of increase in
Prescription Drugs
>10% of U.S. medical costs
account for 44% of increase in
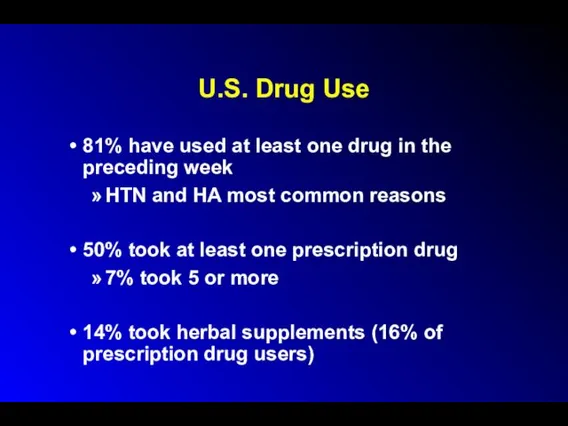
U.S. Drug Use
81% have used at least one drug in the
U.S. Drug Use
81% have used at least one drug in the
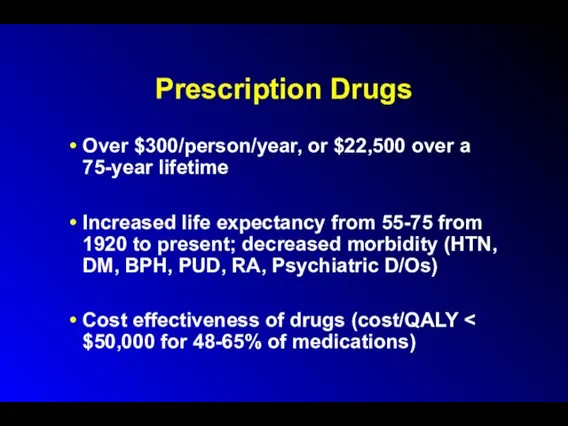
Prescription Drugs
Over $300/person/year, or $22,500 over a 75-year lifetime
Increased life expectancy
Prescription Drugs
Over $300/person/year, or $22,500 over a 75-year lifetime
Increased life expectancy
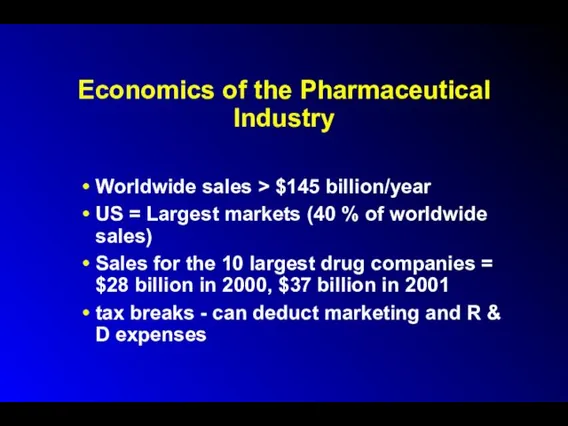
Economics of the Pharmaceutical Industry
Worldwide sales > $145 billion/year
US = Largest
Economics of the Pharmaceutical Industry
Worldwide sales > $145 billion/year
US = Largest
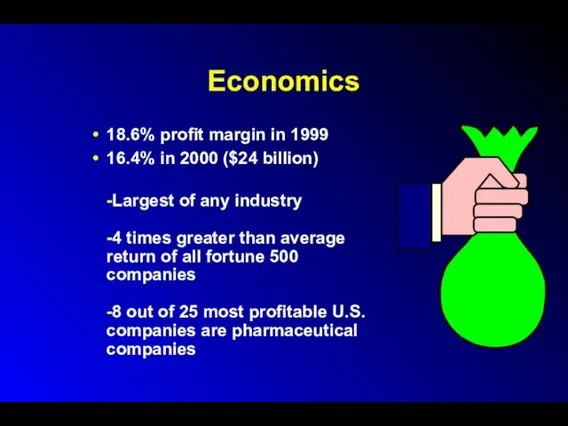
Economics
18.6% profit margin in 1999
16.4% in 2000 ($24 billion)
-Largest of
Economics
18.6% profit margin in 1999
16.4% in 2000 ($24 billion)
-Largest of
Economics of the Pharmaceutical Industry
Greater than 5000 companies worldwide
-less than 100
Economics of the Pharmaceutical Industry
Greater than 5000 companies worldwide -less than 100
Mergers and Acquisitions
Drug company mergers
- Pfizer-Warner-Lambert, Upjohn-Pharmacia, Glaxo-Wellcome-SmithKliine Beecham, etc.
Pfizer acquired
Mergers and Acquisitions
Drug company mergers
- Pfizer-Warner-Lambert, Upjohn-Pharmacia, Glaxo-Wellcome-SmithKliine Beecham, etc.
Pfizer acquired
Mergers and Acquisitions
Acquisition of generic divisions and PBM’s
-Merck-Medco
-Glaxo-Wellcome-Smith-Kline Beecham-DPS
-Lilly - PCS
Mergers and Acquisitions
Acquisition of generic divisions and PBM’s
-Merck-Medco
-Glaxo-Wellcome-Smith-Kline Beecham-DPS
-Lilly - PCS
Economics
Sales revenues tripled over last decade
Prices increased 150% (verses 50% CPI
Spending
Economics
Sales revenues tripled over last decade
Prices increased 150% (verses 50% CPI
Spending
Economics
Average CEO compensation = $20 million (1998)
Pharmaceutical Manufacturer’s Association and Medical
Economics
Average CEO compensation = $20 million (1998)
Pharmaceutical Manufacturer’s Association and Medical
Drug Industry Lobbying
$38 million donated to Congressional campaigns in the 1990s
$84
Drug Industry Lobbying
$38 million donated to Congressional campaigns in the 1990s
$84
Drug Industry Lobbying
623 lobbyists for 535 members of Congress
Orrin Hatch (R-Utah)
Drug Industry Lobbying
623 lobbyists for 535 members of Congress
Orrin Hatch (R-Utah)
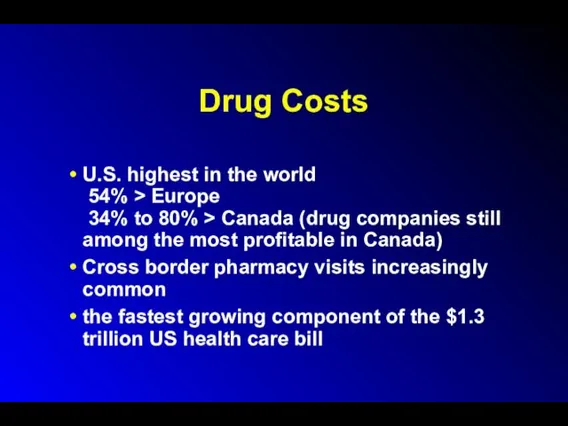
Drug Costs
U.S. highest in the world
54% > Europe
34%
Drug Costs
U.S. highest in the world 54% > Europe 34%
Drug Costs
U.S. only large industrialized country not regulating drug prices AND
Drug Costs
U.S. only large industrialized country not regulating drug prices AND
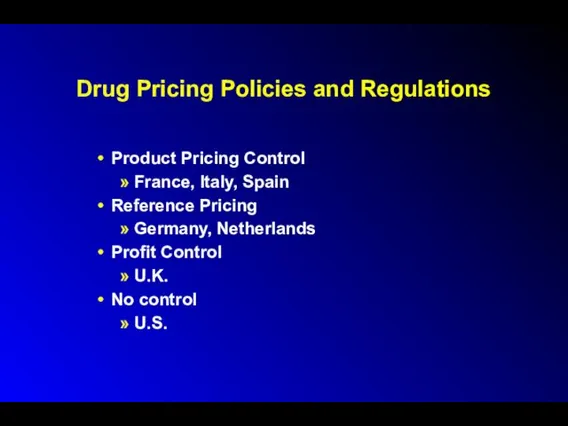
Drug Pricing Policies and Regulations
Product Pricing Control
France, Italy, Spain
Reference Pricing
Germany, Netherlands
Profit
Drug Pricing Policies and Regulations
Product Pricing Control
France, Italy, Spain
Reference Pricing
Germany, Netherlands
Profit
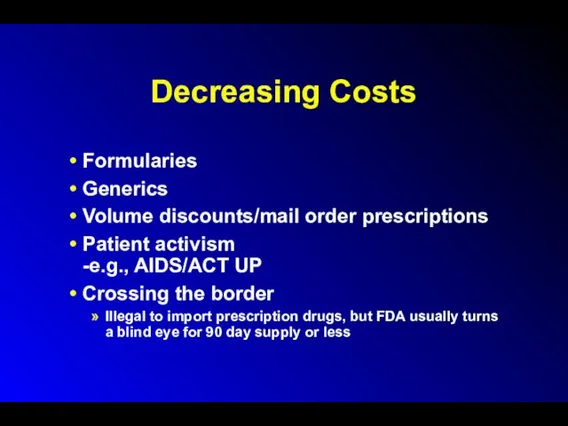
Decreasing Costs
Formularies
Generics
Volume discounts/mail order prescriptions
Patient activism
-e.g., AIDS/ACT UP
Crossing the border
Illegal to
Decreasing Costs
Formularies
Generics
Volume discounts/mail order prescriptions
Patient activism
-e.g., AIDS/ACT UP
Crossing the border
Illegal to
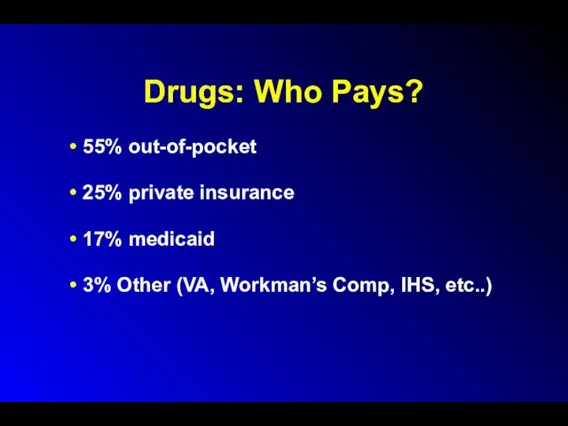
Drugs: Who Pays?
55% out-of-pocket
25% private insurance
17% medicaid
3% Other (VA, Workman’s
Drugs: Who Pays?
55% out-of-pocket
25% private insurance
17% medicaid
3% Other (VA, Workman’s

Drug Development: Who Pays?
$20 billion in 1999
Pharmaceutical companies
R & D budget
Drug Development: Who Pays?
$20 billion in 1999
Pharmaceutical companies
R & D budget
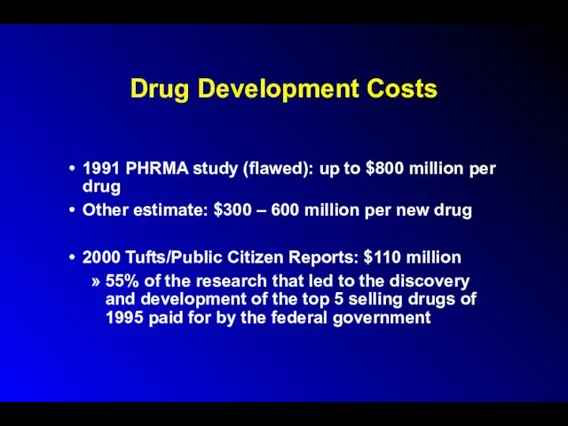
Drug Development Costs
1991 PHRMA study (flawed): up to $800 million per
Drug Development Costs
1991 PHRMA study (flawed): up to $800 million per
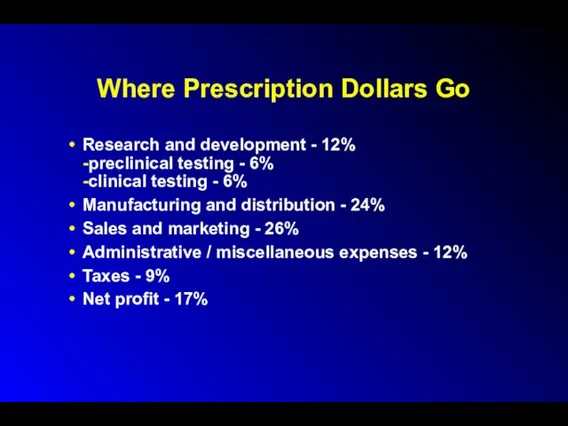
Where Prescription Dollars Go
Research and development - 12%
-preclinical testing - 6%
-clinical
Where Prescription Dollars Go
Research and development - 12% -preclinical testing - 6% -clinical
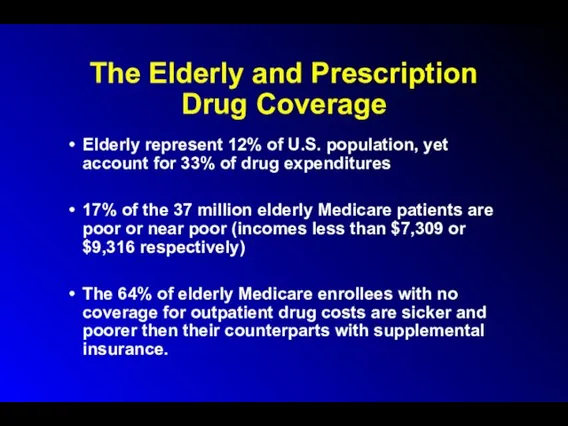
The Elderly and Prescription Drug Coverage
Elderly represent 12% of U.S. population,
The Elderly and Prescription Drug Coverage
Elderly represent 12% of U.S. population,
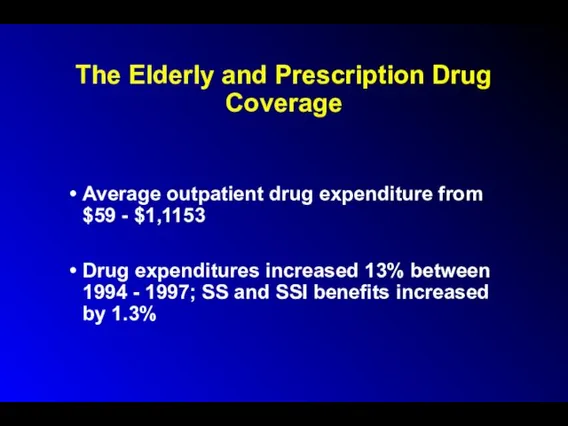
The Elderly and Prescription Drug Coverage
Average outpatient drug expenditure from $59
The Elderly and Prescription Drug Coverage
Average outpatient drug expenditure from $59
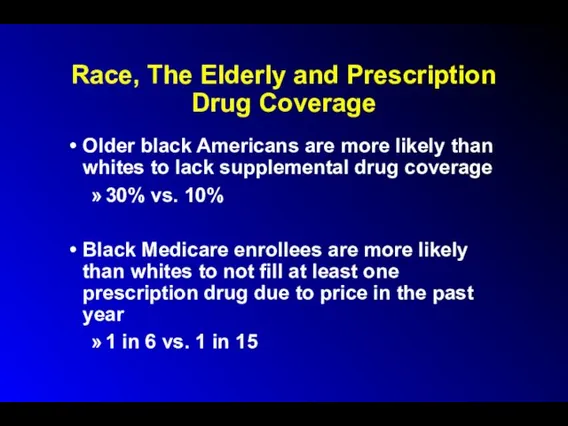
Race, The Elderly and Prescription Drug Coverage
Older black Americans are more
Race, The Elderly and Prescription Drug Coverage
Older black Americans are more
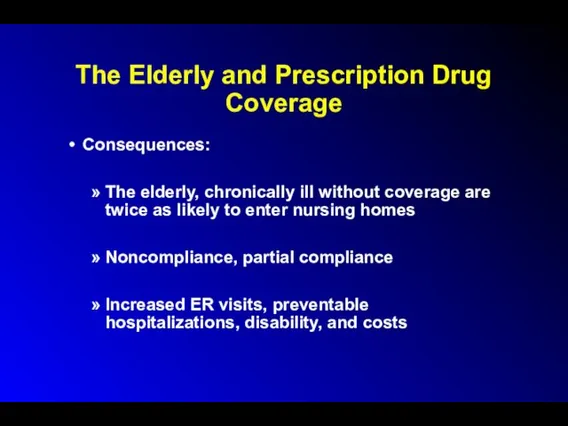
The Elderly and Prescription Drug Coverage
Consequences:
The elderly, chronically ill without coverage
The Elderly and Prescription Drug Coverage
Consequences:
The elderly, chronically ill without coverage
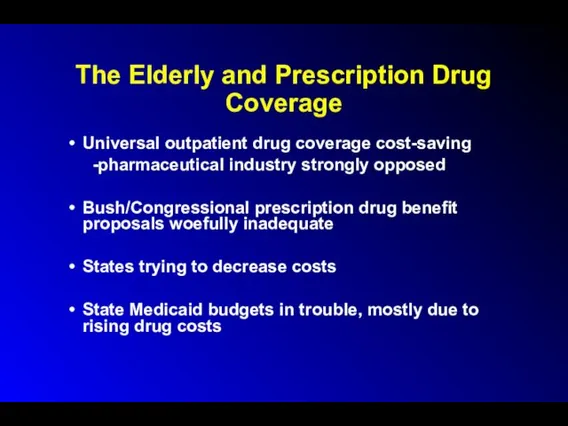
The Elderly and Prescription Drug Coverage
Universal outpatient drug coverage cost-saving
-pharmaceutical industry
The Elderly and Prescription Drug Coverage
Universal outpatient drug coverage cost-saving
-pharmaceutical industry
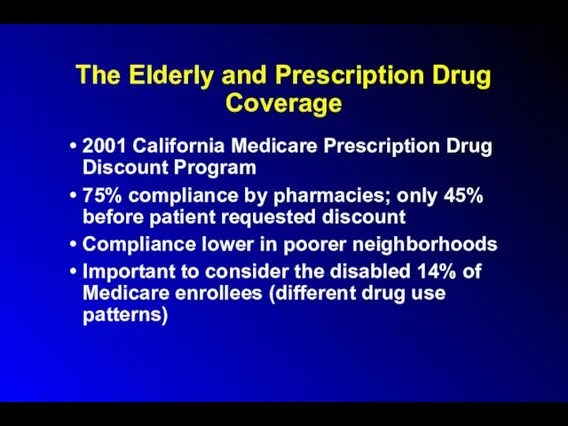
The Elderly and Prescription Drug Coverage
2001 California Medicare Prescription Drug Discount
The Elderly and Prescription Drug Coverage
2001 California Medicare Prescription Drug Discount
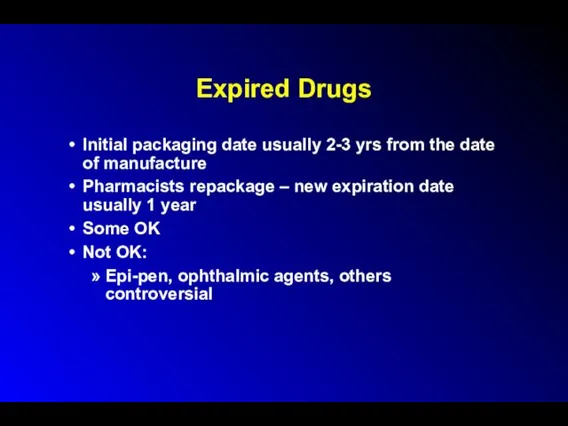
Expired Drugs
Initial packaging date usually 2-3 yrs from the date of
Expired Drugs
Initial packaging date usually 2-3 yrs from the date of
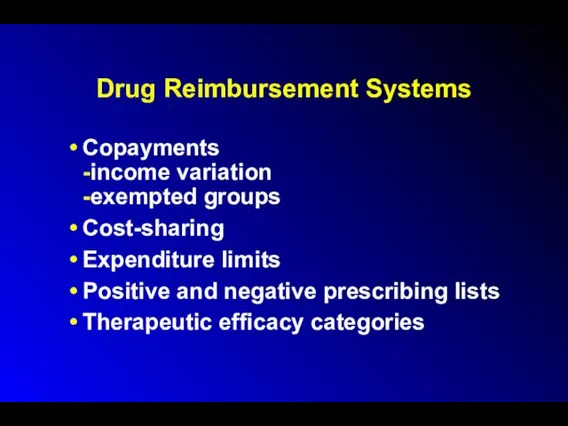
Drug Reimbursement Systems
Copayments
-income variation
-exempted groups
Cost-sharing
Expenditure limits
Positive and negative prescribing lists
Therapeutic efficacy
Drug Reimbursement Systems
Copayments
-income variation
-exempted groups
Cost-sharing
Expenditure limits
Positive and negative prescribing lists
Therapeutic efficacy
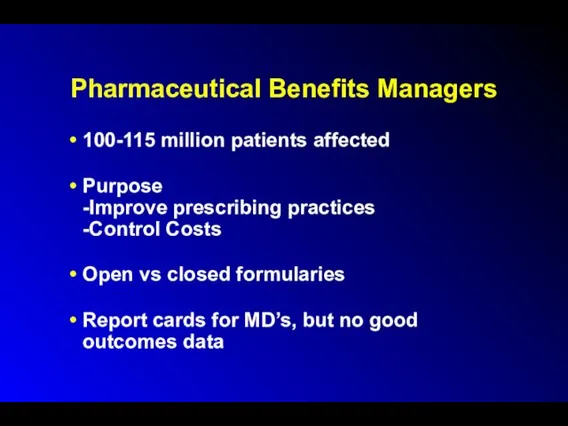
Pharmaceutical Benefits Managers
100-115 million patients affected
Purpose
-Improve prescribing practices
-Control Costs
Open vs closed
Pharmaceutical Benefits Managers
100-115 million patients affected
Purpose
-Improve prescribing practices
-Control Costs
Open vs closed
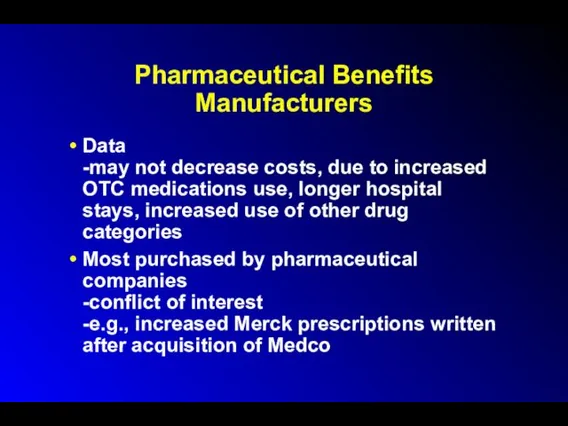
Pharmaceutical Benefits Manufacturers
Data
-may not decrease costs, due to increased OTC medications
Pharmaceutical Benefits Manufacturers
Data -may not decrease costs, due to increased OTC medications
Economics
320,000 Jobs
(45% increase over last 10 years)
Increased employment / income
(decreased
Economics
320,000 Jobs
(45% increase over last 10 years)
Increased employment / income
(decreased
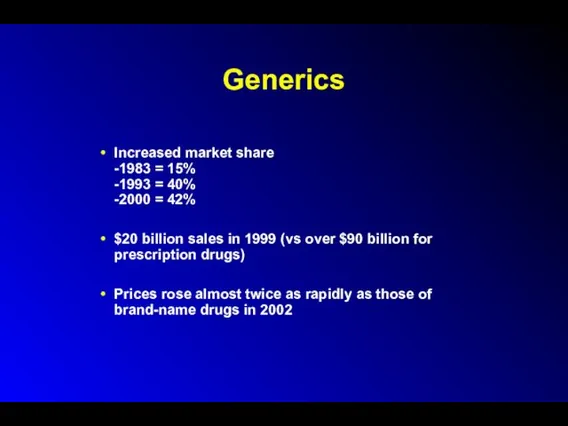
Generics
Increased market share
-1983 = 15%
-1993 = 40%
-2000 = 42%
$20 billion sales
Generics
Increased market share
-1983 = 15%
-1993 = 40%
-2000 = 42%
$20 billion sales
Generics
Avg cost $18 vs $61 for comparable name-brand drug (1999)
Doctors underestimate
Generics
Avg cost $18 vs $61 for comparable name-brand drug (1999)
Doctors underestimate
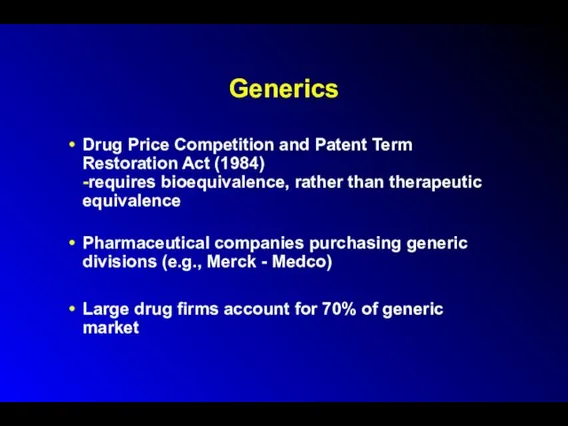
Generics
Drug Price Competition and Patent Term Restoration Act (1984)
-requires bioequivalence, rather
Generics
Drug Price Competition and Patent Term Restoration Act (1984) -requires bioequivalence, rather
Over-the-Counter Meds
Price per prescription decreases, but insurance won’t cover
Antihistamines: Claritin, Zyrtec,
Over-the-Counter Meds
Price per prescription decreases, but insurance won’t cover
Antihistamines: Claritin, Zyrtec,
Over-the-Counter Meds
OCPs
Pharmacist-prescribed emergency contraception
reduces number of unintended pregnancies
cost saving
Over-the-Counter Meds
OCPs
Pharmacist-prescribed emergency contraception
reduces number of unintended pregnancies
cost saving
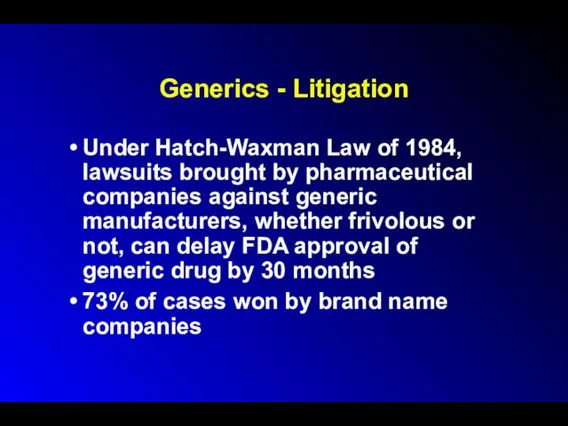
Generics - Litigation
Under Hatch-Waxman Law of 1984, lawsuits brought by pharmaceutical
Generics - Litigation
Under Hatch-Waxman Law of 1984, lawsuits brought by pharmaceutical
Generics - Litigation
Dupont Pharmaceuticals vs Barr Laboratories:
Coumadin/warfarin
Novartis vs Sangstat
Neoral/cyclosporine A
Zenith Goldline
Generics - Litigation
Dupont Pharmaceuticals vs Barr Laboratories:
Coumadin/warfarin
Novartis vs Sangstat
Neoral/cyclosporine A
Zenith Goldline
Lobbying, Patent Extensions and Alternate Formulations
Lobbying and Congressional bills
Schering Plough /
Lobbying, Patent Extensions and Alternate Formulations
Lobbying and Congressional bills
Schering Plough /
Lobbying
1998: agribusiness spent $119.3 million lobbying Congress
1998: environmental groups spent $4.7
Lobbying
1998: agribusiness spent $119.3 million lobbying Congress
1998: environmental groups spent $4.7
Lobbying
All industry = $1.2 billion/yr (not including campaign contributions and soft
Lobbying
All industry = $1.2 billion/yr (not including campaign contributions and soft
Pharmaceutical Company Advertising
$15 billion/year in 2000
over $6 billion - advertising and
Pharmaceutical Company Advertising
$15 billion/year in 2000
over $6 billion - advertising and
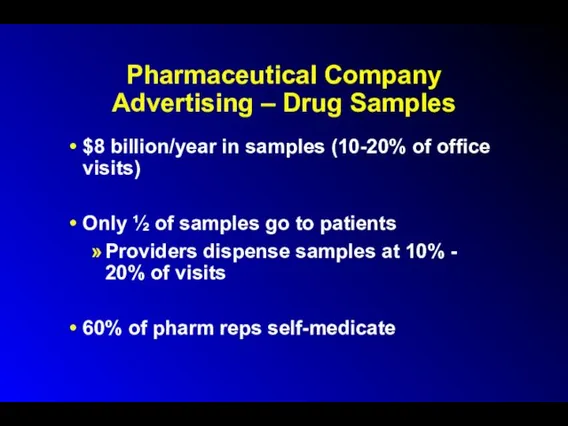
Pharmaceutical Company Advertising – Drug Samples
$8 billion/year in samples (10-20% of
Pharmaceutical Company Advertising – Drug Samples
$8 billion/year in samples (10-20% of
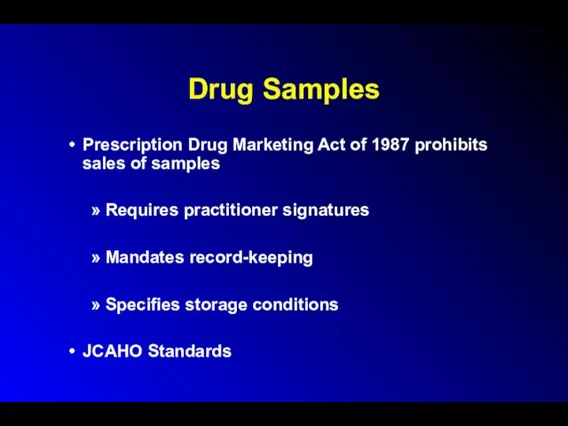
Drug Samples
Prescription Drug Marketing Act of 1987 prohibits sales of samples
Requires
Drug Samples
Prescription Drug Marketing Act of 1987 prohibits sales of samples
Requires
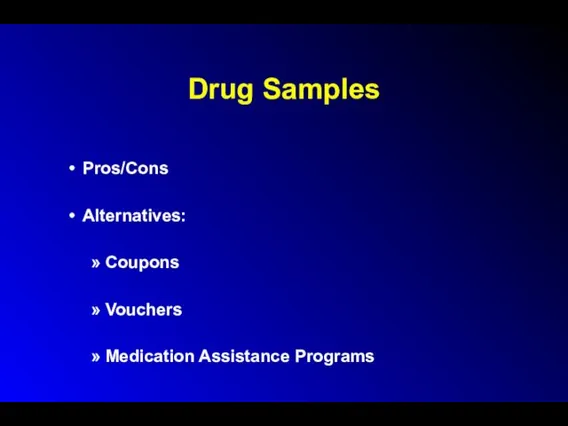
Drug Samples
Pros/Cons
Alternatives:
Coupons
Vouchers
Medication Assistance Programs
Drug Samples
Pros/Cons
Alternatives:
Coupons
Vouchers
Medication Assistance Programs
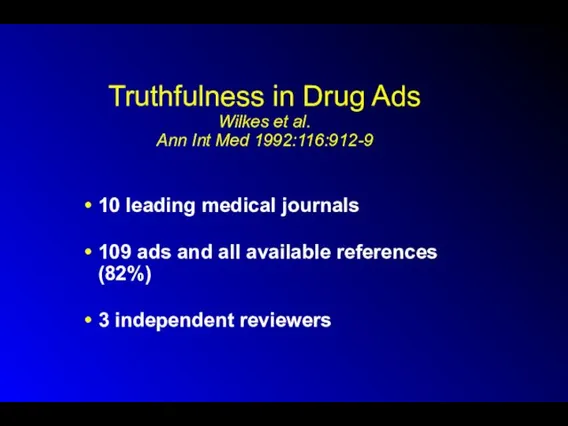
Truthfulness in Drug Ads
Wilkes et al.
Ann Int Med 1992:116:912-9
10 leading medical
Truthfulness in Drug Ads
Wilkes et al.
Ann Int Med 1992:116:912-9
10 leading medical
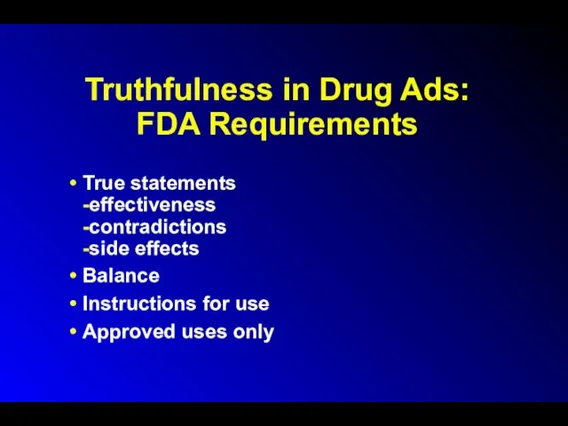
Truthfulness in Drug Ads: FDA Requirements
True statements
-effectiveness
-contradictions
-side effects
Balance
Instructions for use
Approved uses
Truthfulness in Drug Ads: FDA Requirements
True statements
-effectiveness
-contradictions
-side effects
Balance
Instructions for use
Approved uses
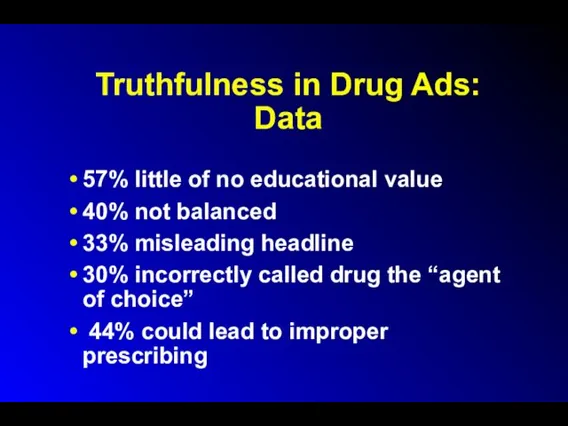
Truthfulness in Drug Ads: Data
57% little of no educational value
40%
Truthfulness in Drug Ads: Data
57% little of no educational value
40%
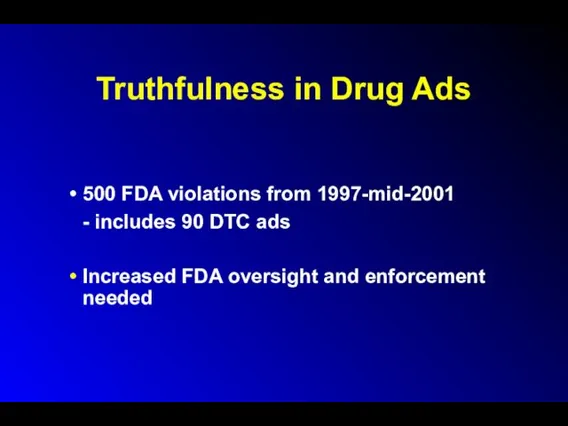
Truthfulness in Drug Ads
500 FDA violations from 1997-mid-2001
- includes 90 DTC
Truthfulness in Drug Ads
500 FDA violations from 1997-mid-2001
- includes 90 DTC
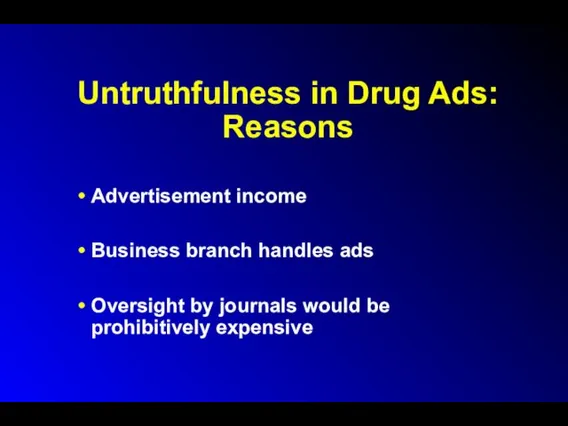
Untruthfulness in Drug Ads: Reasons
Advertisement income
Business branch handles ads
Oversight by journals
Untruthfulness in Drug Ads: Reasons
Advertisement income
Business branch handles ads
Oversight by journals
Truthfulness in Drug Ads
Higher percentage of ads misleading in Third World
Most
Truthfulness in Drug Ads
Higher percentage of ads misleading in Third World
Most
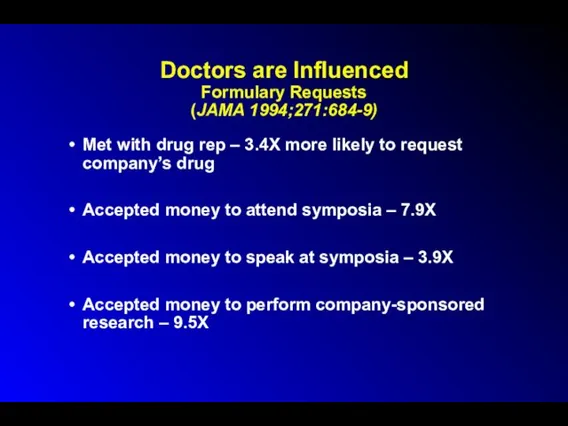
Doctors are Influenced
Formulary Requests
(JAMA 1994;271:684-9)
Met with drug rep – 3.4X more
Doctors are Influenced
Formulary Requests
(JAMA 1994;271:684-9)
Met with drug rep – 3.4X more
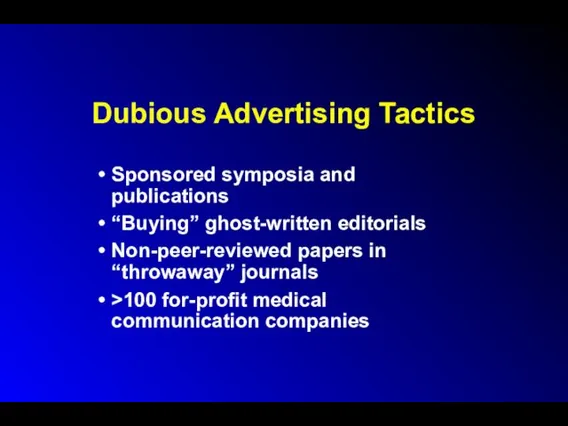
Dubious Advertising Tactics
Sponsored symposia and publications
“Buying” ghost-written editorials
Non-peer-reviewed papers in “throwaway”
Dubious Advertising Tactics
Sponsored symposia and publications
“Buying” ghost-written editorials
Non-peer-reviewed papers in “throwaway”
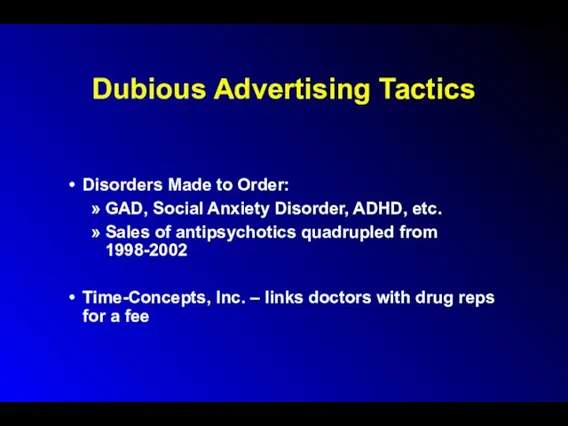
Dubious Advertising Tactics
Disorders Made to Order:
GAD, Social Anxiety Disorder, ADHD, etc.
Sales
Dubious Advertising Tactics
Disorders Made to Order:
GAD, Social Anxiety Disorder, ADHD, etc.
Sales
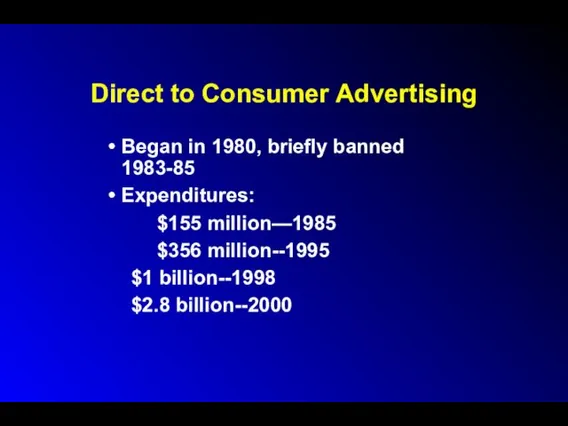
Direct to Consumer Advertising
Began in 1980, briefly banned 1983-85
Expenditures:
$155 million—1985
$356 million--1995
$1
Direct to Consumer Advertising
Began in 1980, briefly banned 1983-85
Expenditures:
$155 million—1985
$356 million--1995
$1
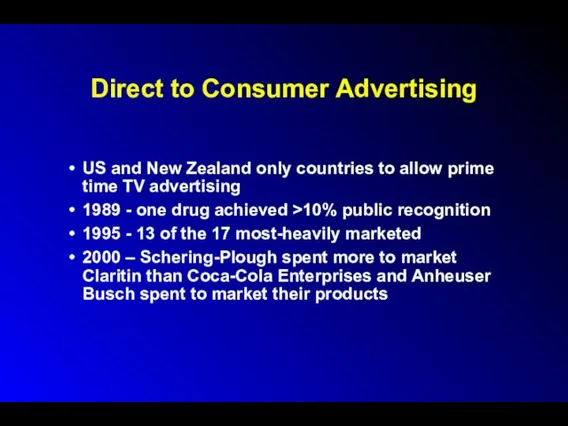
Direct to Consumer Advertising
US and New Zealand only countries to allow
Direct to Consumer Advertising
US and New Zealand only countries to allow
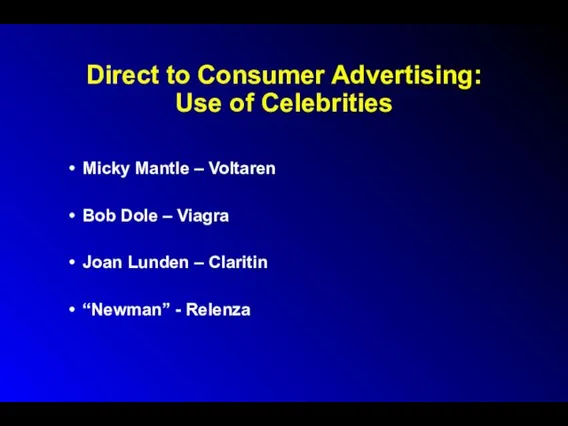
Direct to Consumer Advertising:
Use of Celebrities
Micky Mantle – Voltaren
Bob Dole –
Direct to Consumer Advertising:
Use of Celebrities
Micky Mantle – Voltaren
Bob Dole –
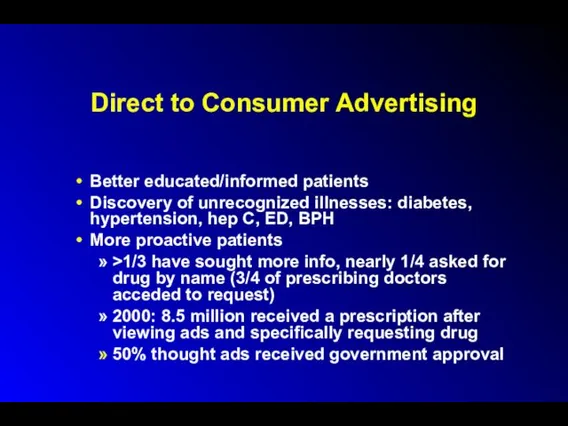
Direct to Consumer Advertising
Better educated/informed patients
Discovery of unrecognized illnesses: diabetes, hypertension,
Direct to Consumer Advertising
Better educated/informed patients
Discovery of unrecognized illnesses: diabetes, hypertension,
Direct to Consumer Advertising
Doctors more willing to prescribe requested agents
Violations
20
Direct to Consumer Advertising
Doctors more willing to prescribe requested agents
Violations
20
Direct to Consumer Advertising
Pfizer fined $6 million for TV ads extolling
Direct to Consumer Advertising
Pfizer fined $6 million for TV ads extolling
Direct to Consumer Advertising
Manufacturers must disclose all known and reasonably knowable
Direct to Consumer Advertising
Manufacturers must disclose all known and reasonably knowable
Direct to Consumer Advertising of Genetic Tests
HER2 protein: breast cancer
BRCA-1 and
Direct to Consumer Advertising of Genetic Tests
HER2 protein: breast cancer
BRCA-1 and
Direct to Consumer Advertising of Genetic Tests
Overstate the value of genetic
Direct to Consumer Advertising of Genetic Tests
Overstate the value of genetic
Direct to Consumer Advertising of Genetic Tests
Inappropriate:
Public has limited sophistication regarding
Direct to Consumer Advertising of Genetic Tests
Inappropriate:
Public has limited sophistication regarding
Direct to Consumer Marketing of High-Tech Screening Tests
E.g., Electron-beam CT /
Direct to Consumer Marketing of High-Tech Screening Tests
E.g., Electron-beam CT /
Sources of Accurate and Reliable Drug Information
The Medical Letter
Peer-reviewed
Sources of Accurate and Reliable Drug Information
The Medical Letter
Peer-reviewed
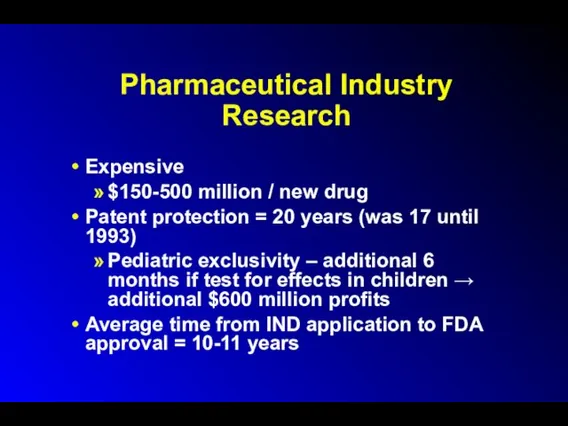
Pharmaceutical Industry Research
Expensive
$150-500 million / new drug
Patent protection = 20
Pharmaceutical Industry Research
Expensive
$150-500 million / new drug
Patent protection = 20
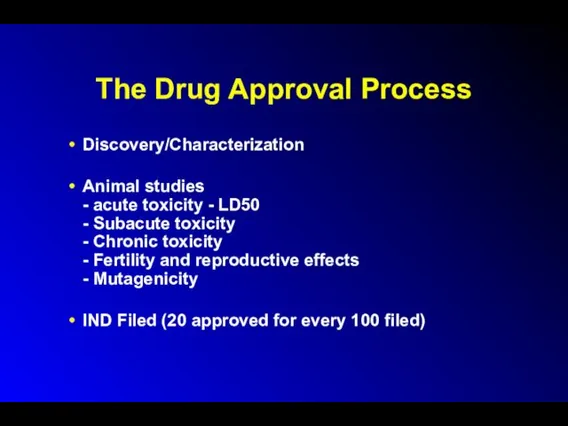
The Drug Approval Process
Discovery/Characterization
Animal studies
- acute toxicity - LD50
- Subacute toxicity
-
The Drug Approval Process
Discovery/Characterization
Animal studies
- acute toxicity - LD50
- Subacute toxicity
-
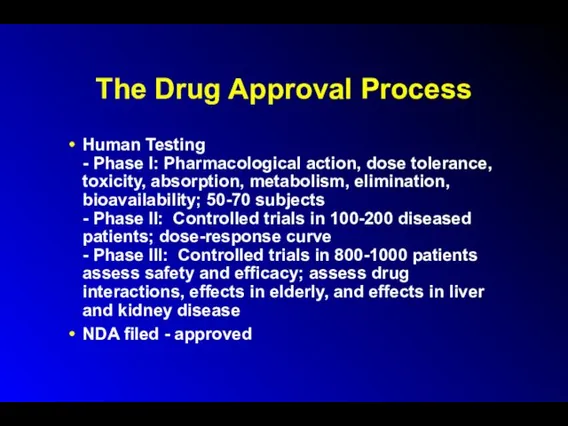
The Drug Approval Process
Human Testing
- Phase I: Pharmacological action, dose tolerance,
The Drug Approval Process
Human Testing - Phase I: Pharmacological action, dose tolerance,
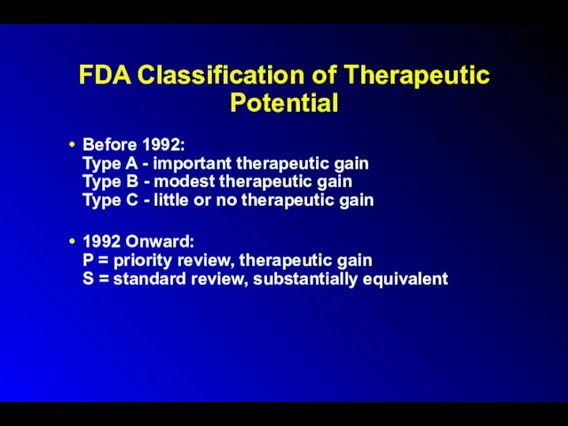
FDA Classification of Therapeutic Potential
Before 1992:
Type A - important therapeutic gain
Type
FDA Classification of Therapeutic Potential
Before 1992: Type A - important therapeutic gain Type
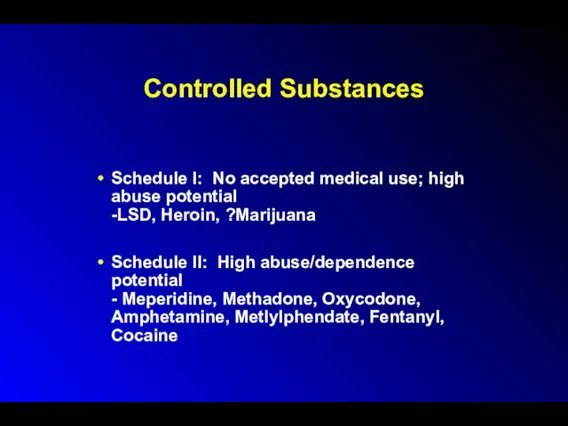
Controlled Substances
Schedule I: No accepted medical use; high abuse potential
-LSD, Heroin,
Controlled Substances
Schedule I: No accepted medical use; high abuse potential
-LSD, Heroin,
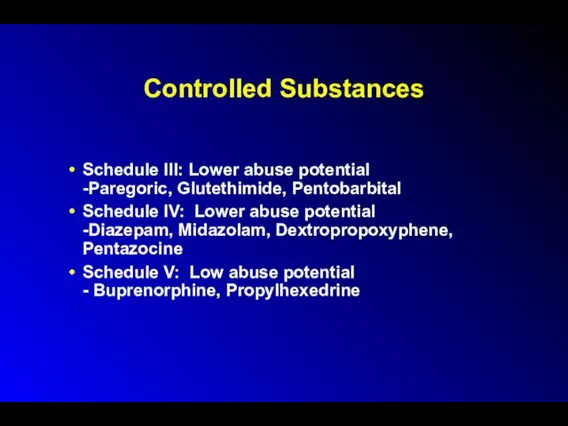
Controlled Substances
Schedule III: Lower abuse potential
-Paregoric, Glutethimide, Pentobarbital
Schedule IV: Lower abuse
Controlled Substances
Schedule III: Lower abuse potential
-Paregoric, Glutethimide, Pentobarbital
Schedule IV: Lower abuse
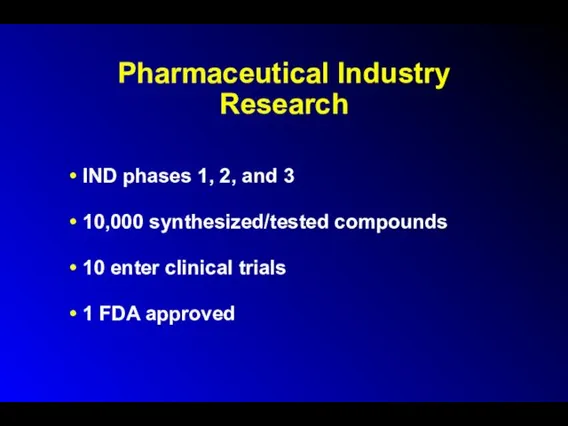
Pharmaceutical Industry Research
IND phases 1, 2, and 3
10,000 synthesized/tested compounds
10 enter
Pharmaceutical Industry Research
IND phases 1, 2, and 3
10,000 synthesized/tested compounds
10 enter
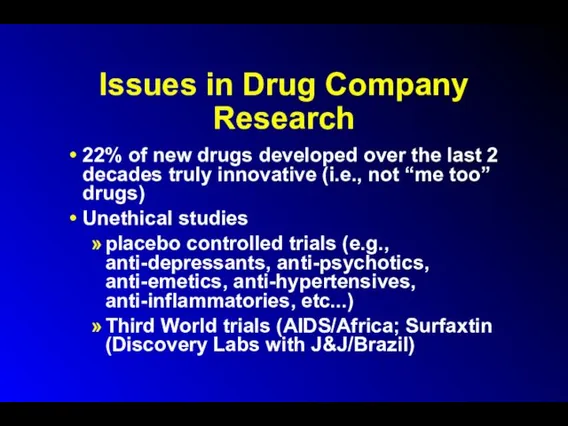
Issues in Drug Company Research
22% of new drugs developed over the
Issues in Drug Company Research
22% of new drugs developed over the
Seeding Trials
Sponsored by sales and marketing dept., rather than research
Seeding Trials
Sponsored by sales and marketing dept., rather than research
Seeding Trials
Up to 25% of patients enrolled in clinical trials
Disproportionate amount
Seeding Trials
Up to 25% of patients enrolled in clinical trials
Disproportionate amount
Issues in Drug Company Research
Species extinction/loss of biodiversity
Taxol- Yew tree
Indigenous peoples’
Issues in Drug Company Research
Species extinction/loss of biodiversity
Taxol- Yew tree
Indigenous peoples’
Issues in Drug Company Research
Novel therapeutic agents vs. copycat drugs
Methodological Flaws
Study
Issues in Drug Company Research
Novel therapeutic agents vs. copycat drugs
Methodological Flaws
Study
Issues in Drug Company Research
Methodological Flaws (cont.)
economic analyses not performed
therapeutic benefit
Issues in Drug Company Research
Methodological Flaws (cont.)
economic analyses not performed
therapeutic benefit
Issues in Drug Company Research
60% of industry-sponsored trials are contracted out
Issues in Drug Company Research
60% of industry-sponsored trials are contracted out
Issues in Drug Company Research
Symposia
Many are drug-company sponsored
More likely to have
Issues in Drug Company Research
Symposia
Many are drug-company sponsored
More likely to have
Non-Compliance
Short term = 20%
Long term (CHF, DM, TB) = 40-60%
Long term
Non-Compliance
Short term = 20% Long term (CHF, DM, TB) = 40-60% Long term
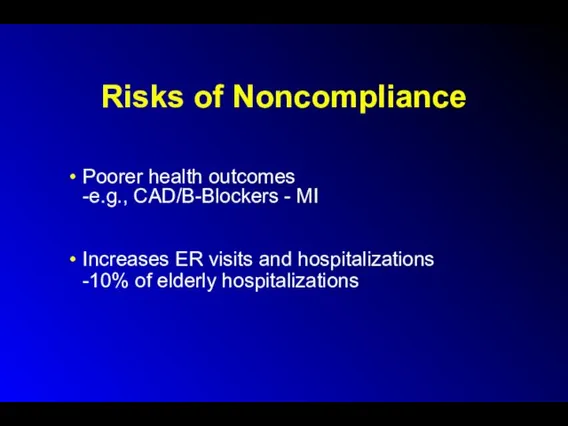
Risks of Noncompliance
Poorer health outcomes
-e.g., CAD/B-Blockers - MI
Increases ER visits and
Risks of Noncompliance
Poorer health outcomes
-e.g., CAD/B-Blockers - MI
Increases ER visits and
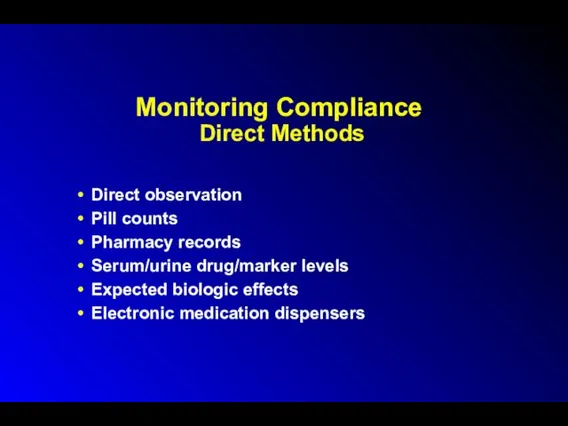
Monitoring Compliance
Direct Methods
Direct observation
Pill counts
Pharmacy records
Serum/urine drug/marker levels
Expected biologic effects
Electronic
Monitoring Compliance
Direct Methods
Direct observation
Pill counts
Pharmacy records
Serum/urine drug/marker levels
Expected biologic effects
Electronic
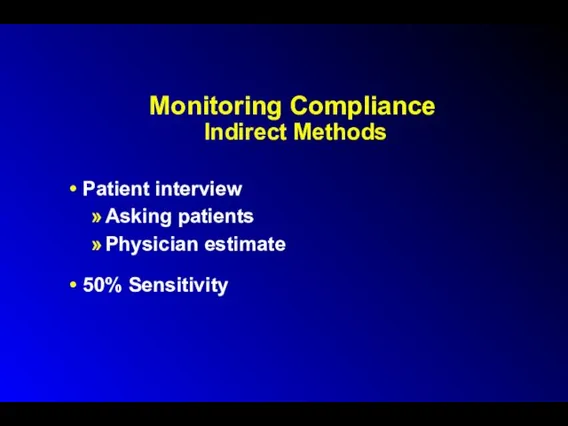
Monitoring Compliance
Indirect Methods
Patient interview
Asking patients
Physician estimate
50% Sensitivity
Monitoring Compliance
Indirect Methods
Patient interview
Asking patients
Physician estimate
50% Sensitivity
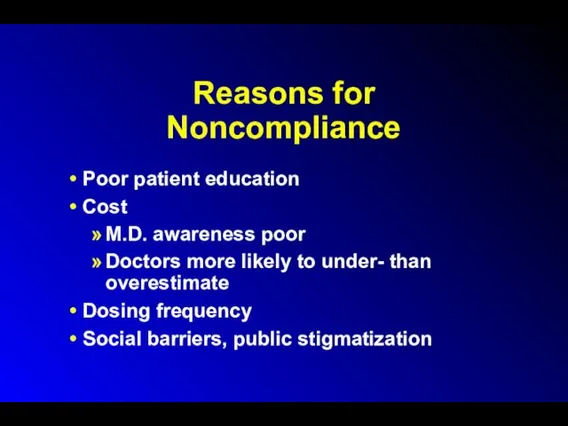
Reasons for
Noncompliance
Poor patient education
Cost
M.D. awareness poor
Doctors more likely to under-
Reasons for
Noncompliance
Poor patient education
Cost
M.D. awareness poor
Doctors more likely to under-
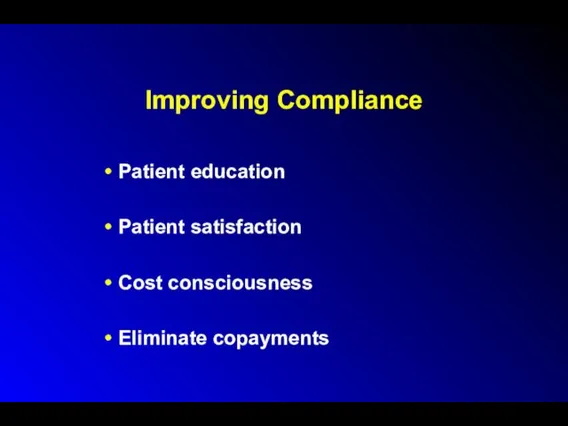
Improving Compliance
Patient education
Patient satisfaction
Cost consciousness
Eliminate copayments
Improving Compliance
Patient education
Patient satisfaction
Cost consciousness
Eliminate copayments
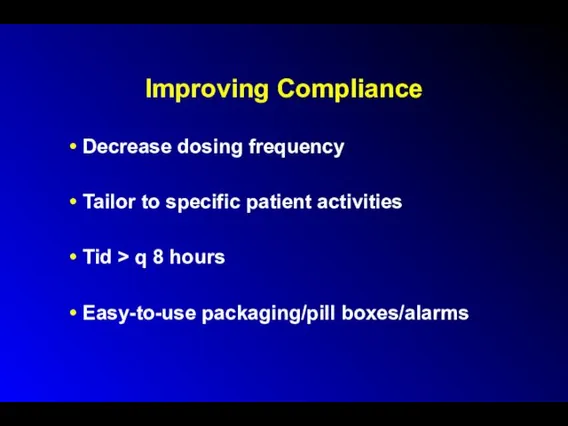
Improving Compliance
Decrease dosing frequency
Tailor to specific patient activities
Tid > q
Improving Compliance
Decrease dosing frequency
Tailor to specific patient activities
Tid > q
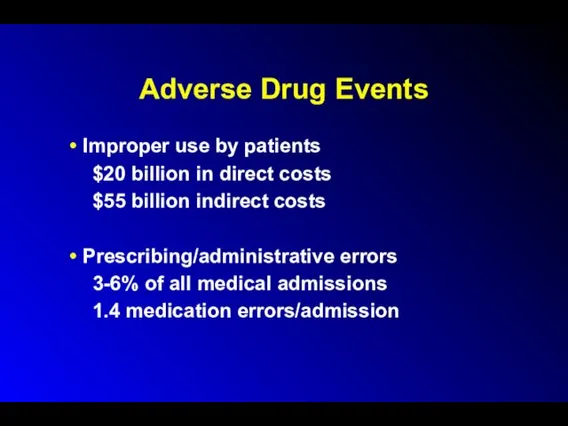
Adverse Drug Events
Improper use by patients
$20 billion in direct costs
$55 billion
Adverse Drug Events
Improper use by patients
$20 billion in direct costs
$55 billion
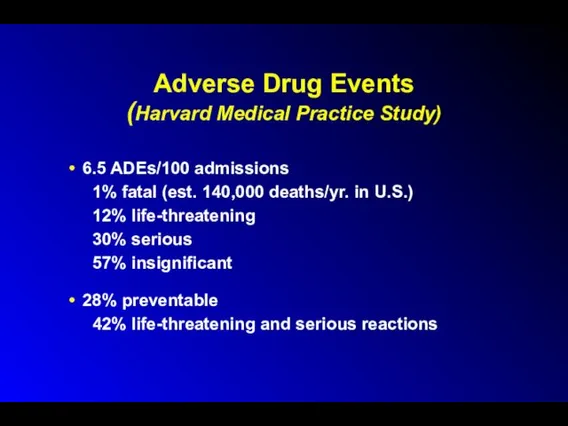
Adverse Drug Events
(Harvard Medical Practice Study)
6.5 ADEs/100 admissions
1% fatal (est. 140,000
Adverse Drug Events
(Harvard Medical Practice Study)
6.5 ADEs/100 admissions
1% fatal (est. 140,000
Adverse Drug Events
Error occurred at:
-Ordering - 56%
-Administration - 34%
-Transcription - 6%
-Dispensing
Adverse Drug Events
Error occurred at:
-Ordering - 56%
-Administration - 34%
-Transcription - 6%
-Dispensing
Adverse Drug Events
Analgesics, sedatives, antipsychotics most commonly misused
Pharmacoepidemiology/post-marketing surveillance
Chloramphenicol - blood
Adverse Drug Events
Analgesics, sedatives, antipsychotics most commonly misused
Pharmacoepidemiology/post-marketing surveillance
Chloramphenicol - blood
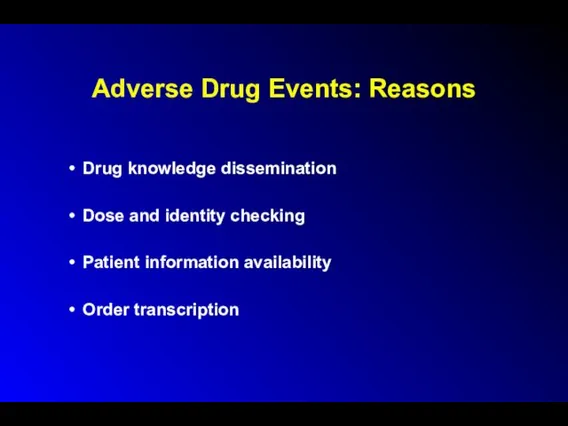
Drug knowledge dissemination
Dose and identity checking
Patient information availability
Order transcription
Adverse Drug Events:
Dose and identity checking
Patient information availability
Order transcription
Adverse Drug Events:
Adverse Drug Events: Reasons
Allergy missed / not noted
Medication order tracking
Interservice communication
Change
Adverse Drug Events: Reasons
Allergy missed / not noted
Medication order tracking
Interservice communication
Change
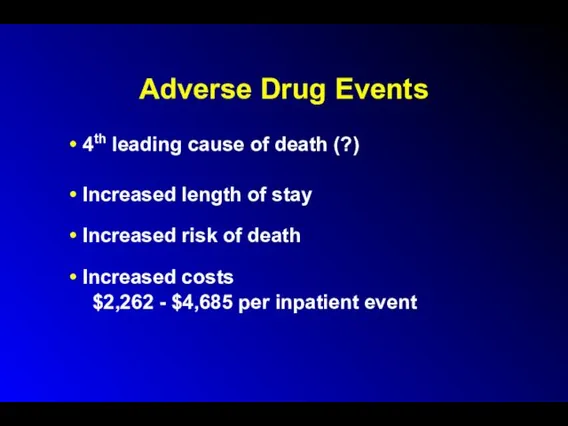
Adverse Drug Events
4th leading cause of death (?)
Increased length of stay
Increased
Adverse Drug Events
4th leading cause of death (?)
Increased length of stay
Increased
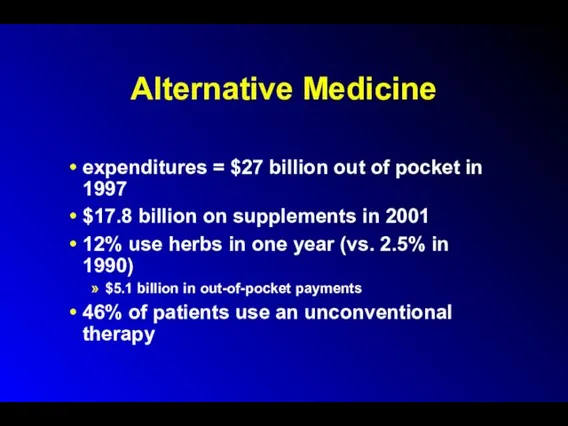
Alternative Medicine
expenditures = $27 billion out of pocket in 1997
$17.8 billion
Alternative Medicine
expenditures = $27 billion out of pocket in 1997
$17.8 billion
Alternative Medicine
Between 1996 and 1998, 8% of normal-weight women and 28%
Alternative Medicine
Between 1996 and 1998, 8% of normal-weight women and 28%
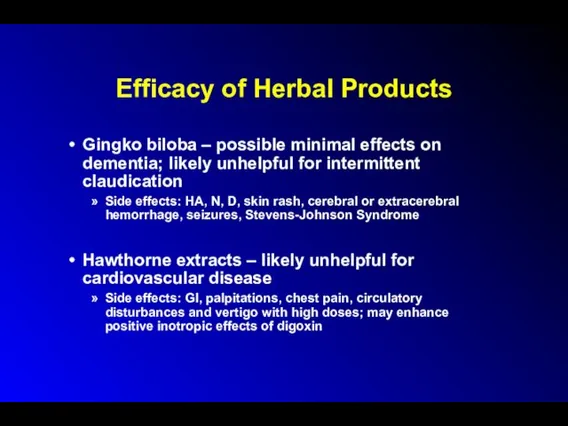
Efficacy of Herbal Products
Gingko biloba – possible minimal effects on dementia;
Efficacy of Herbal Products
Gingko biloba – possible minimal effects on dementia;
Efficacy of Herbal Products
Saw palmetto – possible mild decrease in BPH
Efficacy of Herbal Products
Saw palmetto – possible mild decrease in BPH
Risks Of Herbal And “Naturopathic” Remedies
Manufacturer may claim that the product
Risks Of Herbal And “Naturopathic” Remedies
Manufacturer may claim that the product
Risks Of Herbal And “Naturopathic” Remedies
Products unregulated/untested
Variable
collection
processing
storage
naming
purity
Risks Of Herbal And “Naturopathic” Remedies
Products unregulated/untested
Variable
collection
processing
storage
naming
purity
Risks Of Herbal And “Naturopathic” Remedies
Adulterants and contaminants include:
Botanicals – e.g.,
Risks Of Herbal And “Naturopathic” Remedies
Adulterants and contaminants include:
Botanicals – e.g.,
Risks Of Herbal And “Naturopathic” Remedies
Est. less than 1% of adverse
Risks Of Herbal And “Naturopathic” Remedies
Est. less than 1% of adverse
Risks of Herbal and “Naturopathic” Remedies
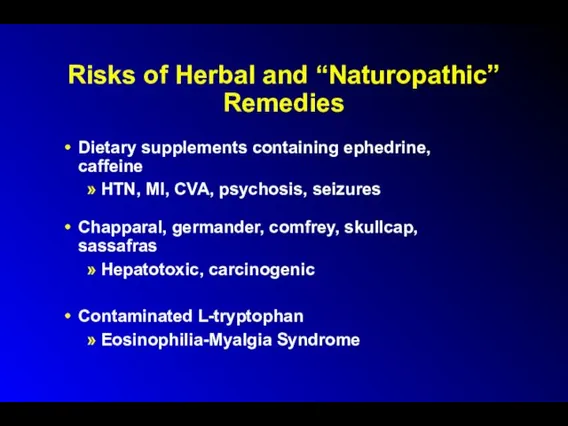
Dietary supplements containing ephedrine, caffeine
HTN, MI,
Risks of Herbal and “Naturopathic” Remedies
Dietary supplements containing ephedrine, caffeine
HTN, MI,
Risks of Herbal and “Naturopathic” Remedies
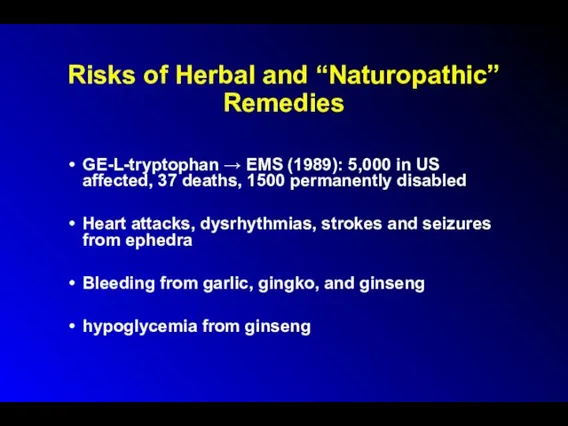
GE-L-tryptophan → EMS (1989): 5,000 in
Risks of Herbal and “Naturopathic” Remedies
GE-L-tryptophan → EMS (1989): 5,000 in
Risks of Herbal and “Naturopathic” Remedies
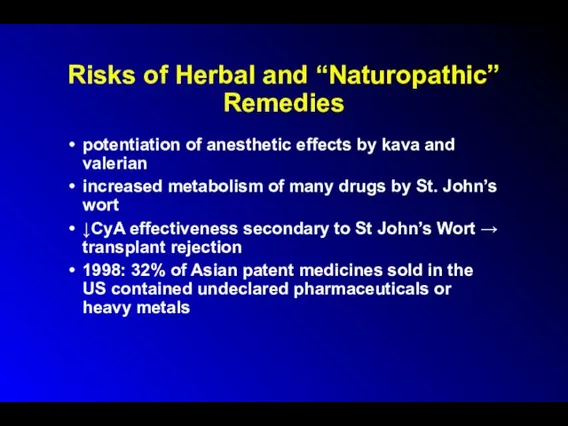
potentiation of anesthetic effects by kava
Risks of Herbal and “Naturopathic” Remedies
potentiation of anesthetic effects by kava
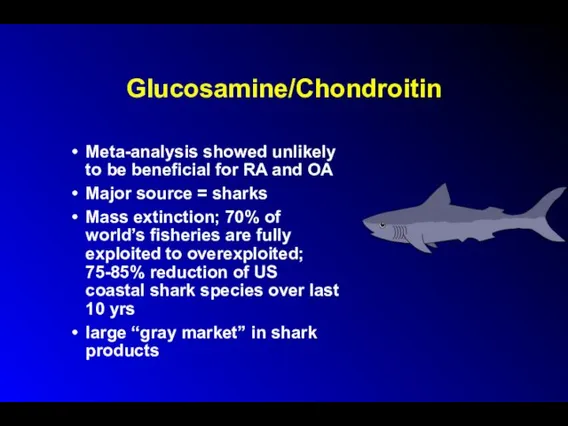
Glucosamine/Chondroitin
Meta-analysis showed unlikely to be beneficial for RA and OA
Major source
Glucosamine/Chondroitin
Meta-analysis showed unlikely to be beneficial for RA and OA
Major source
Pet Pharmaceuticals
$3 billion market
Clonicalm (clomipramine) for separation anxiety in dogs
Anipryl (seligeline)
Pet Pharmaceuticals
$3 billion market
Clonicalm (clomipramine) for separation anxiety in dogs
Anipryl (seligeline)
Blurring the line between drugs and cosmetics
1999 spending on cosmetics:
Hair care
Blurring the line between drugs and cosmetics
1999 spending on cosmetics:
Hair care
Botox
Botulinum toxin:
Cause of botulism
potential biowarfare/bioterror agent
Medical Uses: blepharospasm, spasmodic torticollis, certain
Botox
Botulinum toxin:
Cause of botulism
potential biowarfare/bioterror agent
Medical Uses: blepharospasm, spasmodic torticollis, certain
Botox
Manufacturer = Allergan
1.6 million patients, $309.5 million sales ($100 million for
Botox
Manufacturer = Allergan
1.6 million patients, $309.5 million sales ($100 million for
Botox
Most users white, age 35-50
12% are men
In-home Botox parties; Botox scams
Hollywood
Botox
Most users white, age 35-50
12% are men
In-home Botox parties; Botox scams
Hollywood
Botox
Retreatments required q 3-4 months
Side effects: masklike facies, slackness and drooling,
Botox
Retreatments required q 3-4 months
Side effects: masklike facies, slackness and drooling,
Under- and overuse of antibiotics
MDR TB in Russian prisons
bronchitis and viral
Under- and overuse of antibiotics
MDR TB in Russian prisons
bronchitis and viral
Factory Farms, Antibiotics and Anthrax:
Putting Profits Before Public Health
Martin Donohoe, MD,
Factory Farms, Antibiotics and Anthrax:
Putting Profits Before Public Health
Martin Donohoe, MD,

Outline
Factory Farming
Agricultural Antibiotics
Cipro and Anthrax
Bayer
Conclusions
Outline
Factory Farming
Agricultural Antibiotics
Cipro and Anthrax
Bayer
Conclusions
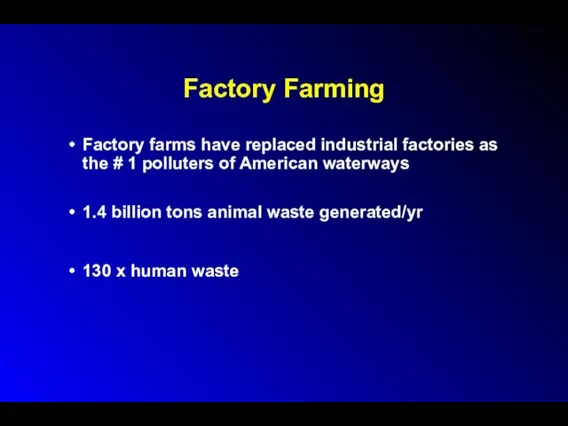
Factory Farming
Factory farms have replaced industrial factories as the # 1
Factory Farming
Factory farms have replaced industrial factories as the # 1
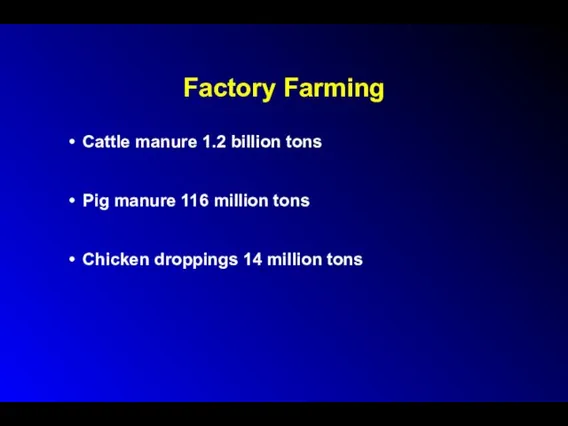
Factory Farming
Cattle manure 1.2 billion tons
Pig manure 116 million tons
Chicken droppings
Factory Farming
Cattle manure 1.2 billion tons
Pig manure 116 million tons
Chicken droppings
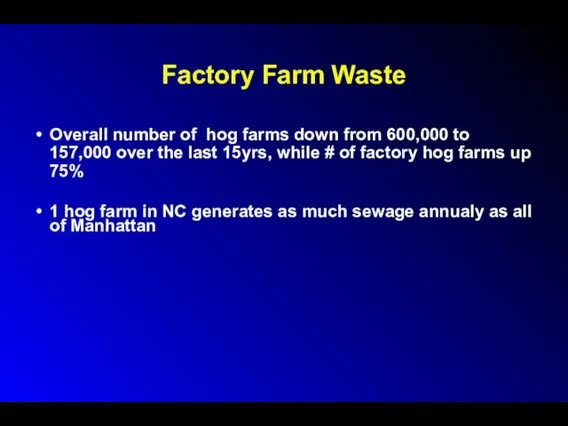
Factory Farm Waste
Overall number of hog farms down from 600,000 to
Factory Farm Waste
Overall number of hog farms down from 600,000 to
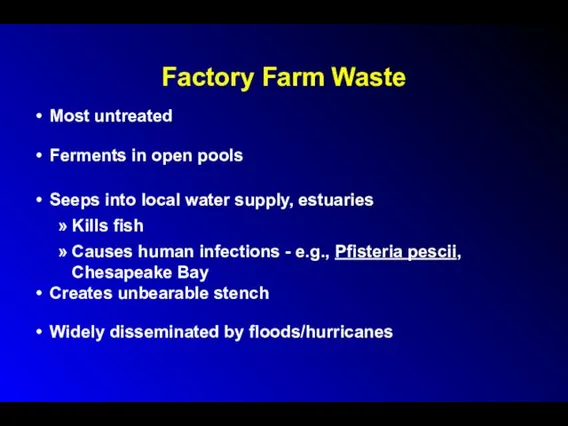
Factory Farm Waste
Most untreated
Ferments in open pools
Seeps into local water supply,
Factory Farm Waste
Most untreated
Ferments in open pools
Seeps into local water supply,
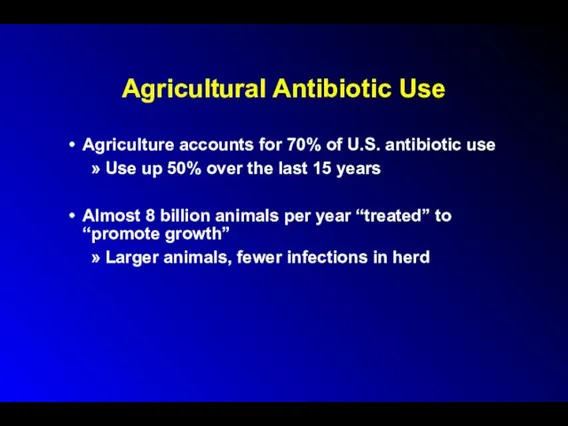
Agricultural Antibiotic Use
Agriculture accounts for 70% of U.S. antibiotic use
Use up
Agricultural Antibiotic Use
Agriculture accounts for 70% of U.S. antibiotic use
Use up
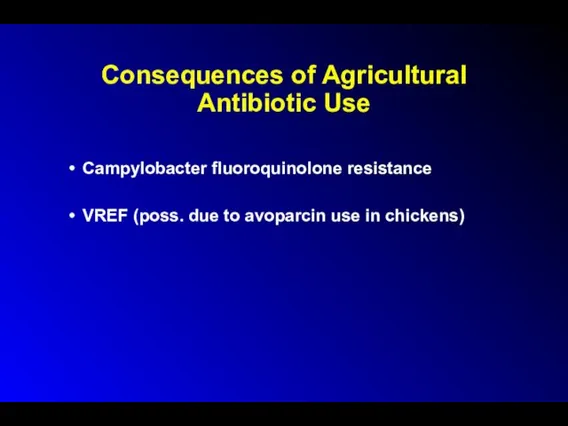
Consequences of Agricultural Antibiotic Use
Campylobacter fluoroquinolone resistance
VREF (poss. due to avoparcin
Consequences of Agricultural Antibiotic Use
Campylobacter fluoroquinolone resistance
VREF (poss. due to avoparcin
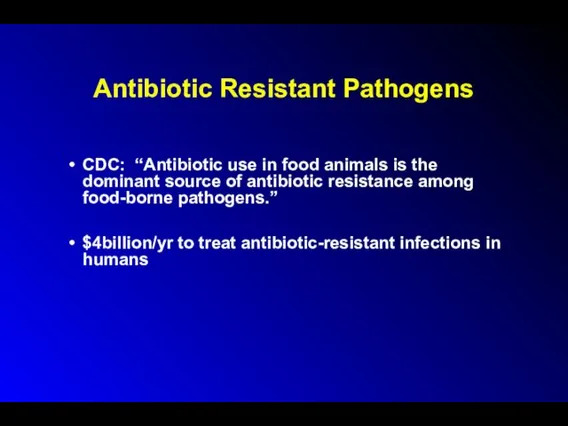
Antibiotic Resistant Pathogens
CDC: “Antibiotic use in food animals is the dominant
Antibiotic Resistant Pathogens
CDC: “Antibiotic use in food animals is the dominant
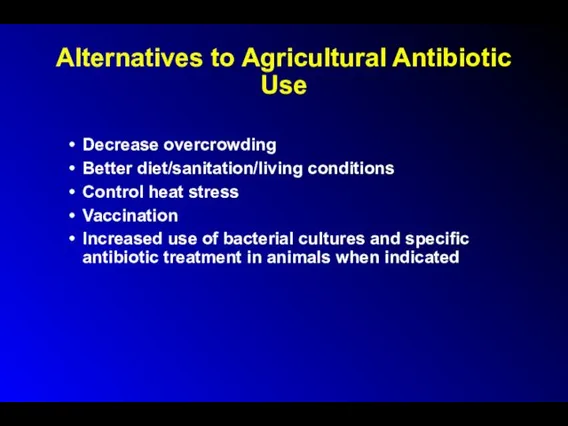
Alternatives to Agricultural Antibiotic Use
Decrease overcrowding
Better diet/sanitation/living conditions
Control heat stress
Vaccination
Increased use
Alternatives to Agricultural Antibiotic Use
Decrease overcrowding
Better diet/sanitation/living conditions
Control heat stress
Vaccination
Increased use
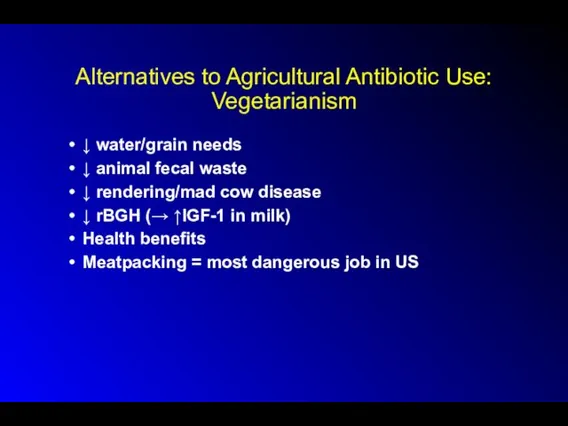
Alternatives to Agricultural Antibiotic Use: Vegetarianism
↓ water/grain needs
↓ animal fecal waste
↓
Alternatives to Agricultural Antibiotic Use: Vegetarianism
↓ water/grain needs
↓ animal fecal waste
↓
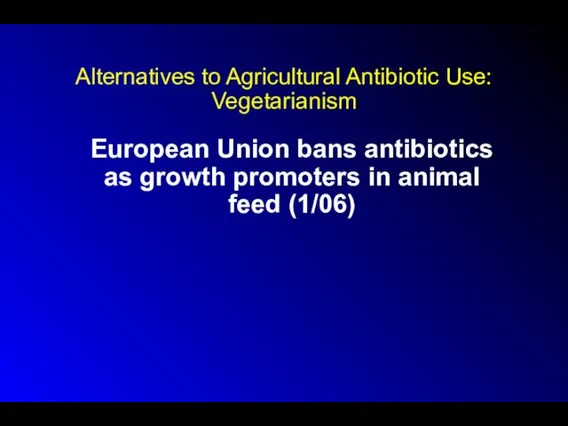
Alternatives to Agricultural Antibiotic Use: Vegetarianism
European Union bans antibiotics as growth
Alternatives to Agricultural Antibiotic Use: Vegetarianism
European Union bans antibiotics as growth
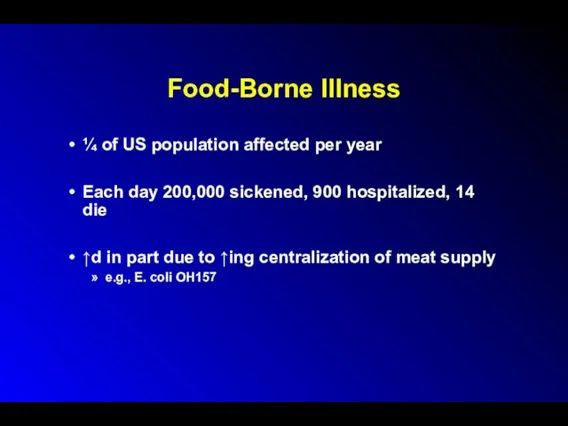
Food-Borne Illness
¼ of US population affected per year
Each day 200,000 sickened,
Food-Borne Illness
¼ of US population affected per year
Each day 200,000 sickened,
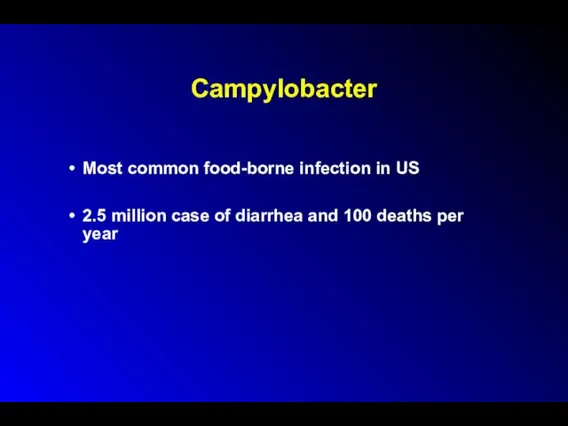
Campylobacter
Most common food-borne infection in US
2.5 million case of diarrhea and
Campylobacter
Most common food-borne infection in US
2.5 million case of diarrhea and
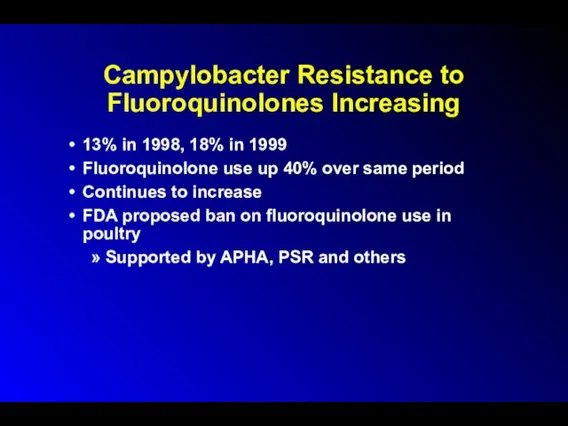
Campylobacter Resistance to Fluoroquinolones Increasing
13% in 1998, 18% in 1999
Fluoroquinolone use
Campylobacter Resistance to Fluoroquinolones Increasing
13% in 1998, 18% in 1999
Fluoroquinolone use
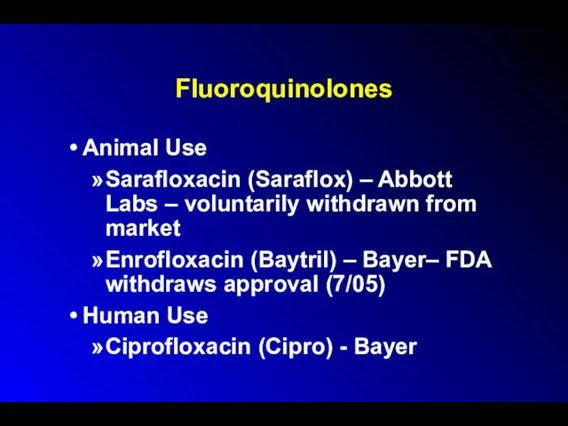
Fluoroquinolones
Animal Use
Sarafloxacin (Saraflox) – Abbott Labs – voluntarily withdrawn from market
Enrofloxacin
Fluoroquinolones
Animal Use
Sarafloxacin (Saraflox) – Abbott Labs – voluntarily withdrawn from market
Enrofloxacin
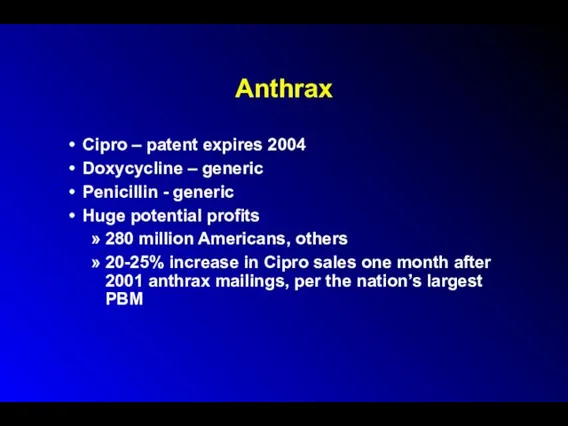
Anthrax
Cipro – patent expires 2004
Doxycycline – generic
Penicillin - generic
Huge potential profits
280
Anthrax
Cipro – patent expires 2004
Doxycycline – generic
Penicillin - generic
Huge potential profits
280
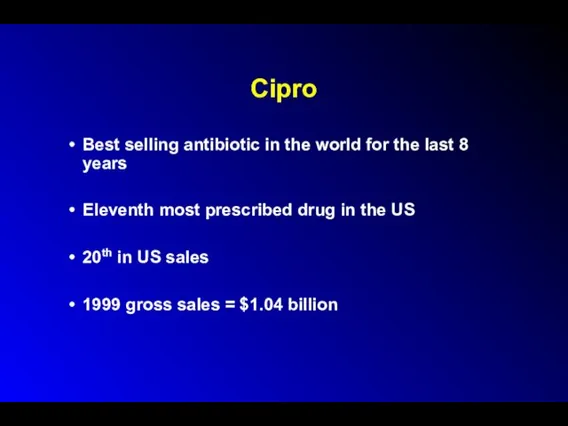
Cipro
Best selling antibiotic in the world for the last 8 years
Eleventh
Cipro
Best selling antibiotic in the world for the last 8 years
Eleventh
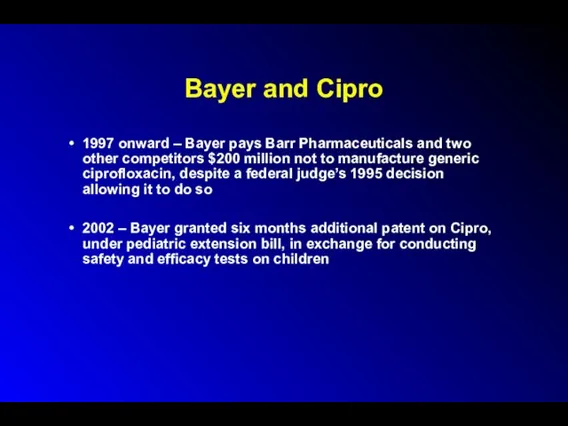
Bayer and Cipro
1997 onward – Bayer pays Barr Pharmaceuticals and two
Bayer and Cipro
1997 onward – Bayer pays Barr Pharmaceuticals and two
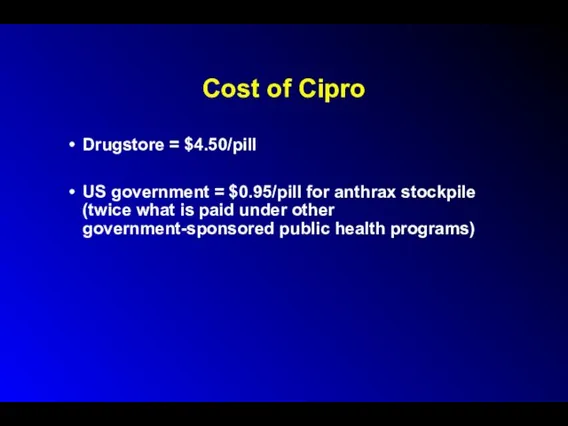
Cost of Cipro
Drugstore = $4.50/pill
US government = $0.95/pill for anthrax stockpile
Cost of Cipro
Drugstore = $4.50/pill
US government = $0.95/pill for anthrax stockpile
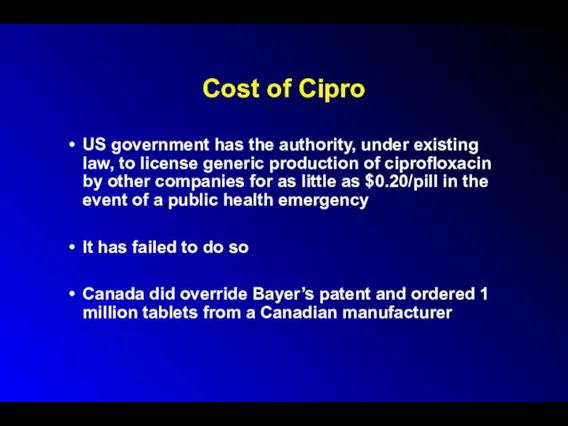
Cost of Cipro
US government has the authority, under existing law, to
Cost of Cipro
US government has the authority, under existing law, to
Why?
Weakening of case at WTO meetings that the massive suffering consequent
Why?
Weakening of case at WTO meetings that the massive suffering consequent
Other Consequences
Opens door to other situations involving parallel importing and compulsory
Other Consequences
Opens door to other situations involving parallel importing and compulsory
Bayer
Based in Leverkusen, Germany
120,000 employees worldwide
Annual sales = $28 billion
US =
Bayer
Based in Leverkusen, Germany
120,000 employees worldwide
Annual sales = $28 billion
US =
Bayer
Pharmaceuticals
Third largest manufacturer of herbicides in the world
Dominates insecticide market
Bayer
Pharmaceuticals
Third largest manufacturer of herbicides in the world
Dominates insecticide market
Bayer
Number one biotech company in Europe (after 2001 purchase of Aventis
Bayer
Number one biotech company in Europe (after 2001 purchase of Aventis
History of Bayer
WW I: invented modern chemical warfare; developed “School for
History of Bayer
WW I: invented modern chemical warfare; developed “School for
History of Bayer
Early 1990s – admitted knowingly selling HIV-tainted blood clotting
History of Bayer
Early 1990s – admitted knowingly selling HIV-tainted blood clotting
History of Bayer
1995 onward - failed to follow promise to withdraw
History of Bayer
1995 onward - failed to follow promise to withdraw
History of Bayer
1998 –pays Scottish adult volunteers $750 to swallow doses
History of Bayer
1998 –pays Scottish adult volunteers $750 to swallow doses
History of Bayer
2000 – fined by OSHA for workplace safety violations
History of Bayer
2000 – fined by OSHA for workplace safety violations
History of Bayer
2001 – FDA-reported violations in quality control contribute to
History of Bayer
2001 – FDA-reported violations in quality control contribute to
Bayer’s Corporate Agenda
Bluewash: signatory to UN’s Global Compact
Greenwash: “crop protection” (pesticides)
Promotion
Bayer’s Corporate Agenda
Bluewash: signatory to UN’s Global Compact
Greenwash: “crop protection” (pesticides)
Promotion
Bayer’s Corporate Agenda
Corporate Front Groups: “Global Crop Protection Federation”
Harrassment / SLAPP
Bayer’s Corporate Agenda
Corporate Front Groups: “Global Crop Protection Federation”
Harrassment / SLAPP
Bayer’s Corporate Agenda
Lobbying / Campaign donations / Influence peddling:
Member of numerous
Bayer’s Corporate Agenda
Lobbying / Campaign donations / Influence peddling:
Member of numerous
Bayer
Fortune Magazine (2001): one of the “most admired companies” in the
Bayer
Fortune Magazine (2001): one of the “most admired companies” in the
Conclusions
Triumph of corporate profits and influence-peddling over urgent public health needs
Stronger
Conclusions
Triumph of corporate profits and influence-peddling over urgent public health needs
Stronger
Frankenfoods
(aka “Brave New Foods”)
Genetically-engineered seeds are now being used to
Frankenfoods
(aka “Brave New Foods”)
Genetically-engineered seeds are now being used to
Frankenfoods
Bacillus thuringiensis corn - resistant to the corn-boring bug, but pollen
Frankenfoods
Bacillus thuringiensis corn - resistant to the corn-boring bug, but pollen
Frankenfoods
FDA being sued for allowing genetically-engineered foods on the market without
Frankenfoods
FDA being sued for allowing genetically-engineered foods on the market without
Excessive Paper Packaging in Pharmaceutical Samples
Paper packaging 39% of US garbage;
Excessive Paper Packaging in Pharmaceutical Samples
Paper packaging 39% of US garbage;
The History of U.S. Drug Regulation
1785: Massachusetts - first food
The History of U.S. Drug Regulation
1785: Massachusetts - first food
The History of Drug Regulation
1906: Pure Food and Drug Law
(The Jungle)
1912:
The History of Drug Regulation
1906: Pure Food and Drug Law
(The Jungle)
1912:
The History of U.S. Drug Regulation
1927: Caustic Poison Act
-warning labels, antidote
The History of U.S. Drug Regulation
1927: Caustic Poison Act
-warning labels, antidote
The History of U.S. Drug Regulation
Early 1940’s
-animal testing required before human
The History of U.S. Drug Regulation
Early 1940’s -animal testing required before human
The History of U.S. Drug Regulation
1962: Kefauver-Harris Amendment
-response to thalidomide crisis
-requires
The History of U.S. Drug Regulation
1962: Kefauver-Harris Amendment
-response to thalidomide crisis
-requires
The History of Drug Regulation
1976: Medical Device Amendment
1977: Pregnant and (potentially
The History of Drug Regulation
1976: Medical Device Amendment
1977: Pregnant and (potentially
The History of U.S. Drug Regulation
1981: Drug Ad Regulations passed
1982: Tamper-Resistant
The History of U.S. Drug Regulation
1981: Drug Ad Regulations passed
1982: Tamper-Resistant
The History of U.S. Drug Regulation
ODA: More than 40 drugs developed,
The History of U.S. Drug Regulation
ODA: More than 40 drugs developed,
The History of U.S. Drug Regulation
1994: Dietary Supplement Health and Education
The History of U.S. Drug Regulation
1994: Dietary Supplement Health and Education
The FDA: Current Issues
Nicotine/Cigarette regulation
Policies re transgenic foods
Guidelines on industry-sponsored events,
The FDA: Current Issues
Nicotine/Cigarette regulation
Policies re transgenic foods
Guidelines on industry-sponsored events,
The FDA: Current Issues
Waiver of informed consent during wartime
-Pyridostigmine
-Botulinum-toxoid
The FDA: Current Issues
Waiver of informed consent during wartime -Pyridostigmine -Botulinum-toxoid
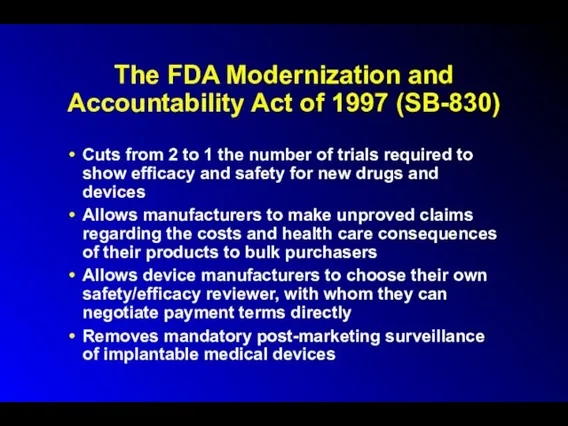
The FDA Modernization and Accountability Act of 1997 (SB-830)
Cuts from
The FDA Modernization and Accountability Act of 1997 (SB-830)
Cuts from
US Drug Regulation
2002: The Best Pharmaceuticals Act for Children
Extends patent protection
US Drug Regulation
2002: The Best Pharmaceuticals Act for Children
Extends patent protection
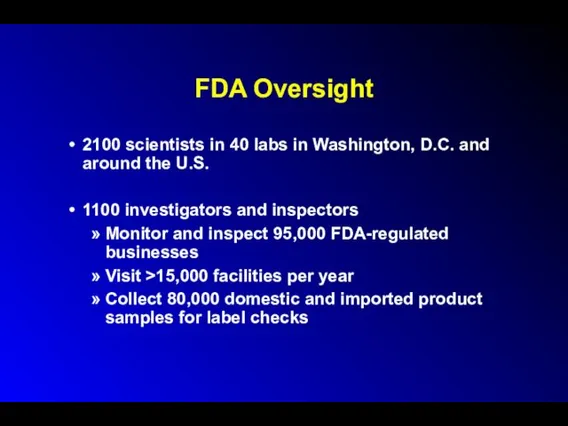
FDA Oversight
2100 scientists in 40 labs in Washington, D.C. and around
FDA Oversight
2100 scientists in 40 labs in Washington, D.C. and around
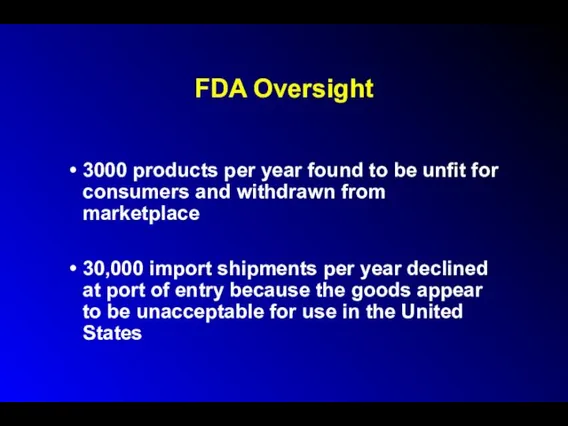
FDA Oversight
3000 products per year found to be unfit for consumers
FDA Oversight
3000 products per year found to be unfit for consumers
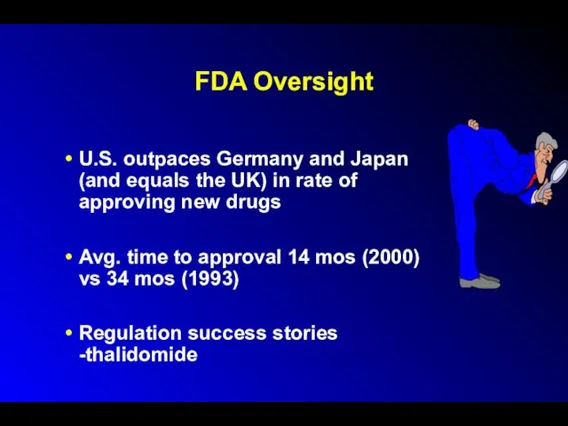
FDA Oversight
U.S. outpaces Germany and Japan (and equals the UK) in
FDA Oversight
U.S. outpaces Germany and Japan (and equals the UK) in
FDA Oversight
“Me too” drugs vs. “new molecular entities”
FDA approved 341 NMEs
FDA Oversight
“Me too” drugs vs. “new molecular entities”
FDA approved 341 NMEs
FDA Oversight
17 FDA-initiated market withdrawals, 1970-1995
-temafloxocin, flosequinan, Redux, Rezulin, etc.
9 withdrawals
FDA Oversight
17 FDA-initiated market withdrawals, 1970-1995
-temafloxocin, flosequinan, Redux, Rezulin, etc.
9 withdrawals
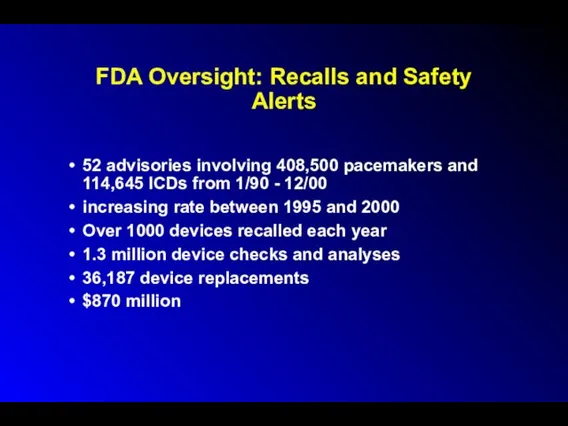
FDA Oversight: Recalls and Safety Alerts
52 advisories involving 408,500 pacemakers and
FDA Oversight: Recalls and Safety Alerts
52 advisories involving 408,500 pacemakers and
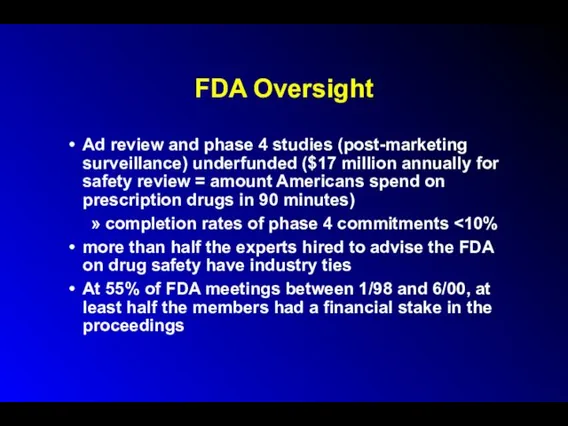
FDA Oversight
Ad review and phase 4 studies (post-marketing surveillance) underfunded ($17
FDA Oversight
Ad review and phase 4 studies (post-marketing surveillance) underfunded ($17
Criminal activities
FTC investigating
Astra-Zeneca for blocking generic competition for Prilosec;
Bristol-Meyers Squibb
Criminal activities
FTC investigating
Astra-Zeneca for blocking generic competition for Prilosec;
Bristol-Meyers Squibb
Criminal activities
Schering-Plough charged with paying $90 million to 2 competitors to
Criminal activities
Schering-Plough charged with paying $90 million to 2 competitors to
Criminal activities
Lilly pleaded guilty to criminal charges for withholding information from
Criminal activities
Lilly pleaded guilty to criminal charges for withholding information from
Criminal activities
Wholesale price manipulation
Bayer AG, Abbott Labs, SmithKline Beecham, Glaxo Wellcome,
Criminal activities
Wholesale price manipulation
Bayer AG, Abbott Labs, SmithKline Beecham, Glaxo Wellcome,
Investigations / Possible Criminal Activities
Justice Department investigating:
Metabolife for falsification of ephedra
Investigations / Possible Criminal Activities
Justice Department investigating:
Metabolife for falsification of ephedra
Investigations / Possible Criminal Activities
?Criminal charges?
Albuterol-less inhalers from Schering Plough
sloppy manufacturing;
Investigations / Possible Criminal Activities
?Criminal charges?
Albuterol-less inhalers from Schering Plough
sloppy manufacturing;
Drug Companies Behaving Badly:
The 10 Worst Corporations of 2002
*Multinational Monitor
Wyeth
Revealed that
Drug Companies Behaving Badly:
The 10 Worst Corporations of 2002
*Multinational Monitor
Wyeth
Revealed that
Third World “Donations” (Dumping) of Pharmaceuticals
Genuine gifts
Dubious “gifts” -- reasons:
-clear
Third World “Donations” (Dumping) of Pharmaceuticals
Genuine gifts
Dubious “gifts” -- reasons:
-clear
Third World “Donations” (Dumping)
of Pharmaceuticals
Egregious Examples:
-Expired Ceclor to Central
Third World “Donations” (Dumping)
of Pharmaceuticals
Egregious Examples: -Expired Ceclor to Central
Anti-AIDS Drugs and Africa
36 million infected with HIV; 2/3 in sub-Saharan
Anti-AIDS Drugs and Africa
36 million infected with HIV; 2/3 in sub-Saharan
The FDA: The Future
Trade name review prior to marketing approval
-Losec/Lasix
Mandated patient
The FDA: The Future
Trade name review prior to marketing approval
-Losec/Lasix
Mandated patient
The Internet and Pharmaceuticals
New website created q 3 seconds
1/4 of websites
The Internet and Pharmaceuticals
New website created q 3 seconds
1/4 of websites
The Internet and Pharmaceuticals
Free software / Physician profiling
“ePocrates”
Internet pharmacies
$1.9 billion sales
The Internet and Pharmaceuticals
Free software / Physician profiling
“ePocrates”
Internet pharmacies
$1.9 billion sales
Physician Prescribing Habits
Influences
-texts, journals, colleagues, marketing and advertising
-ego bias
-how benefits presented
-average
Physician Prescribing Habits
Influences -texts, journals, colleagues, marketing and advertising -ego bias -how benefits presented -average
Physician Prescribing Habits
Influences
-texts, journals, colleagues, marketing, and advertising
-ego bias
-how benefits presented
-average
Physician Prescribing Habits
Influences -texts, journals, colleagues, marketing, and advertising -ego bias -how benefits presented -average
Physician Prescribing Habits
Up to 85% of residents prescribe to non-patients
50% of
Physician Prescribing Habits
Up to 85% of residents prescribe to non-patients
50% of
Pharmaceuticals Sales Reps’ Techniques
Appeal to authority
Appeal to popularity
The “red herring”
Appeal to
Pharmaceuticals Sales Reps’ Techniques
Appeal to authority
Appeal to popularity
The “red herring”
Appeal to
Pharmaceuticals Sales Reps’ Techniques
Appeal to curiosity
Free food/gifts
Testimonials
Relationship building/face time
Pharmaceuticals Sales Reps’ Techniques
Appeal to curiosity
Free food/gifts
Testimonials
Relationship building/face time
Pharmaceutical Sales Reps’ Techniques
Active learning -- reinforcement plus change
Favorable but
Pharmaceutical Sales Reps’ Techniques
Active learning -- reinforcement plus change
Favorable but
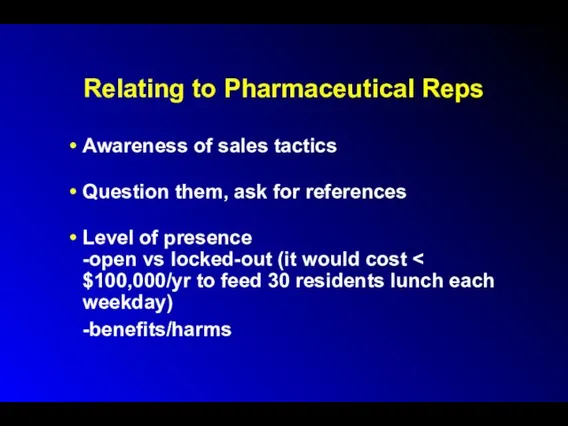
Relating to Pharmaceutical Reps
Awareness of sales tactics
Question them, ask for references
Level
Relating to Pharmaceutical Reps
Awareness of sales tactics
Question them, ask for references
Level
Academia and Industry
US R&D (2000):
industry - $55-60 billion
federal government - $25
Academia and Industry
US R&D (2000):
industry - $55-60 billion
federal government - $25
Academia and Industry
1991: 80% of industry sponsored clinical trials performed in
Academia and Industry
1991: 80% of industry sponsored clinical trials performed in
CROs and SMOs
Contract Research Organizations (CROs): provide central oversight and management
CROs and SMOs
Contract Research Organizations (CROs): provide central oversight and management
Academia and Industry
3-fold increase in the number of physicians conducting “research”
Academia and Industry
3-fold increase in the number of physicians conducting “research”
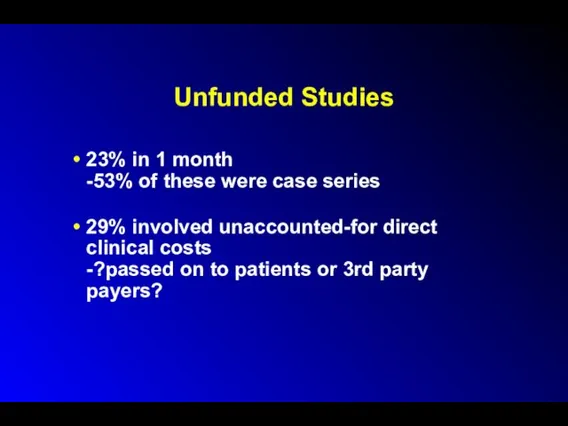
Unfunded Studies
23% in 1 month
-53% of these were case series
29% involved
Unfunded Studies
23% in 1 month
-53% of these were case series
29% involved
Academia and Industry
Majority of authors of Clinical Practice Guidelines have industry
Academia and Industry
Majority of authors of Clinical Practice Guidelines have industry
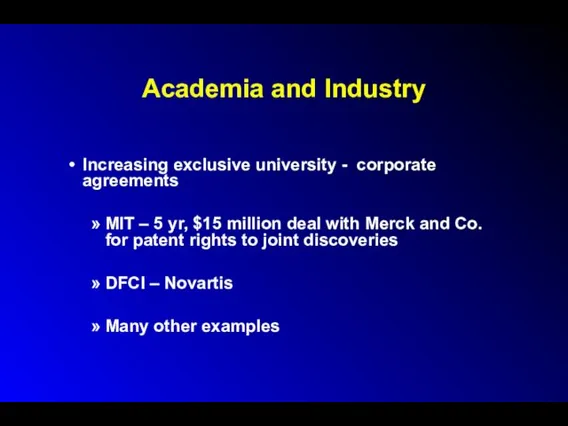
Academia and Industry
Increasing exclusive university - corporate agreements
MIT – 5 yr,
Academia and Industry
Increasing exclusive university - corporate agreements
MIT – 5 yr,
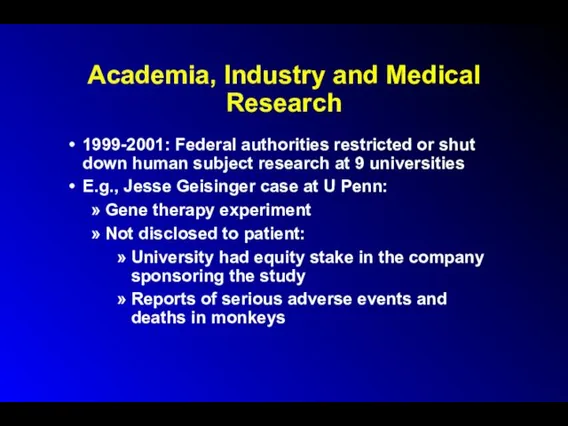
Academia, Industry and Medical Research
1999-2001: Federal authorities restricted or shut down
Academia, Industry and Medical Research
1999-2001: Federal authorities restricted or shut down
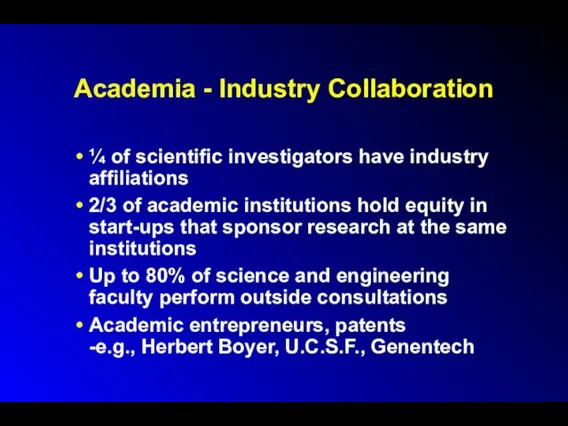
Academia - Industry Collaboration
¼ of scientific investigators have industry affiliations
2/3 of
Academia - Industry Collaboration
¼ of scientific investigators have industry affiliations
2/3 of
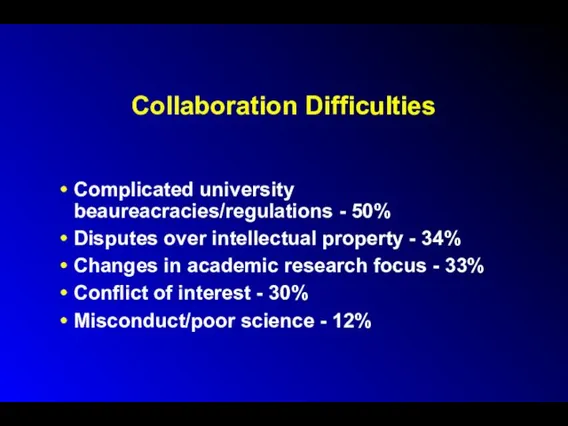
Collaboration Difficulties
Complicated university beaureacracies/regulations - 50%
Disputes over intellectual property - 34%
Changes
Collaboration Difficulties
Complicated university beaureacracies/regulations - 50%
Disputes over intellectual property - 34%
Changes
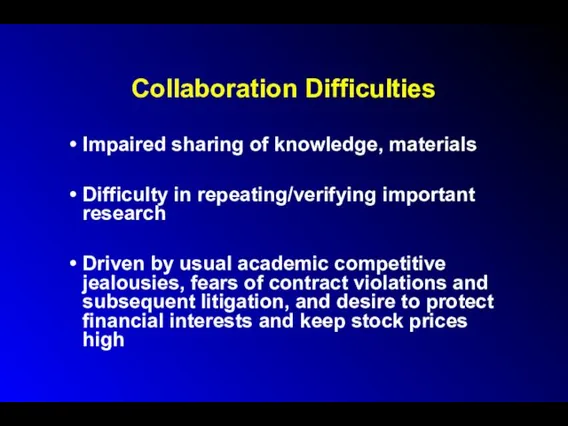
Collaboration Difficulties
Impaired sharing of knowledge, materials
Difficulty in repeating/verifying important research
Driven by
Collaboration Difficulties
Impaired sharing of knowledge, materials
Difficulty in repeating/verifying important research
Driven by
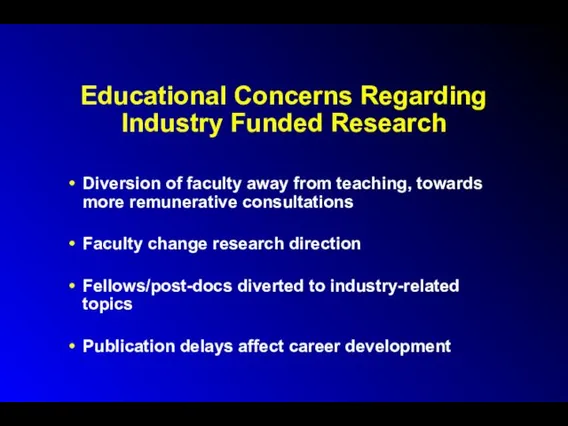
Educational Concerns Regarding Industry Funded Research
Diversion of faculty away from teaching,
Educational Concerns Regarding Industry Funded Research
Diversion of faculty away from teaching,
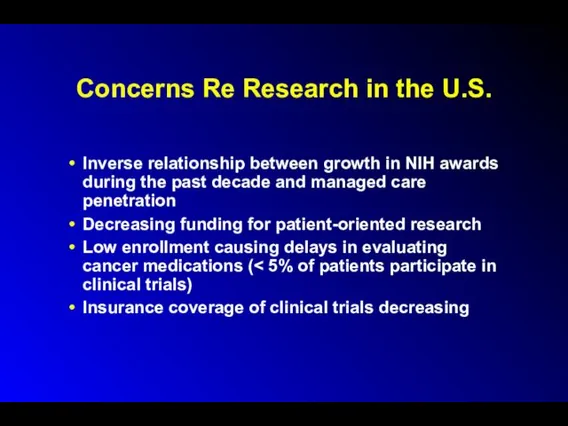
Concerns Re Research in the U.S.
Inverse relationship between growth in NIH
Concerns Re Research in the U.S.
Inverse relationship between growth in NIH
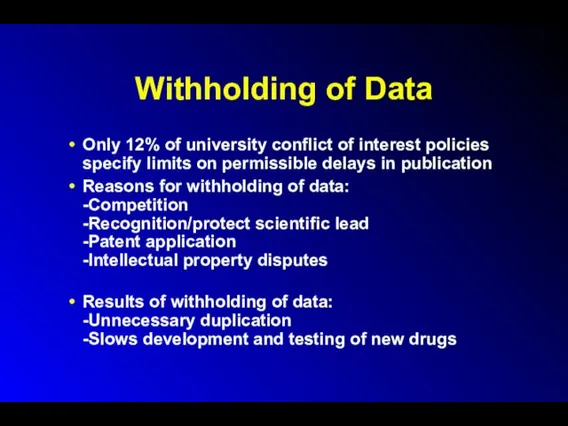
Withholding of Data
Only 12% of university conflict of interest policies
Withholding of Data
Only 12% of university conflict of interest policies
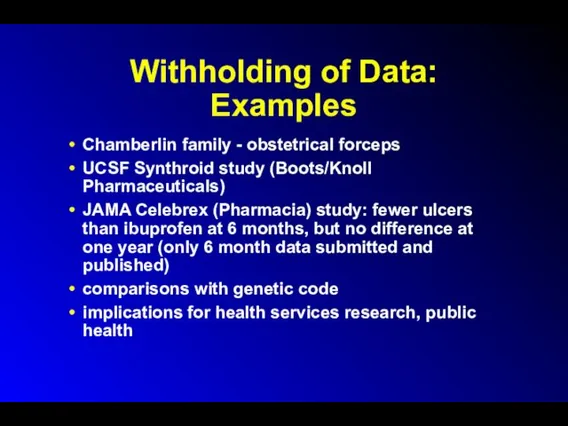
Withholding of Data: Examples
Chamberlin family - obstetrical forceps
UCSF Synthroid study (Boots/Knoll
Withholding of Data: Examples
Chamberlin family - obstetrical forceps
UCSF Synthroid study (Boots/Knoll
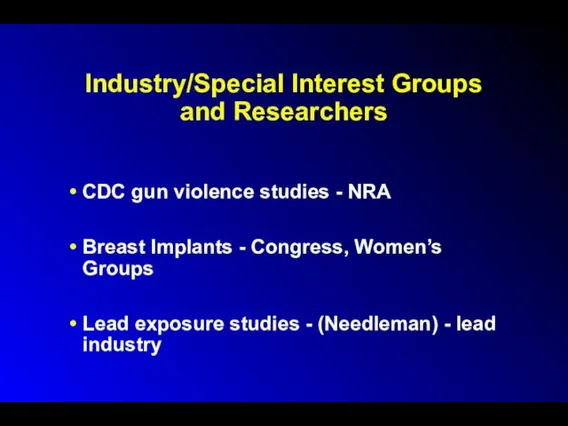
Industry/Special Interest Groups and Researchers
CDC gun violence studies - NRA
Breast Implants
Industry/Special Interest Groups and Researchers
CDC gun violence studies - NRA
Breast Implants
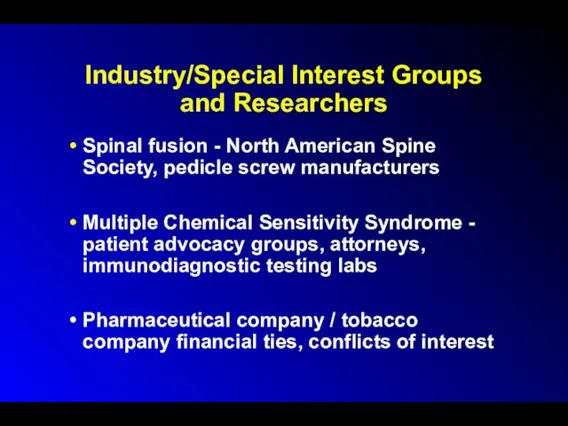
Industry/Special Interest Groups and Researchers
Spinal fusion - North American Spine Society,
Industry/Special Interest Groups and Researchers
Spinal fusion - North American Spine Society,
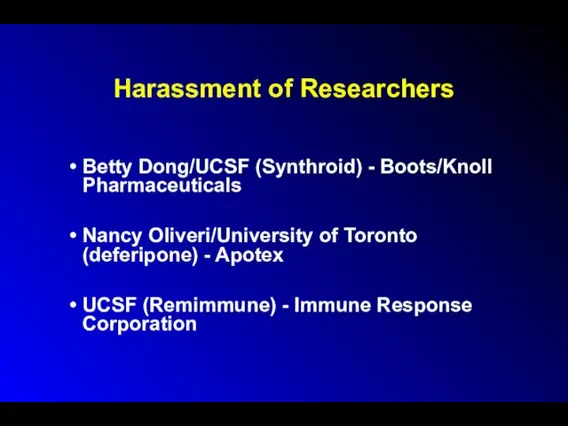
Harassment of Researchers
Betty Dong/UCSF (Synthroid) - Boots/Knoll Pharmaceuticals
Nancy Oliveri/University of Toronto
Harassment of Researchers
Betty Dong/UCSF (Synthroid) - Boots/Knoll Pharmaceuticals
Nancy Oliveri/University of Toronto
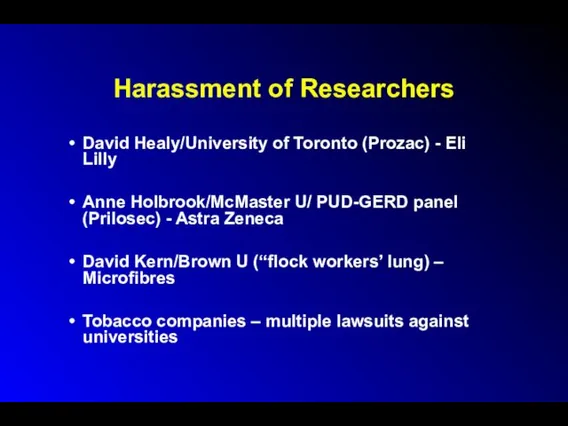
Harassment of Researchers
David Healy/University of Toronto (Prozac) - Eli Lilly
Anne Holbrook/McMaster
Harassment of Researchers
David Healy/University of Toronto (Prozac) - Eli Lilly
Anne Holbrook/McMaster
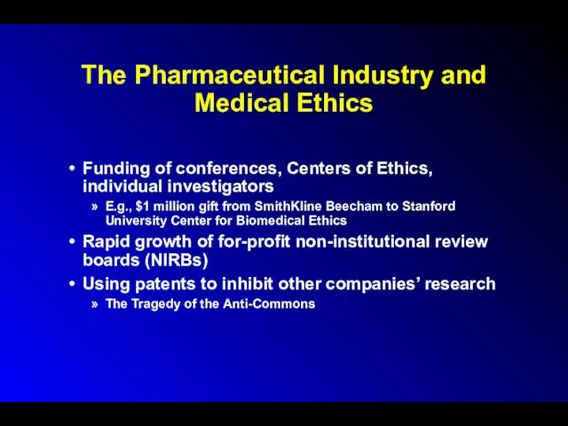
The Pharmaceutical Industry and Medical Ethics
Funding of conferences, Centers of Ethics,
The Pharmaceutical Industry and Medical Ethics
Funding of conferences, Centers of Ethics,
The Pharmaceutical Industry and Medical Ethics
Ethics consultants serving on corporate boards
E.g.,
The Pharmaceutical Industry and Medical Ethics
Ethics consultants serving on corporate boards
E.g.,
Recommendations for Industry-Sponsored Research
Written agreements with university, not researcher
Alternatives selected based
Recommendations for Industry-Sponsored Research
Written agreements with university, not researcher
Alternatives selected based
Recommendations for Industry-Sponsored Research
Full disclosure of conflicts of interest
No gag
Recommendations for Industry-Sponsored Research
Full disclosure of conflicts of interest
No gag
Industry/Special Interest Groups and Researchers/Societies
Pork barrel research funding - Congress
c.f., legislating
Industry/Special Interest Groups and Researchers/Societies
Pork barrel research funding - Congress
c.f., legislating
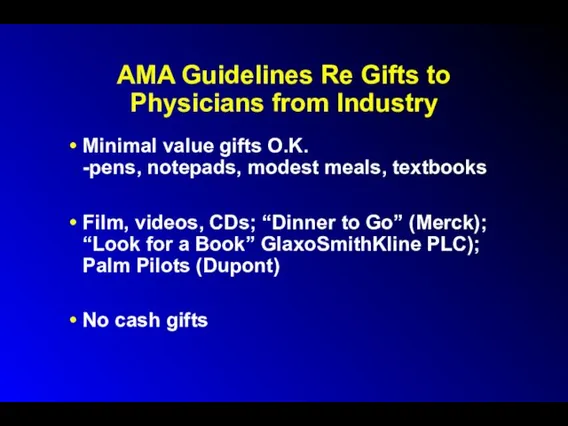
AMA Guidelines Re Gifts to Physicians from Industry
Minimal value gifts
AMA Guidelines Re Gifts to Physicians from Industry
Minimal value gifts
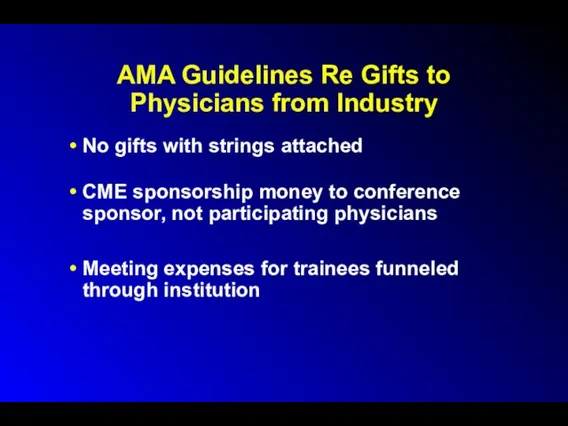
AMA Guidelines Re Gifts to Physicians from Industry
No gifts with strings
AMA Guidelines Re Gifts to Physicians from Industry
No gifts with strings
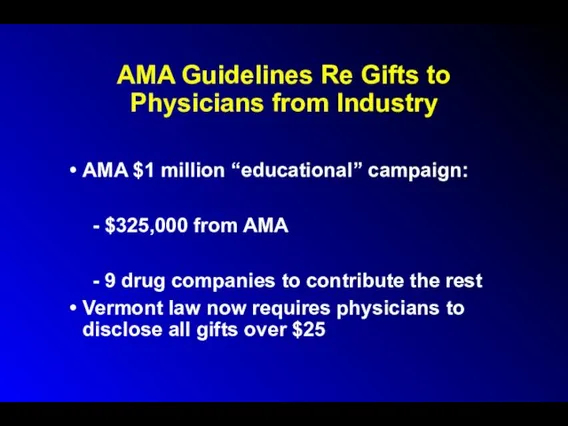
AMA Guidelines Re Gifts to Physicians from Industry
AMA $1 million “educational”
AMA Guidelines Re Gifts to Physicians from Industry
AMA $1 million “educational”
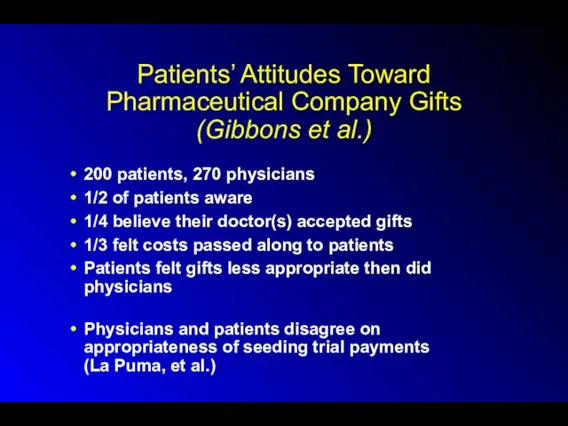
Patients’ Attitudes Toward Pharmaceutical Company Gifts
(Gibbons et al.)
200 patients, 270 physicians
1/2
Patients’ Attitudes Toward Pharmaceutical Company Gifts
(Gibbons et al.)
200 patients, 270 physicians
1/2
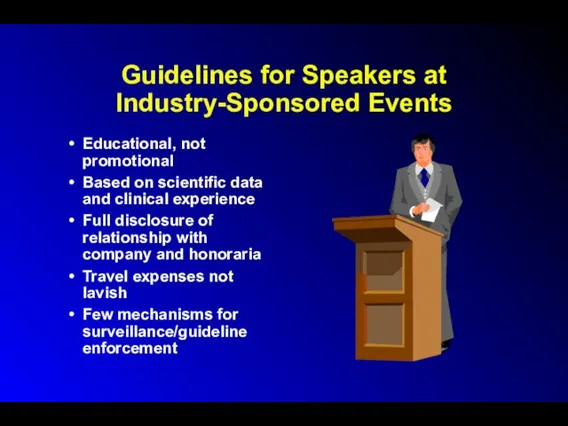
Guidelines for Speakers at Industry-Sponsored Events
Educational, not promotional
Based on
Guidelines for Speakers at Industry-Sponsored Events
Educational, not promotional
Based on
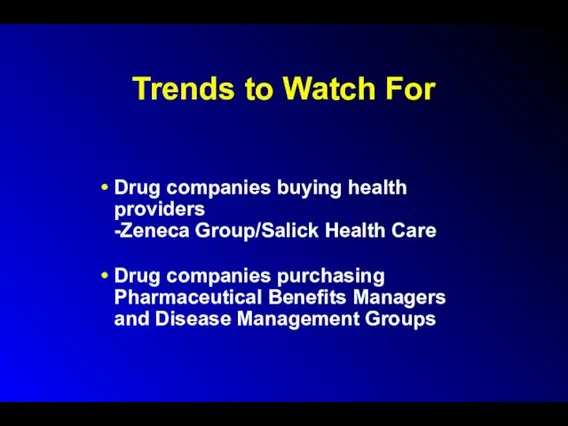
Trends to Watch For
Drug companies buying health providers
-Zeneca Group/Salick Health Care
Drug
Trends to Watch For
Drug companies buying health providers
-Zeneca Group/Salick Health Care
Drug
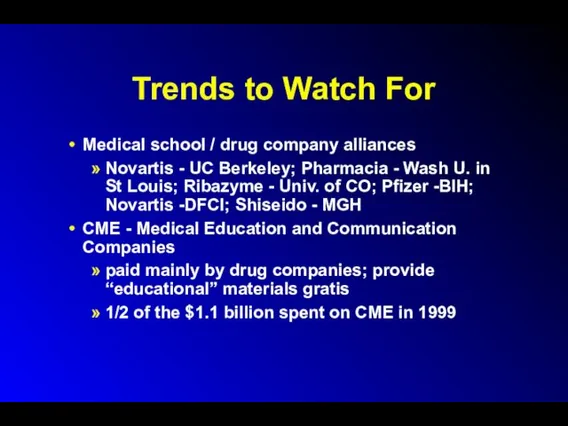
Trends to Watch For
Medical school / drug company alliances
Novartis - UC
Trends to Watch For
Medical school / drug company alliances
Novartis - UC
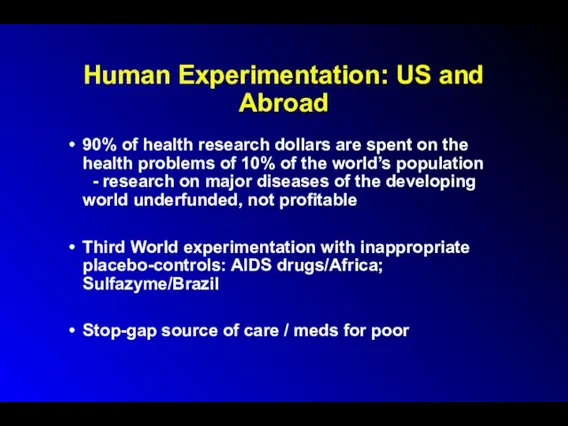
Human Experimentation: US and Abroad
90% of health research dollars are spent
Human Experimentation: US and Abroad
90% of health research dollars are spent
Human Experimentation: US and Abroad
Human Experimentation Companies
For-Profit IRBs
Private-practice-based “investigators”
Human Experimentation: US and Abroad
Human Experimentation Companies
For-Profit IRBs
Private-practice-based “investigators”
Enhancing Cooperation Between Physicians and the Pharmaceutical Industry
Improving compliance
Decreasing adverse events
Promotion
Enhancing Cooperation Between Physicians and the Pharmaceutical Industry
Improving compliance
Decreasing adverse events
Promotion
Conclusions
Pharmaceuticals and Biotechnology Industries
-Tremendous contributions to health
-Motivation = “alleviate suffering”
-Primary responsibility
Conclusions
Pharmaceuticals and Biotechnology Industries -Tremendous contributions to health -Motivation = “alleviate suffering” -Primary responsibility
Useful Phone Numbers
FDA and Regulated Products Info
1-800-222-0185
Medwatch/Adverse Events Reporting
1-800-332-1088
Advertising/Promotion/Marketing Concerns
1-800-238-7332
Prescription Drug
Useful Phone Numbers
FDA and Regulated Products Info
1-800-222-0185
Medwatch/Adverse Events Reporting
1-800-332-1088
Advertising/Promotion/Marketing Concerns
1-800-238-7332
Prescription Drug
 ADR-доставка без перегрузов на одной прямой машине от двери до двери
 Личный бренд
 Новогоднее оформление нестационарных торговых объектов
 Бизнес Центр AGAT
 Царское вино Грузии. Традиции веков
 Ассортимент Национальный комфорт
 河南省豫星微钻有限公司-Юйсин Микро-дрель корпорация Провинции Хэнань
 Личный бренд риэлтора
 Организация профессиональной деятельности в сети
 Визуализация имиджа. Фирменный стиль
 Подарочные наборы Avon
 И-МНЕ Сеть магазинов натуральной, экологически чистой еды
 Тема 3. Обзор маркетплейсов
 Гэсэр. Описание
 Экомерчандайзер. Экологические товары
 Свадьба в викторианском стиле
 Средства для подтверждения записи организация записи
 Описание товаров по Договору поставки №02-1/1011 от 11.09.2023 г
 Итоги года 2022. Тоннаж. Распределение объемов на каналы продаж
 Презентация Microsoft PowerPoint
 Как стать поставщиком X5. Заключение контракта
 Комплект баннеров
 Корпорация Тiens Group Corporation
 Качественные и количественные методы маркетинговых исследований
 нформационный материал для товарных поставщиков ДИКСИ по применению электроного документооборота
 Специальное предложение. Гостиницы наших партнеров
 День Семьи
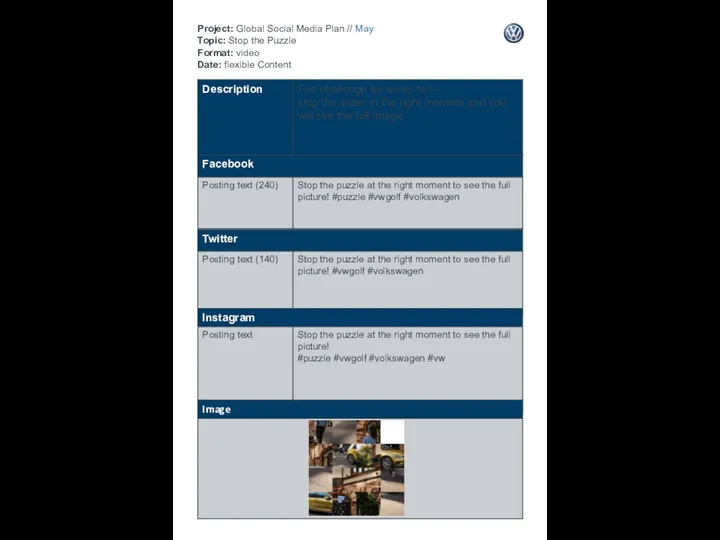 Project: Global Social Media Plan // May Topic: Stop the Puzzle Format: video Date: flexible Content