- Functions and their graphs

Содержание
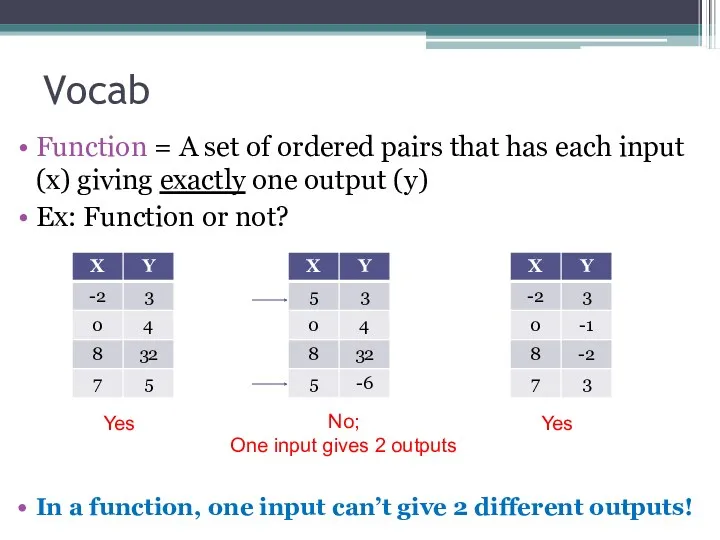
- 2. Vocab Function = A set of ordered pairs that has each input (x) giving exactly one
- 3. (x, y) = (input, output) f(x) is another way to write an output Domain = the
- 4. Ex: For the function f(x) = 2 – x2 , evaluate the following: f(x+1) Ex: For
- 5. Ex: For the function f(x) = x2 – 2x + 3, evaluate the following: f(x+h)
- 6. Ex: For the function f(x) = 2x2 – 3 , evaluate the following: The difference quotient
- 7. f(x) = 5x + 6. Find f(x – 3). 5x – 3 5x + 3 5x
- 8. f(x) = 2x – x2 . Find f(x + 1). -x2 + 1 -x2 + 2x
- 9. Ex: The function below is a piecewise function. Find f(0) and f(1). Since 0 f(0) =
- 10. y = x2 means y is a function of x Y is not a function of
- 11. The domain (set of all x’s) is always assumed to be all real numbers unless some
- 12. To find range, graph the function and infer the range (set of all y’s). Ex: Find
- 13. What is the domain? xϵℝ -2≤x≤2 x≥0 -2
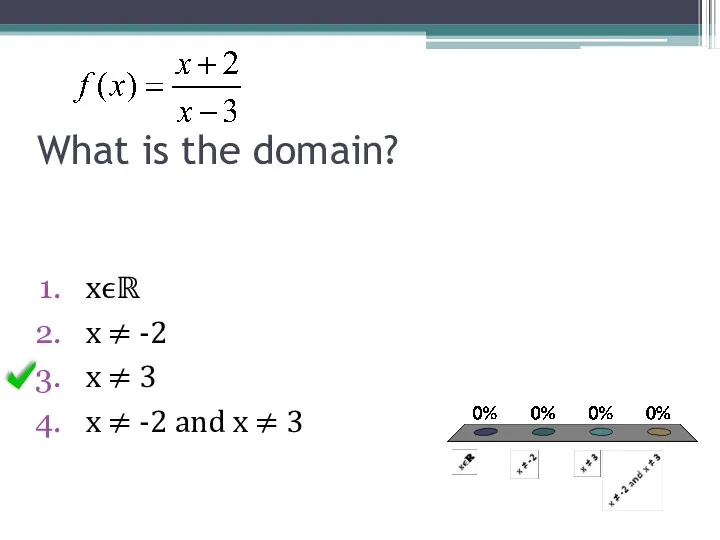
- 14. What is the domain? xϵℝ x ≠ -2 x ≠ 3 x ≠ -2 and x
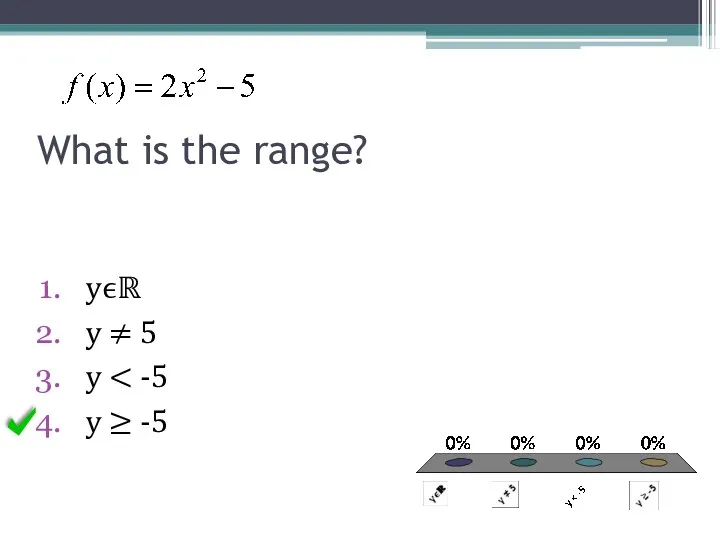
- 15. What is the range? yϵℝ y ≠ 5 y y ≥ -5
- 16. Ch. 1 – Functions and Their Graphs 1.3 – More Functions
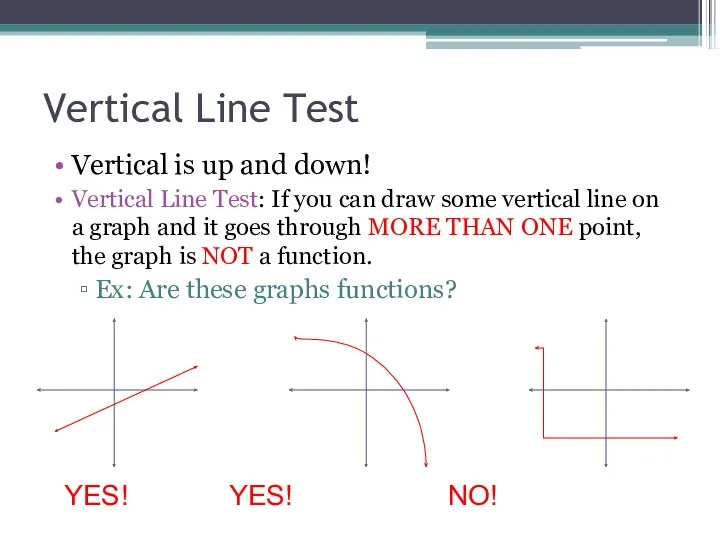
- 17. Vertical Line Test Vertical is up and down! Vertical Line Test: If you can draw some
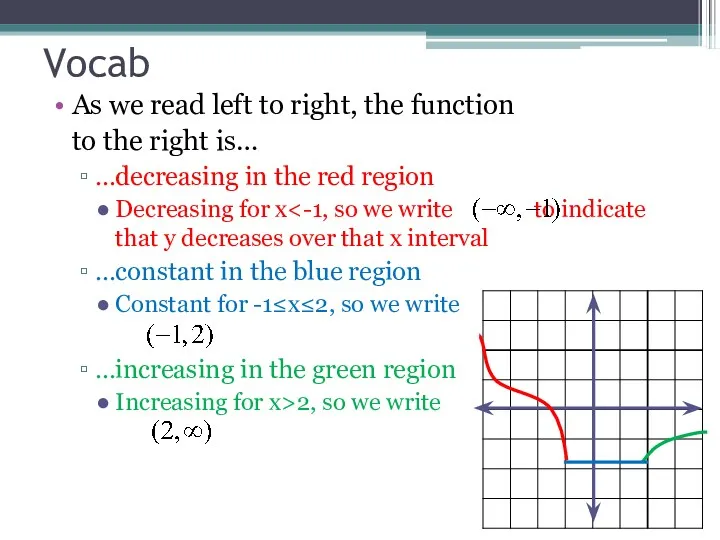
- 18. Vocab As we read left to right, the function to the right is… …decreasing in the
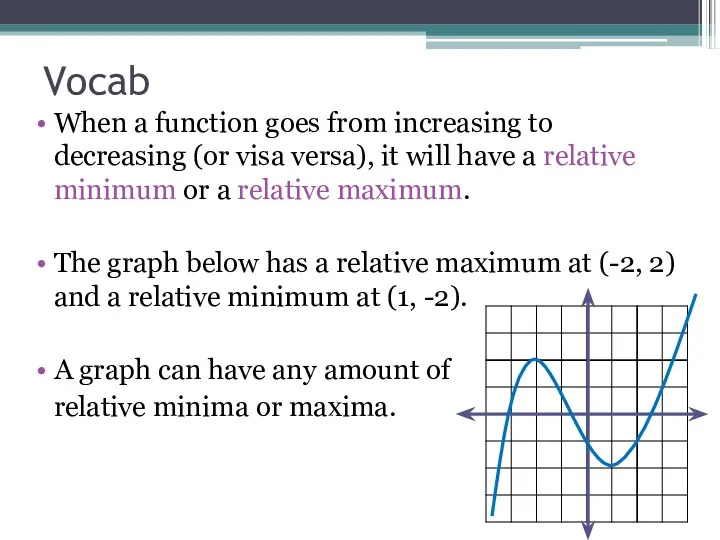
- 19. Vocab When a function goes from increasing to decreasing (or visa versa), it will have a
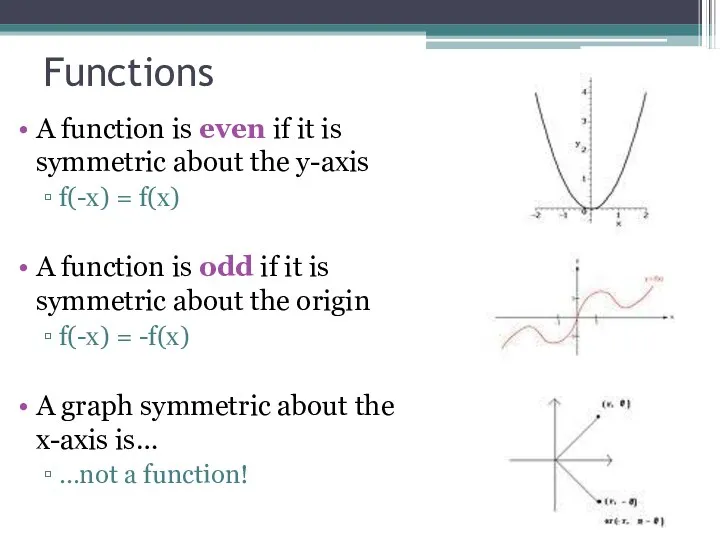
- 20. Functions A function is even if it is symmetric about the y-axis f(-x) = f(x) A
- 21. The function y = 4x2 – 2 is… Even Odd None of the above Not a
- 22. The function y = 1/x is… Even Odd None of the above Not a function
- 23. The function y = x3 – x is… Even Odd None of the above Not a
- 25. Скачать презентацию
Vocab
Function = A set of ordered pairs that has each input
Vocab
Function = A set of ordered pairs that has each input
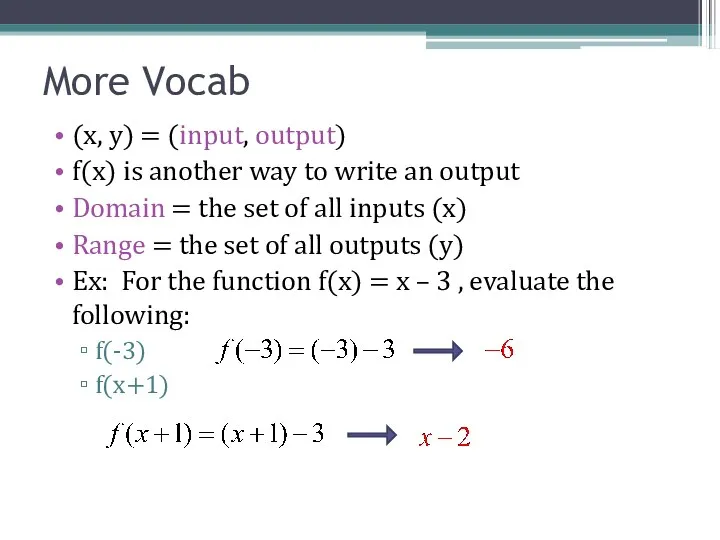
(x, y) = (input, output)
f(x) is another way to write an
(x, y) = (input, output)
f(x) is another way to write an
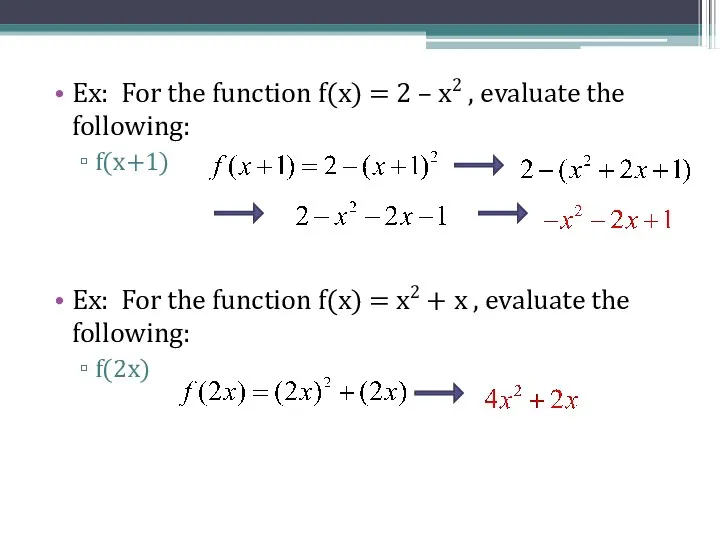
Ex: For the function f(x) = 2 – x2 , evaluate
Ex: For the function f(x) = 2 – x2 , evaluate
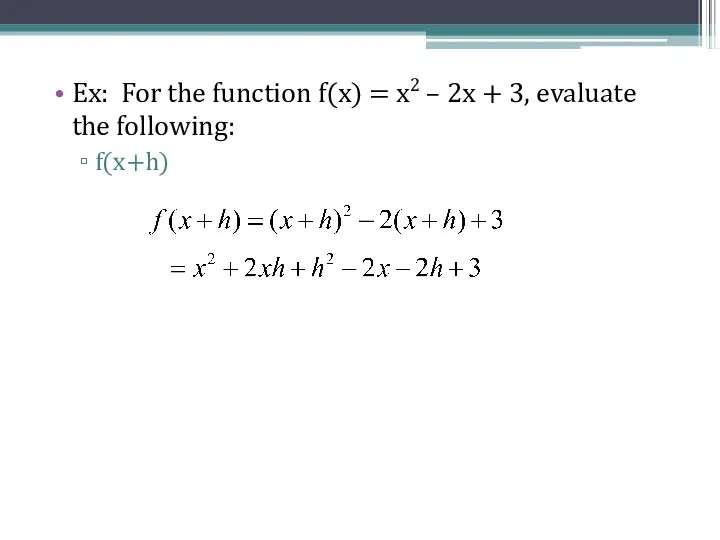
Ex: For the function f(x) = x2 – 2x + 3,
Ex: For the function f(x) = x2 – 2x + 3,
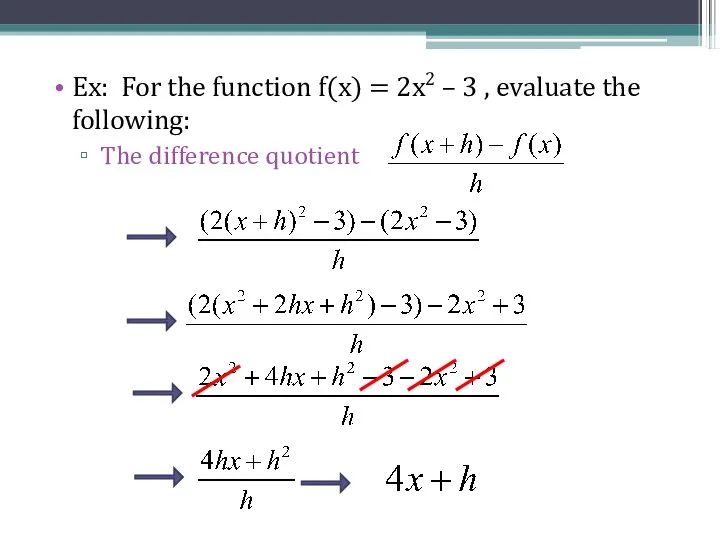
Ex: For the function f(x) = 2x2 – 3 , evaluate
Ex: For the function f(x) = 2x2 – 3 , evaluate
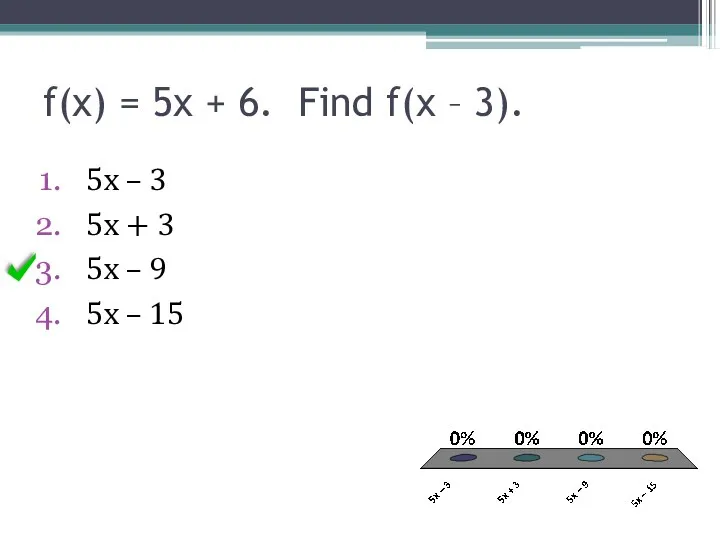
f(x) = 5x + 6. Find f(x – 3).
5x – 3
5x
f(x) = 5x + 6. Find f(x – 3).
5x – 3
5x
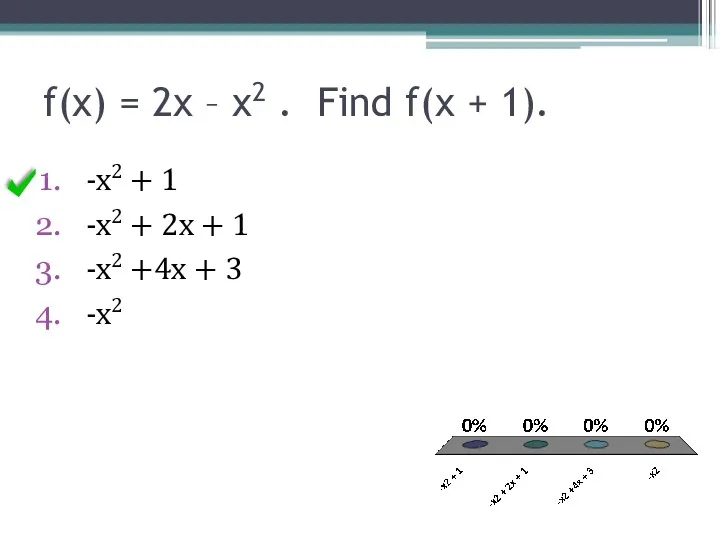
f(x) = 2x – x2 . Find f(x + 1).
-x2 +
f(x) = 2x – x2 . Find f(x + 1).
-x2 +
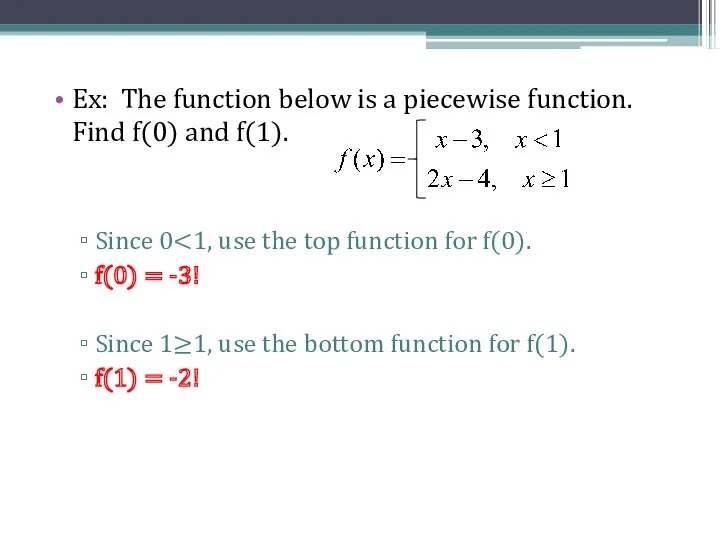
Ex: The function below is a piecewise function. Find f(0) and
Ex: The function below is a piecewise function. Find f(0) and
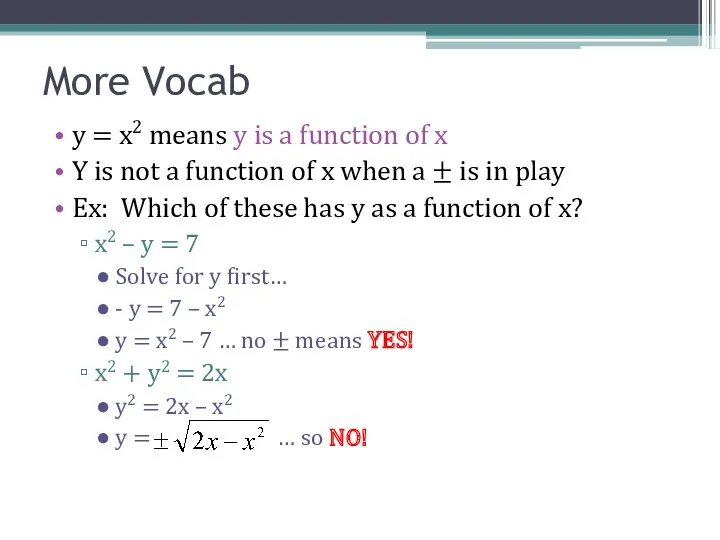
y = x2 means y is a function of x
Y is
y = x2 means y is a function of x
Y is
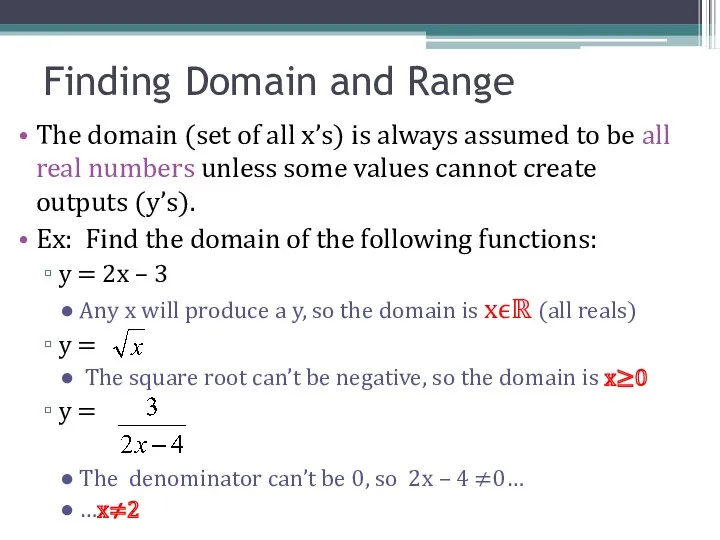
The domain (set of all x’s) is always assumed to be
The domain (set of all x’s) is always assumed to be
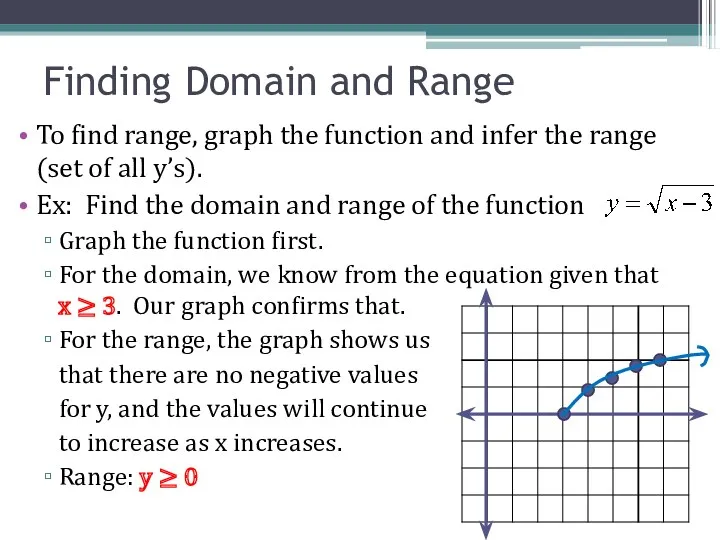
To find range, graph the function and infer the range (set
To find range, graph the function and infer the range (set
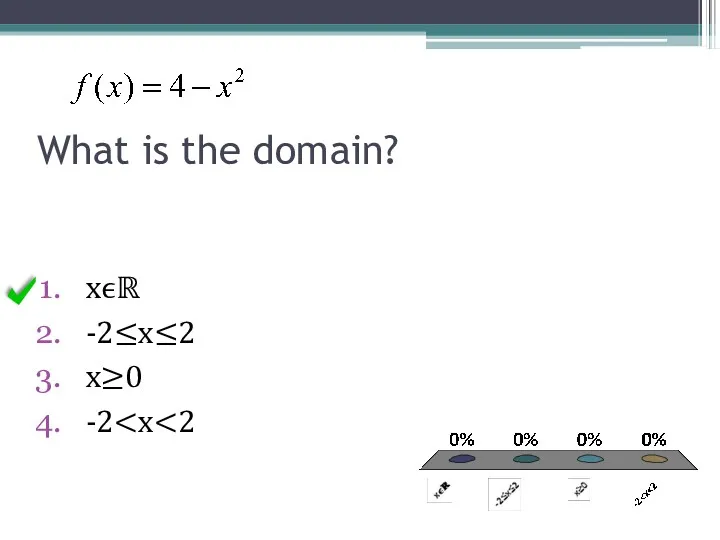
What is the domain?
xϵℝ
-2≤x≤2
x≥0
-2
What is the domain?
xϵℝ
-2≤x≤2
x≥0
-2
What is the domain?
xϵℝ
x ≠ -2
x ≠ 3
x ≠ -2 and
What is the domain?
xϵℝ
x ≠ -2
x ≠ 3
x ≠ -2 and
What is the range?
yϵℝ
y ≠ 5
y < -5
y ≥ -5
What is the range?
yϵℝ
y ≠ 5
y < -5
y ≥ -5
Ch. 1 – Functions and Their Graphs
1.3 – More Functions
Ch. 1 – Functions and Their Graphs
1.3 – More Functions
Vertical Line Test
Vertical is up and down!
Vertical Line Test: If you
Vertical Line Test
Vertical is up and down!
Vertical Line Test: If you
Vocab
As we read left to right, the function
to the right
Vocab
As we read left to right, the function
to the right
Vocab
When a function goes from increasing to decreasing (or visa versa),
Vocab
When a function goes from increasing to decreasing (or visa versa),
Functions
A function is even if it is symmetric about the y-axis
f(-x)
Functions
A function is even if it is symmetric about the y-axis
f(-x)
The function y = 4x2 – 2 is…
Even
Odd
None of the above
Not
The function y = 4x2 – 2 is…
Even
Odd
None of the above
Not
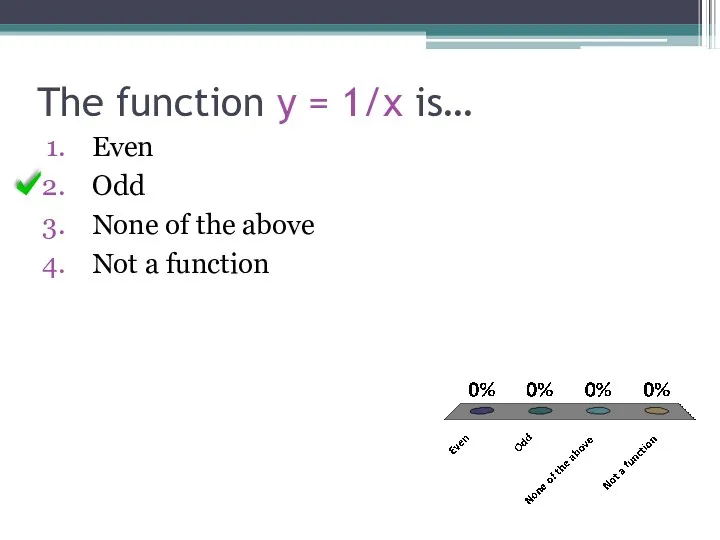
The function y = 1/x is…
Even
Odd
None of the above
Not a function
The function y = 1/x is…
Even
Odd
None of the above
Not a function
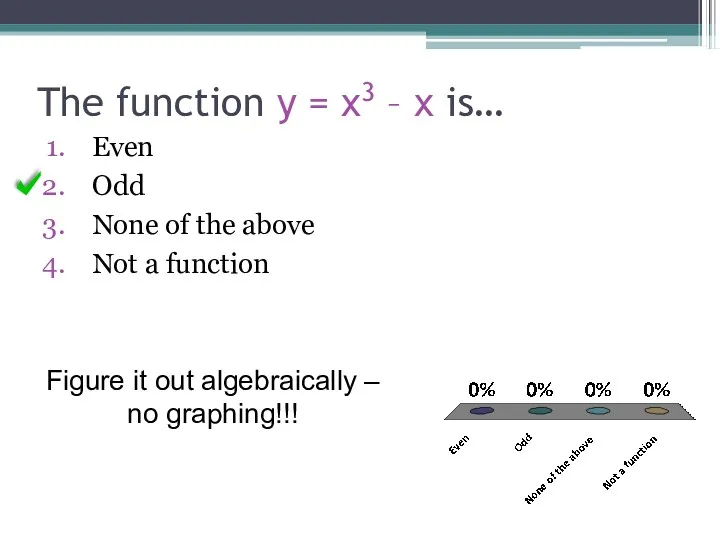
The function y = x3 – x is…
Even
Odd
None of the above
Not
The function y = x3 – x is…
Even
Odd
None of the above
Not
 Предварительная обработка экспериментальных данных
 Старинные измерения величин
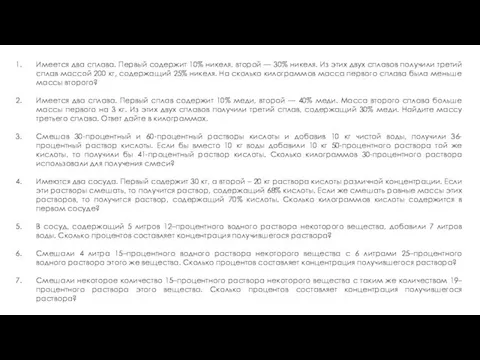 Задачи на смеси и сплавы
 Число и цифра 5. Состав Числа 5.
 Показательная функция, ее свойства и график
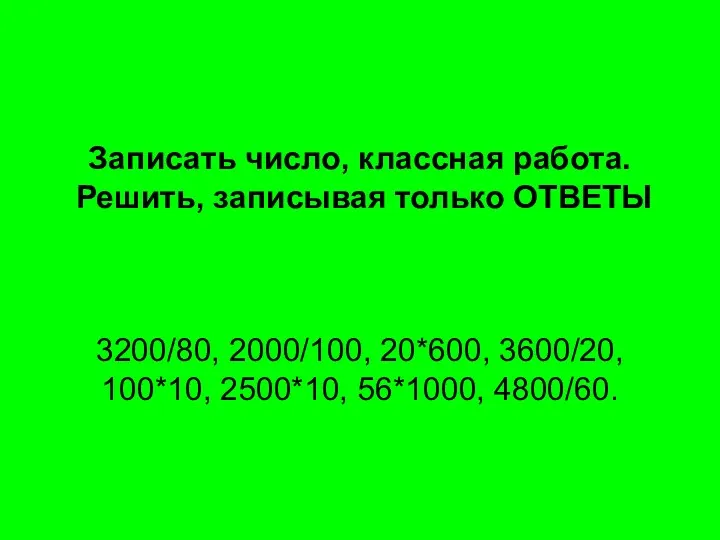 Алгоритм деления многозначного числа на однозначное
 открытый урок по математика 3 класс система Занкова
 Статистика. Цели проекта
 Сложение однозначных чисел с переходом через десяток вида … +4
 Геометрия. Подготовка к ОГЭ
 Cложение и вычитание алгебраических дробей с разными знаменателями. 8 класс
 Урок математики по теме: Единицы времени
 презентация к уроку математики в 3 классе по теме: Угол. Виды углов. Сравнение углов
 Окружность и круг в задачах повышенного уровня сложности по планиметрии в КИМ на ЕГЭ по математике
 Решение систем уравнений способом сложения
 Деление числа на произведение
 Многогранники и круглые тела
 Уравнения, сводящиеся к квадратным
 Презентация к уроку математики
 Системы уравнений с несколькими неизвестными. Метод замены неизвестных
 Цилиндр. Понятие цилиндрической поверхности
 Математика представляет собой могущественный инструмент познания природы
 Вписанные и описанные окружности. (9 класс)
 Давайте посчитаем. Устный счёт. 2класс. Математика
 Средняя линия треугольника
 Урок-сказка по математике, 1 класс.
 Модуль числа
 Окружность и круг в задачах повышенного уровня сложности по планиметрии в КИМ на ЕГЭ по математике