- Introduction to Statistics. Week 1 (2)

Содержание
- 2. Population vs. Sample Dr Susanne Hansen Saral Ch. 1- Population Sample
- 3. Statistical key definitions POPULATION A population is the collection of all items of interest under investigation.
- 4. Statistical key definitions SAMPLE A sample is an observed subset of the population n represents the
- 5. Statistical key definitions PARAMETER VS. STATISTICS A parameter is a specific characteristic of a population (mean,
- 6. Why do we collect samples instead of investigating the entire population? Populations usually are infinite and
- 7. Why do we collect samples instead of investigating the entire population? Populations are usually infinite. Therefore
- 8. Randomness (Turkish: Rasgelelik) Our final objective in statistics is to make valid and reliable statements about
- 9. Main sampling techniques Simple random sampling Systematic sampling Both techniques respect randomness and therefore provide reliable
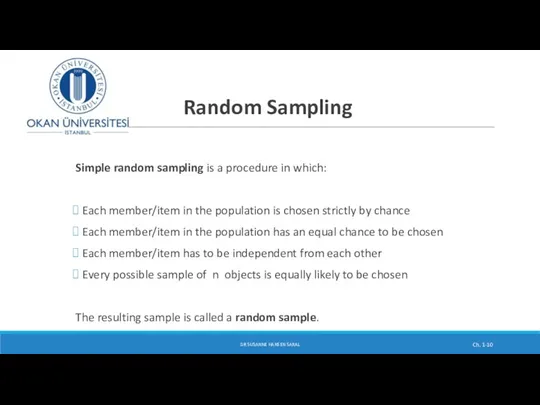
- 10. Random Sampling Simple random sampling is a procedure in which: Each member/item in the population is
- 11. Sampling error In statistics we make decision about a population based on sample data, because the
- 12. Inferential statistics Drawing conclusion about a population based a sample information. DR SUSANNE HANSEN SARAL Ch.
- 13. Inferential statistics To draw conclusions about the population based on a sample we need to collect
- 14. What is data? Data = information Data can be numbers: Size of a hotel bill, number
- 15. Data and context Data are useless without a context. When we deal with data we need
- 16. Data and context Data values are useless without their context Consider the following: Amazon.com may collect
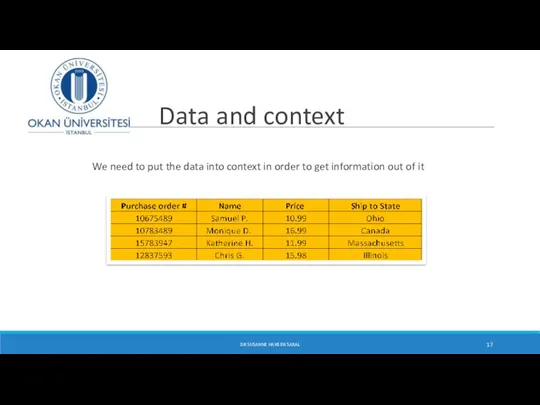
- 17. Data and context We need to put the data into context in order to get information
- 18. What is statistics? It is a basic study of transforming data into information : how to
- 19. Where does data come from? Market research Survey (online questionnaires, paper questionnaires, etc.) Interviews Research experiments
- 20. Descriptive Statistics Collect data e.g., Survey, interview Present data e.g., Tables and graphs Summarize data e.g.,
- 21. Create your account in Khan Academy Go to www.khanacademy.org create an account with your email address
- 23. Скачать презентацию
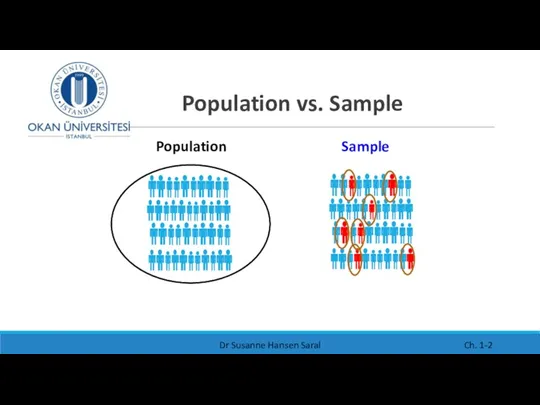
Population vs. Sample
Dr Susanne Hansen Saral
Ch. 1-
Population
Sample
Population vs. Sample
Dr Susanne Hansen Saral
Ch. 1-
Population
Sample
Statistical key definitions
POPULATION
A population is the collection of all
Statistical key definitions
POPULATION
A population is the collection of all
Statistical key definitions SAMPLE
A sample is an observed subset of
Statistical key definitions SAMPLE
A sample is an observed subset of
Statistical key definitions
PARAMETER VS. STATISTICS
A parameter is a specific
Statistical key definitions
PARAMETER VS. STATISTICS
A parameter is a specific
Why do we collect samples instead of investigating the entire
Why do we collect samples instead of investigating the entire
Why do we collect samples instead of investigating the entire
Why do we collect samples instead of investigating the entire
Randomness (Turkish: Rasgelelik)
Our final objective in statistics is to make valid
Randomness (Turkish: Rasgelelik)
Our final objective in statistics is to make valid
Main sampling techniques
Simple random sampling
Systematic sampling
Both techniques respect randomness and therefore
Main sampling techniques
Simple random sampling
Systematic sampling
Both techniques respect randomness and therefore
Random Sampling
Simple random sampling is a procedure in which:
Each member/item
Random Sampling
Simple random sampling is a procedure in which:
Each member/item
Sampling error
In statistics we make decision about a population based on
Sampling error
In statistics we make decision about a population based on
Inferential statistics
Drawing conclusion about a population
based a sample information.
DR
Inferential statistics
Drawing conclusion about a population
based a sample information.
DR
Inferential statistics
To draw conclusions about the population based on a
sample
Inferential statistics
To draw conclusions about the population based on a
sample
What is data?
Data = information
Data can be numbers: Size
What is data?
Data = information
Data can be numbers: Size
Data and context
Data are useless without a context.
When we
Data and context
Data are useless without a context.
When we

Data and context
Data values are useless without their context
Consider
Data and context
Data values are useless without their context
Consider
Data and context
We need to put the data into
Data and context
We need to put the data into
What is statistics?
It is a basic study of transforming data
What is statistics?
It is a basic study of transforming data
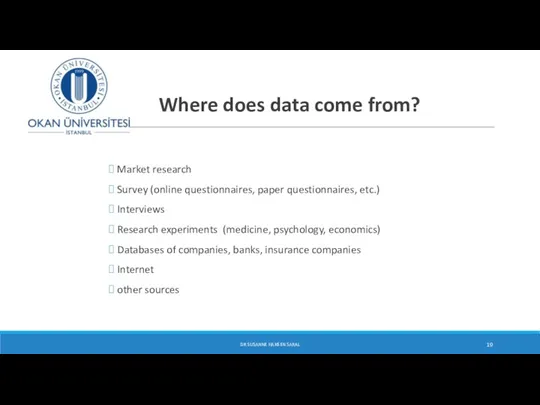
Where does data come from?
Market research
Survey (online questionnaires,
Where does data come from?
Market research
Survey (online questionnaires,
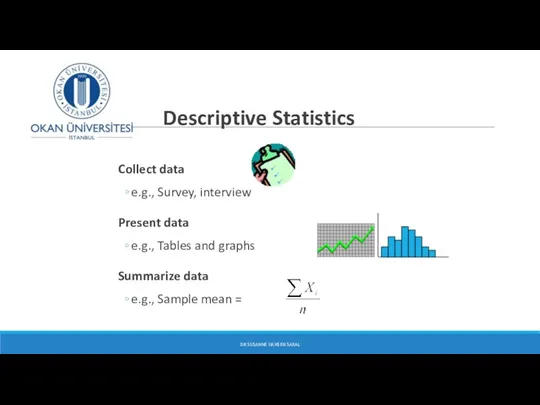
Descriptive Statistics
Collect data
e.g., Survey, interview
Present data
e.g., Tables and graphs
Summarize data
e.g., Sample
Descriptive Statistics
Collect data
e.g., Survey, interview
Present data
e.g., Tables and graphs
Summarize data
e.g., Sample

Create your account in
Khan Academy
Go to www.khanacademy.org create an
Create your account in
Khan Academy
Go to www.khanacademy.org create an
 Вписанная и описанная окружности
 Нахождение дроби от числа
 Задачи на построение. Геометрия. 7 класс
 Знакомство с задачами
 Решение уравнений. 2 класс. УМК Гармония
 Неопределённый интеграл, его свойства . Непосредственное интегрирование. Метод замены переменной в неопределенном интеграле
 Знакомим дошкольников с часами
 Развёртка прямоугольного параллелепипеда. Урок 143
 Кубизм в архитектуре. Оригами
 Фалес Милетский. Нахождение расстояния до недоступного предмета
 Сложение чисел с разными знаками» (проверочная работа)
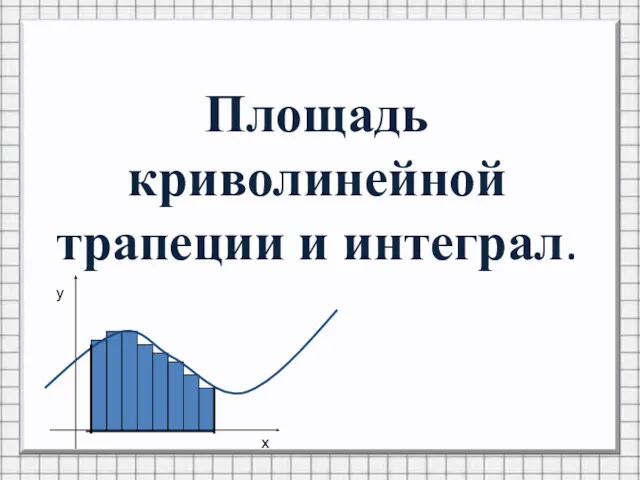 Площадь криволинейной трапеции и интеграл
 Решение систем, содержащих уравнения второй степени
 Осевая и центральная симметрия 8 класс
 Умножение и деление обыкновенных дробей
 Своя игра. 5 класс
 Луч и угол
 Презентация Занимательная геометрия
 Презентация Веселая математика с Винни-Пухом
 Прямоугольный параллелепипед
 Измерение углов. Транспортир. 5 класс
 Математика вокруг нас: форма, размер, цвет
 Конспект урока по математике Составные задачи 1 класс. (Программа Петерсон Л.Г.)
 Презентация по математике на тему Какие бывают алгоритмы
 Дидактическая игра Круги и квадраты (презентация)
 Подготовка к ВПР. Математика 3 задание. Арифметический метод
 Заниматика №3
 Способы решения логических задач