- Kim’s analysis

Содержание
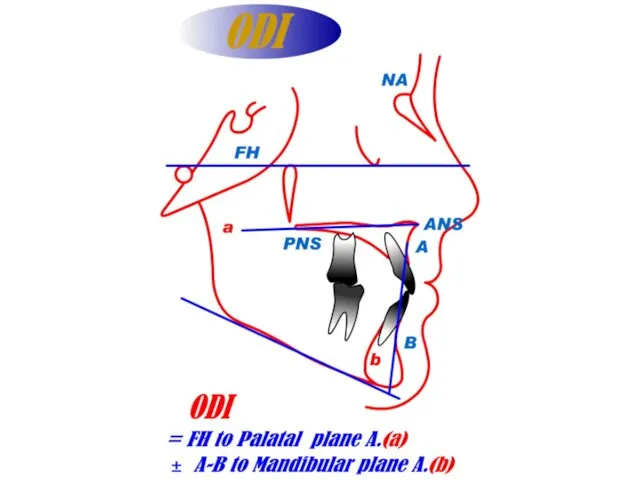
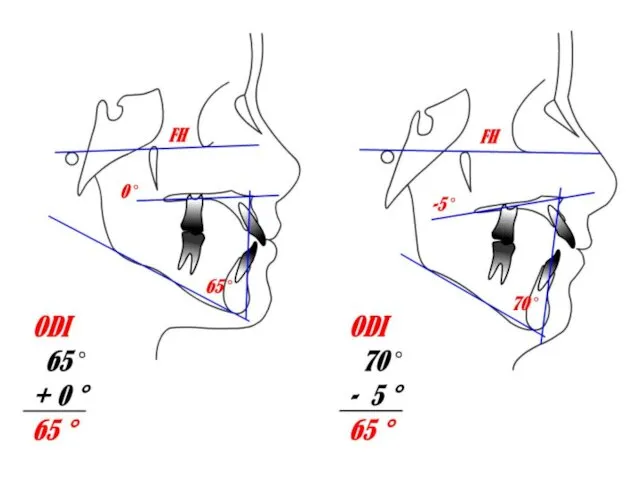
- 5. ODI Overbite Depth Indicator
- 6. Overbite Depth Indicator with particular reference to open-bite Young H. Kim Am. J. Orthod. 65:585-611, 1974
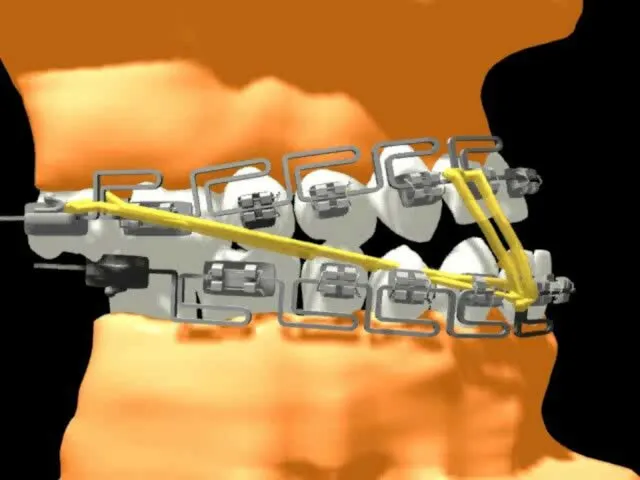
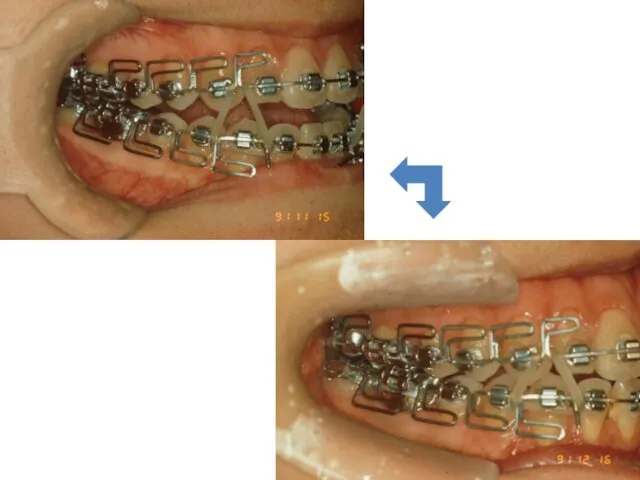
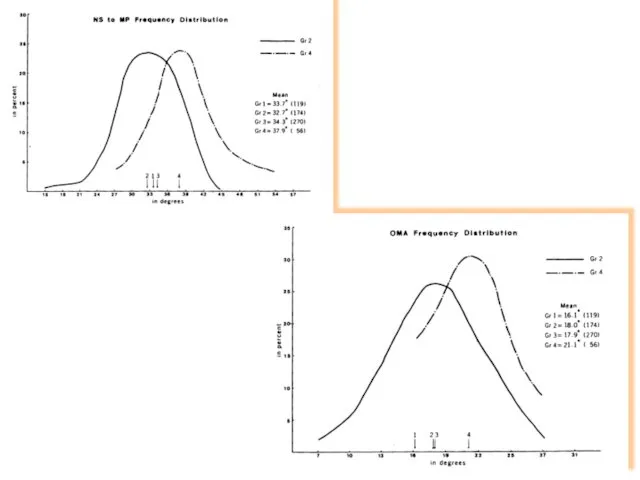
- 7. VERTICAL PROBLEM Gonial angle Mandibular plane angle (SN - MP, FMA) Occlusomandibular plane A. PFH /
- 8. Which one is overbite or openbite? Patient W.C. age 13.0 years FH to GoGn 34.0° NS
- 9. Normal occlusion sample Group 1 - age range : 7-14 years - Sample No. : 119
- 10. Untreated malocclusion sample Age range : 7-16 years Sample No. : 500 patients Group 2 (Deep
- 11. Correlation coefficient between the incisal overbite depth and various measurements obtained from 119 normal persons
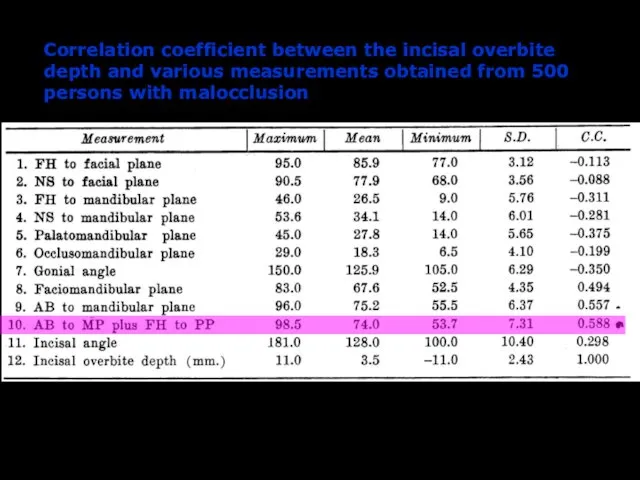
- 12. Correlation coefficient between the incisal overbite depth and various measurements obtained from 500 persons with malocclusion
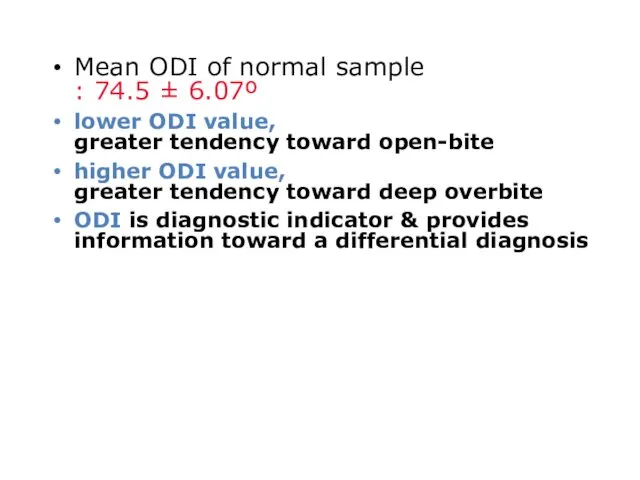
- 16. Mean ODI of normal sample : 74.5 ± 6.07º Lower ODI value, greater tendency toward open-bite
- 17. Which one is overbite or openbite? Patient W.C. age 13.0 years FH to GoGn 34.0° NS
- 18. ODI answer … Patient W.C. age 13.0 years FH to GoGn 34.0° NS to GoGn 35.0°
- 19. Lower ODI value, greater tendency toward open-bite
- 20. Higher ODI value, greater tendency toward deep overbite
- 21. Skeletal open-bite result of unfavorable skeletal pattern aggravated by thumb-sucking or tongue thrusting habits ODI :
- 22. skeletal deep-overbite unfavorable facial pattern acute palatomandibular plane angle lack of vertical dimension ODI : 80’s
- 24. Mean ODI of normal sample : 74.5 ± 6.07º lower ODI value, greater tendency toward open-bite
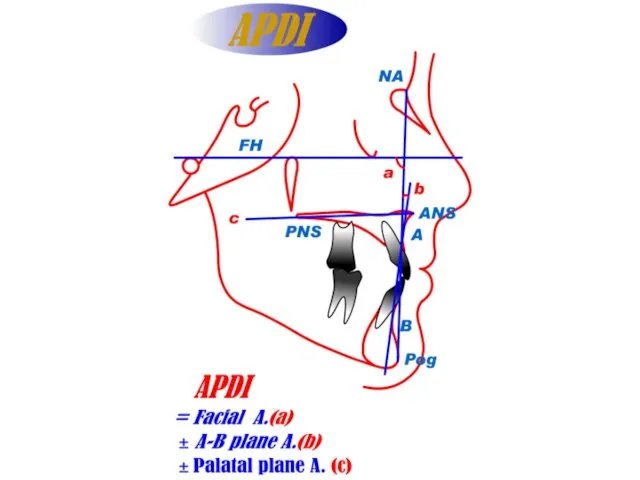
- 25. APDI Antero – Posterior Dysplasia Indicator
- 26. Anteroposterior Dysplasia Indicator : An adjunct Cephalometric differential diagnosis Young H. Kim, Am. J. Orthod. 73:619-633,
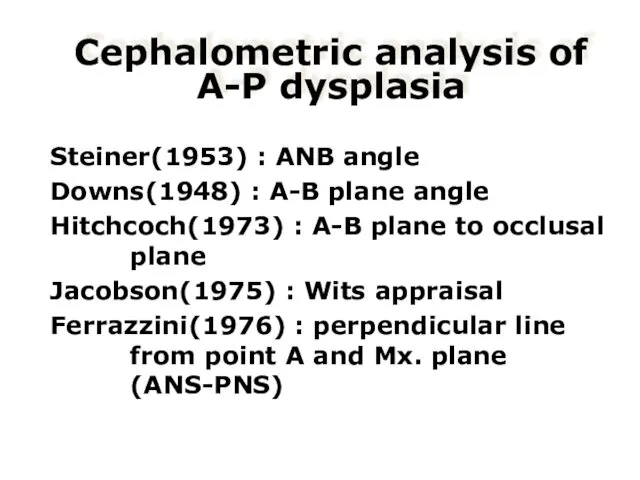
- 27. Cephalometric analysis of A-P dysplasia Steiner(1953) : ANB angle Downs(1948) : A-B plane angle Hitchcoch(1973) :
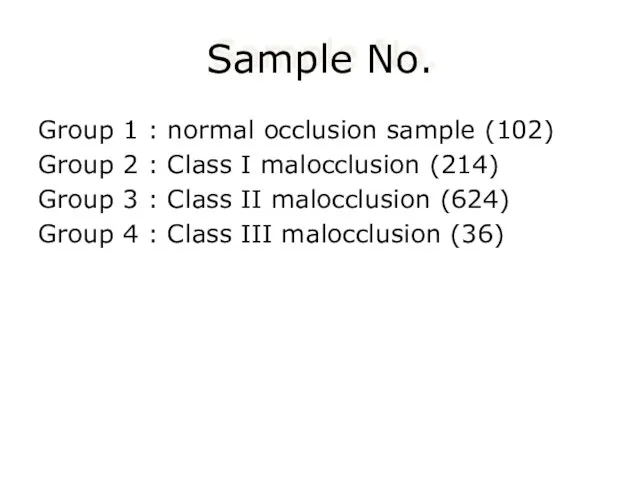
- 29. Sample No. Group 1 : normal occlusion sample (102) Group 2 : Class I malocclusion (214)
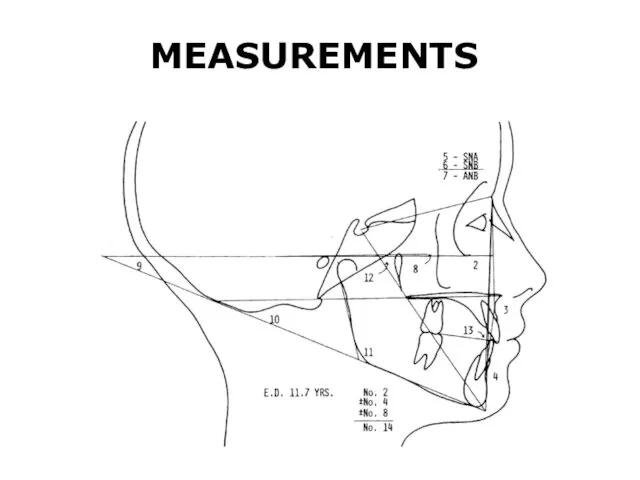
- 30. MEASUREMENTS
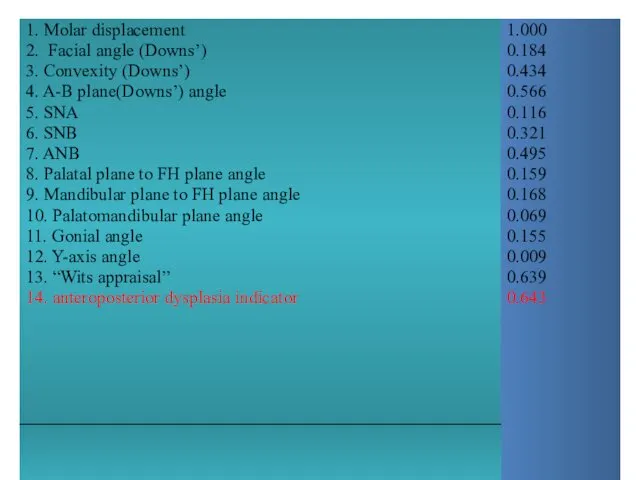
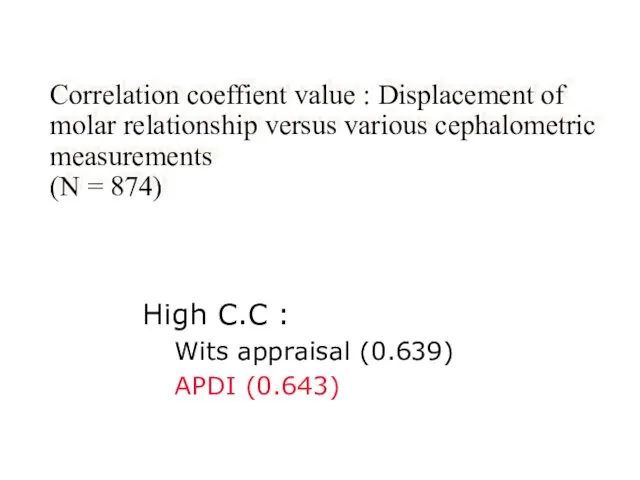
- 32. Correlation coeffient value : Displacement of molar relationship versus various cephalometric measurements (N = 874) High
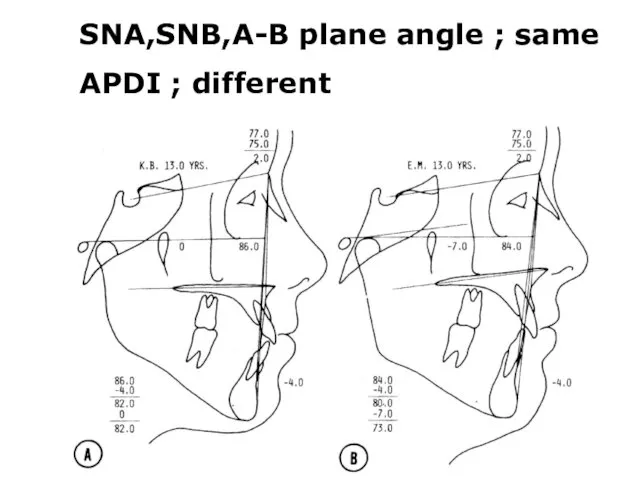
- 33. SNA,SNB,A-B plane angle ; same APDI ; different
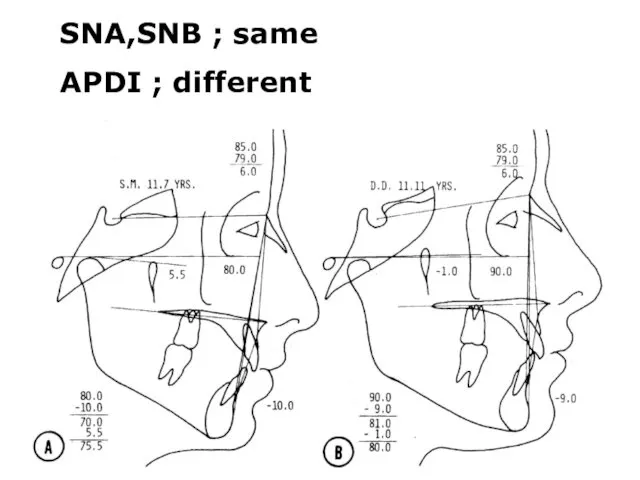
- 34. SNA,SNB ; same APDI ; different
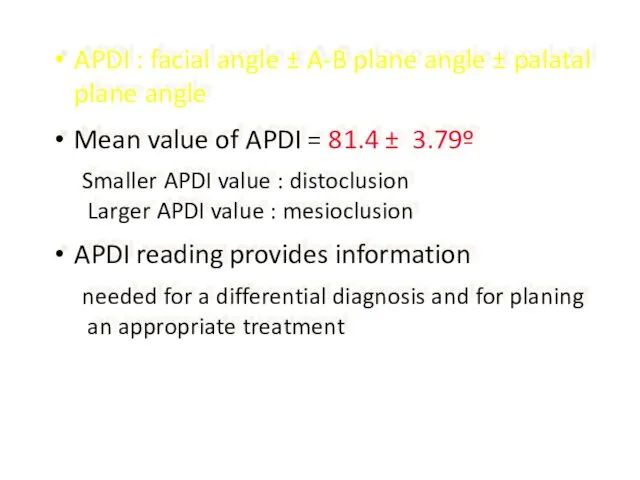
- 35. APDI : facial angle ± A-B plane angle ± palatal plane angle Mean value of APDI
- 37. Скачать презентацию

ODI
Overbite
Depth
Indicator
ODI
Overbite
Depth
Indicator
Overbite Depth Indicator with particular reference to open-bite
Young H. Kim
Am. J.
Overbite Depth Indicator with particular reference to open-bite
Young H. Kim
Am. J.
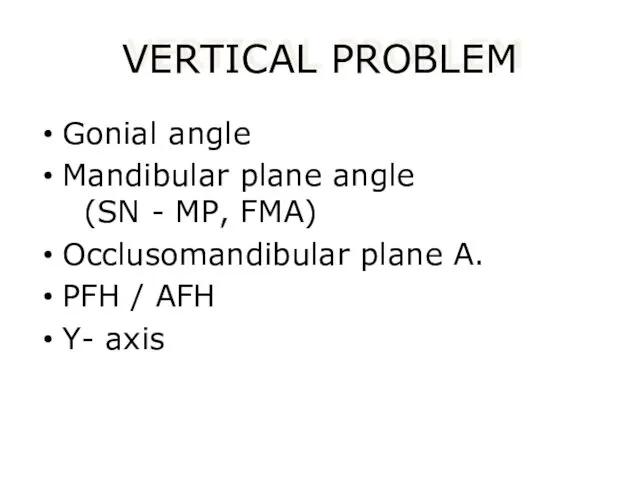
VERTICAL PROBLEM
Gonial angle
Mandibular plane angle (SN - MP, FMA)
Occlusomandibular plane A.
PFH
VERTICAL PROBLEM
Gonial angle
Mandibular plane angle (SN - MP, FMA)
Occlusomandibular plane A.
PFH
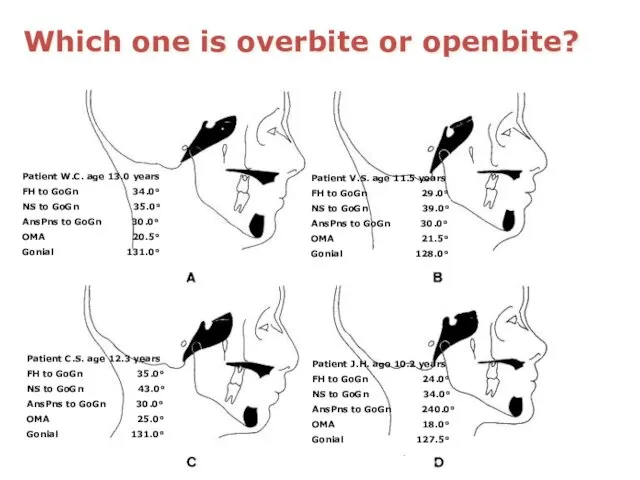
Which one is overbite or openbite?
Patient W.C. age 13.0 years
FH to
Which one is overbite or openbite?
Patient W.C. age 13.0 years
FH to
Normal occlusion sample
Group 1
- age range : 7-14 years
- Sample No.
Normal occlusion sample
Group 1
- age range : 7-14 years
- Sample No.
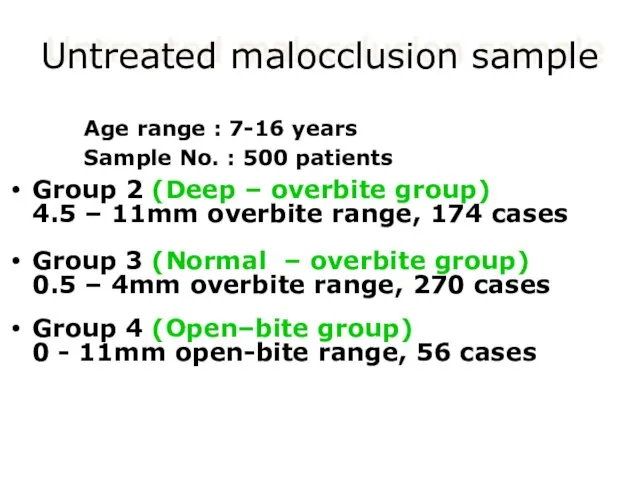
Untreated malocclusion sample
Age range : 7-16 years
Sample No. :
Untreated malocclusion sample
Age range : 7-16 years
Sample No. :
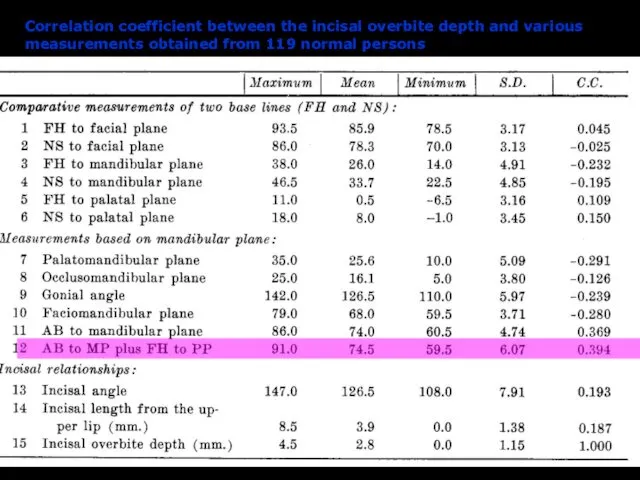
Correlation coefficient between the incisal overbite depth and various measurements obtained
Correlation coefficient between the incisal overbite depth and various measurements obtained
Correlation coefficient between the incisal overbite depth and various measurements obtained
Correlation coefficient between the incisal overbite depth and various measurements obtained
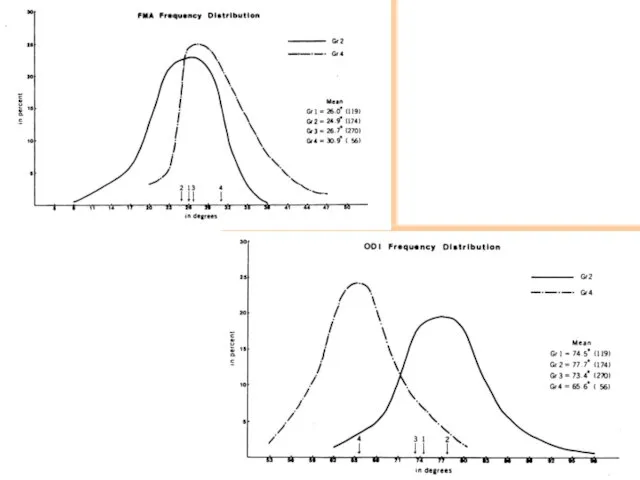
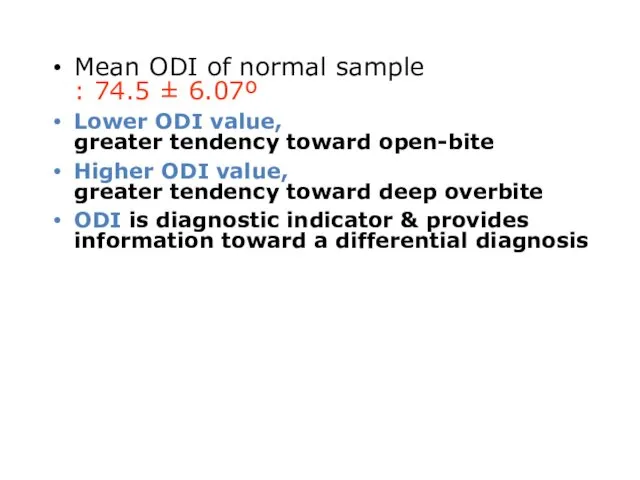
Mean ODI of normal sample
: 74.5 ± 6.07º
Lower ODI value,
greater
Mean ODI of normal sample
: 74.5 ± 6.07º
Lower ODI value,
greater

Which one is overbite or openbite?
Patient W.C. age 13.0 years
FH to
Which one is overbite or openbite?
Patient W.C. age 13.0 years
FH to
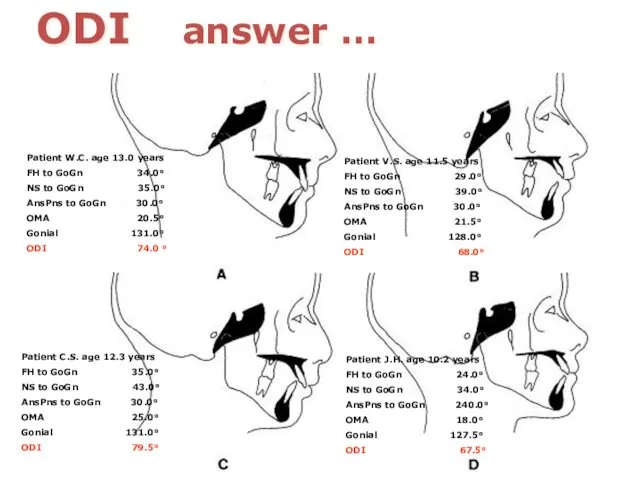
ODI answer …
Patient W.C. age 13.0 years
FH to GoGn 34.0°
NS to
ODI answer …
Patient W.C. age 13.0 years
FH to GoGn 34.0°
NS to
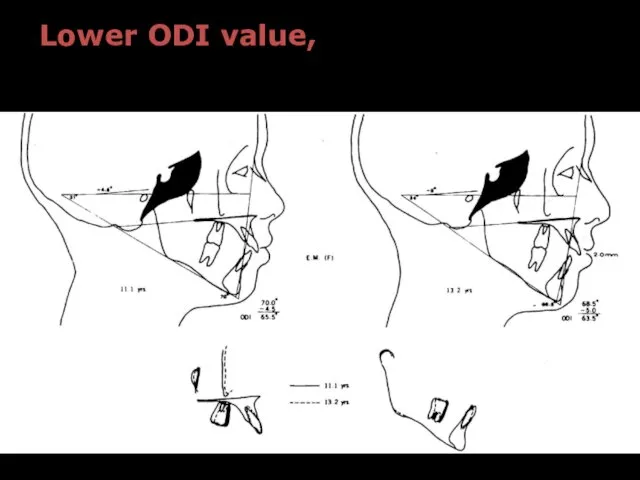
Lower ODI value,
greater tendency toward open-bite
Lower ODI value,
greater tendency toward open-bite
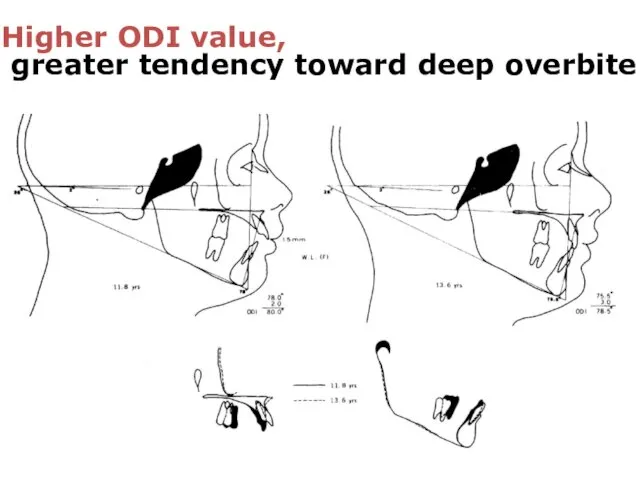
Higher ODI value,
greater tendency toward deep overbite
Higher ODI value,
greater tendency toward deep overbite
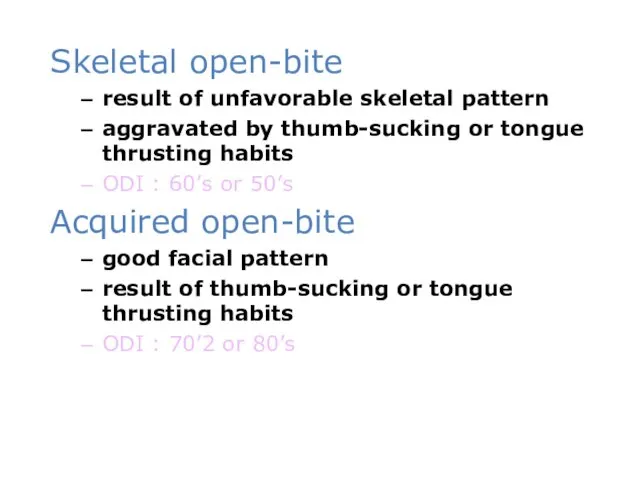
Skeletal open-bite
result of unfavorable skeletal pattern
aggravated by thumb-sucking or tongue thrusting
Skeletal open-bite
result of unfavorable skeletal pattern
aggravated by thumb-sucking or tongue thrusting
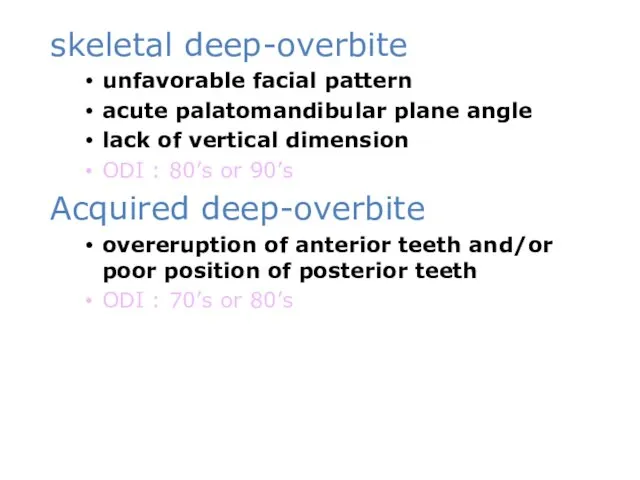
skeletal deep-overbite
unfavorable facial pattern
acute palatomandibular plane angle
lack of vertical dimension
ODI :
skeletal deep-overbite
unfavorable facial pattern
acute palatomandibular plane angle
lack of vertical dimension
ODI :
Mean ODI of normal sample
: 74.5 ± 6.07º
lower ODI value,
greater
Mean ODI of normal sample
: 74.5 ± 6.07º
lower ODI value,
greater
APDI
Antero –
Posterior
Dysplasia
Indicator
APDI
Antero –
Posterior
Dysplasia
Indicator
Anteroposterior Dysplasia Indicator
: An adjunct Cephalometric differential diagnosis
Young H. Kim,
Am. J.
Anteroposterior Dysplasia Indicator
: An adjunct Cephalometric differential diagnosis
Young H. Kim,
Am. J.
Cephalometric analysis of A-P dysplasia
Steiner(1953) : ANB angle
Downs(1948) : A-B plane
Cephalometric analysis of A-P dysplasia
Steiner(1953) : ANB angle
Downs(1948) : A-B plane
Sample No.
Group 1 : normal occlusion sample (102)
Group 2 : Class
Sample No.
Group 1 : normal occlusion sample (102)
Group 2 : Class
MEASUREMENTS
MEASUREMENTS
Correlation coeffient value : Displacement of molar relationship versus various cephalometric
Correlation coeffient value : Displacement of molar relationship versus various cephalometric
SNA,SNB,A-B plane angle ; same
APDI ; different
SNA,SNB,A-B plane angle ; same
APDI ; different
SNA,SNB ; same
APDI ; different
SNA,SNB ; same
APDI ; different
APDI : facial angle ± A-B plane angle ± palatal plane
APDI : facial angle ± A-B plane angle ± palatal plane
 Физиология и патология периода новорожденности
 Технология изготовления полных съёмных пластиночных протезов при полном отсутствии зубов с использованием современных материалов
 Экстракорпоральное оплодотворение
 ХСН: причины, классификация, консервативное лечение
 Қан плазмасының азотты органикалық құрам бөліктері және оларды анықтаудың клиникалық маңызы
 Заболевания плевры. Плевриты
 Особенности препарирования кариозных полостей по Блэку
 Гражданско-правовая ответственность медицинских работников
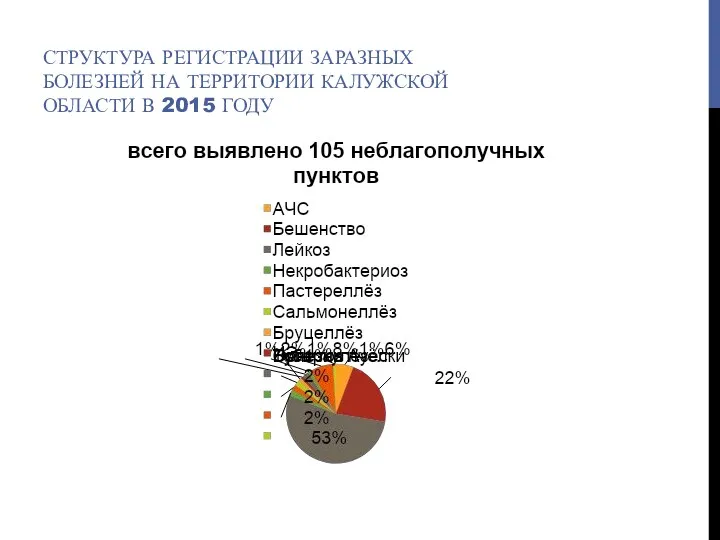 Структура регистрации заразных болезней на территории Калужской области в 2015 году
 Мүгедектік деген не
 Инфекционный контроль
 Маточные кровотечения как ургентное состояние. Дифференциальная диагностика
 Грипп и ОРВИ
 Аллергия или гиперчувствительность
 Рассеянный склероз
 Дети с нарушениями функций опорно-двигательного аппарата
 План исследования больного при заболеваниях системы дыхания
 Запальні захворювання жіночих статевих органів
 Тұрақты электротоктардың медицинада қолданылуы
 Дезагрегантная терапия острого коронарного синдрома на реанимационном этапе
 Острые отравления хлорпирофосом
 Онтогенез. Определение понятия
 Психогения - кратковременная реакция или длительное состояние (болезнь), возникающие вследствие психотравмы
 Стоматология. Диагностика
 Диагностика заболеваний эндокринной системы. Диагностика сахарного диабета. Диагностика диффузно-токсического зоба
 Различные методики нейровизуализации в неврологии
 Психотропные средства. Нейролептики. Транквилизаторы. Седативные средства
 Клинический разбор