- The importance of anthropometrics and somatoscopy assessment in childhood

Содержание
- 2. Physical development of different age groups children. Semiotics of the developmental abnormalites.
- 3. The importance of anthropometrics and somatoscopy in childhood. It is well known that the pediatricians weight
- 4. Growth assessment is an essential component of pediatric health surveillance. Many biophysiologic and psychosocial problems can
- 5. Following to practical purposes it is considered that the growth process means the increase of the
- 6. The main Goal of Pediatrics is bolted in Declarations of the Children Rights (Helsinki, 1977): “to
- 7. The below characteristics enter In “the physical development" notion.
- 8. Physical developmental characteristics - Growth or stature In anthropomethric and methrological sense the Grouth is an
- 9. Physical development characteristics – the body weigh (mass) The human body mass is quantity of anatomical
- 10. Physical development characteristics – the head and chest circumferences This parameters are measured due to the
- 11. The human body proportion changes in ontogenesis
- 12. The Physical development as a dynamic process must be defined as a progression of the human
- 13. All children must have their individual graphs of physical development basing on which the medical observation
- 14. What have we know about anthropometric investigations in children?
- 15. To know the current body length/height, head circumference and body weight they have to be measured
- 16. It is necessary to measure the weight as often as it is possible. Suddenly the results
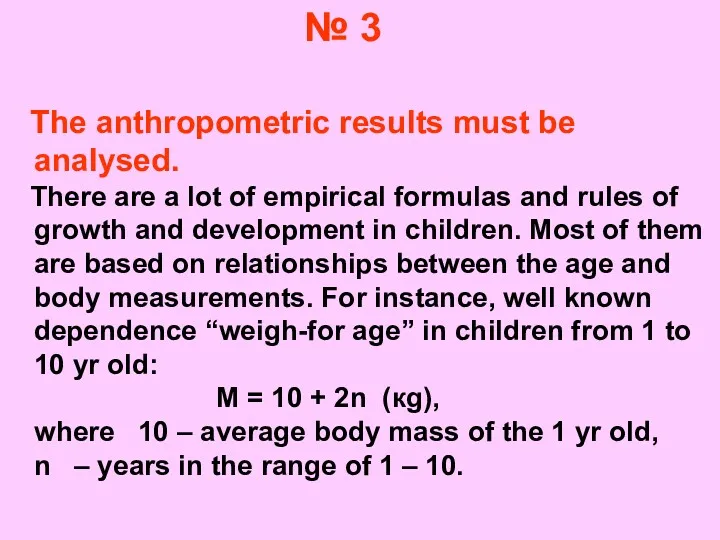
- 17. The anthropometric results must be analysed. There are a lot of empirical formulas and rules of
- 18. Never forget about statistics! It is considered that the most efficient method is the method founded
- 19. In estimation of the results of anthropometry the most correct conclusions can be made on basis
- 20. What is a percentile? Relationship between percentile lines on the growth curve and frequency distributions of
- 21. If to build a graph having the child age postponed on horizontal axis and the anthropometric
- 22. Haw to use percentile tablas?
- 23. To respect gender differences, age and chosen anthropometric boys
- 24. To respect the gender differences, age and chosen anthropometry To set the growth (body length) value
- 25. To respect the gender differences, age and chosen anthropometric To set the growth (body length) value
- 26. Classification of percentile values 50 – percentile – middle line 25 – 75 percentiles – area
- 27. Symptomatic area
- 28. Haw to build an individual graph of grow?
- 29. The individual graph of grow can be belt setting the anthropometric data directly on the percentile
- 30. Estimations of the growth by means of the standard deviations method The rates of growth in
- 31. at.14 Median SD +2 SD -2 SD -3 SD +3 Weight-for-age curves in boys aged 0
- 32. What do the SD lines mean? The line 0 on every graph is being the median
- 33. The interference of genetic and environmental factors ensuring the physical development in children. Empathy
- 34. The interference of genetic and environmental factors ensuring the physical development in children. Behavioral reactions and
- 35. Physical development in children of the different age and its semiotics
- 36. Growth during the gestation
- 37. Gastation is the synonym of pregnancy (gesto lat. – to carry, to be pregnant, in utero
- 38. Body length of the fetus with gestational term > 5 mo. L=10•LS-14 , where: L is
- 39. Weight-to-length coefficient in newborns For well newborns there is the close correlation between Weight (Wt,g) and
- 40. Developmental abnormalities in fetuses One of the most important signs is the intrauterinal growth delay.
- 41. The causes of the intrauterinal growth delay are: 1. Chromosomal diseases. 2. Inborn infections. 3. Placenta
- 42. Proportional growth delay is related with chromosomal diseases due to common body cells insufficiency in fetus
- 43. Disproportional growth delay is related with diseases due to common or partial skeleton abnormalities The girl
- 44. Disproportional growth delay or “spindly child” is related with maternal causes especially with placenta insufficiency. As
- 45. The infants big for date of gestation The boy was born at 39 week of gestation
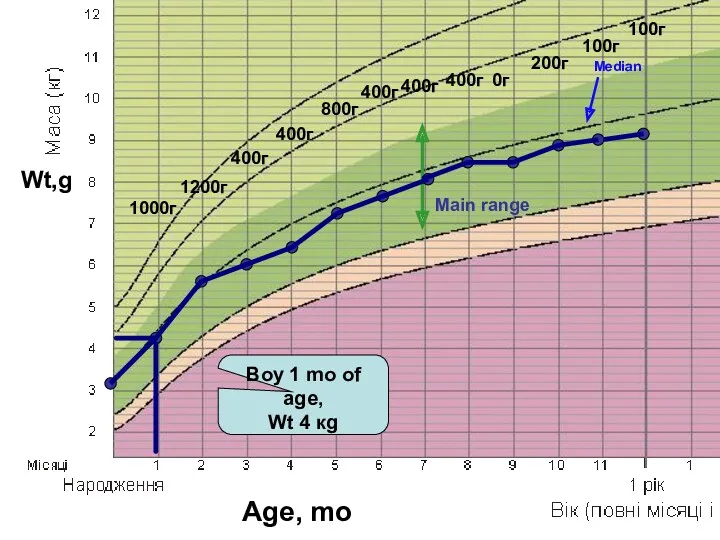
- 46. Physical development in children of the different age The growth of the early age children (ad
- 47. Weight loss in first few days: 5-10% of BWt (birth weight). Return to BWt: 7 –
- 48. The early childhood must be defined as a very quick but progressively fading growth.
- 49. Median Main range Boy 1 mo of age, Wt 4 кg 1000г 1200г 400г 400г 800г
- 50. Semiotics of physical developmental abnormalities
- 51. Weight achievement delay, deficiency of thrive, hypotrophy, underfeeding, underwaight, alimentary marasmus
- 52. Median Underweight Normal Extremely low weight + boy 18 mo old, Wt 6.8 kg Weight-to-age chart
- 53. Growth delay in height (short stature, dwarfism proportional or disproportional) The girl was born L= 43
- 54. Median Growth delay Normalrange Extremely short stature + + Stature cm Age, mo Stature-to-age chart in
- 55. Physical development in children of the different age The growth of the children aged 3 –
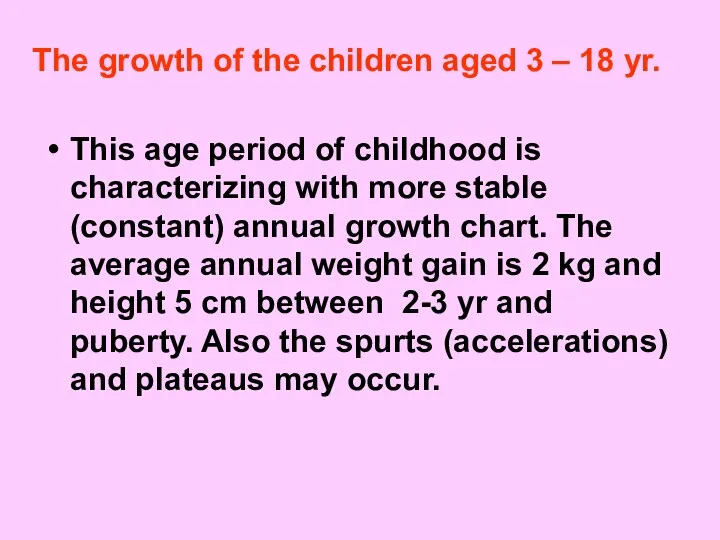
- 56. This age period of childhood is characterizing with more stable (constant) annual growth chart. The average
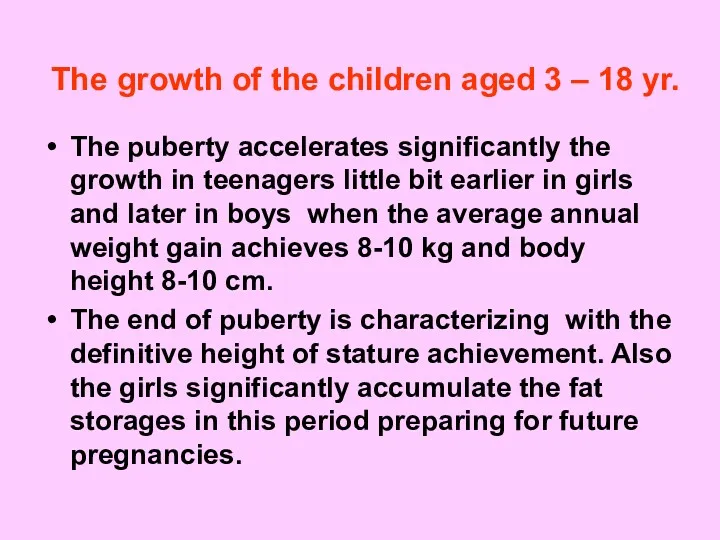
- 57. The growth of the children aged 3 – 18 yr. The puberty accelerates significantly the growth
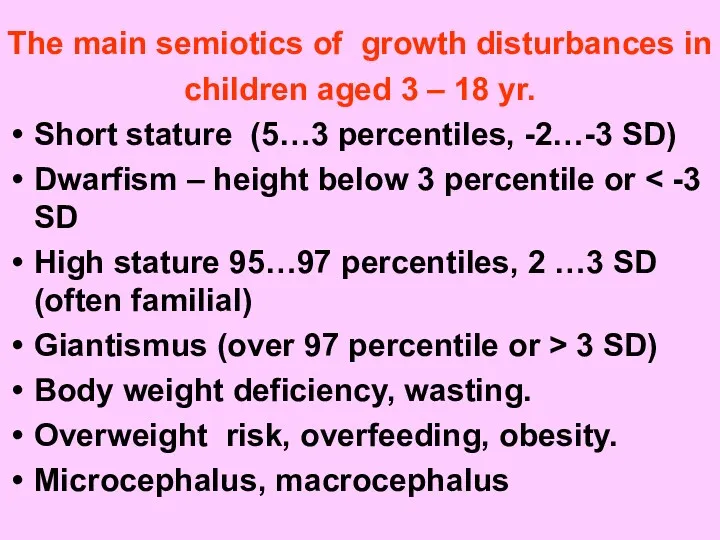
- 58. The main semiotics of growth disturbances in children aged 3 – 18 yr. Short stature (5…3
- 59. Overfeeding, owerweight, obesity Semiotics of this condition are the subcutaneous fat increasing and abnormally high anthropometrics
- 60. Body-Weight index is essential for obesity evaluation . Obesity in young children – BWi > 20
- 61. Median Underfeeding Normal Alimentary marasmus Risk of overweight Overweight Obesity Wt,kg Stature, cm Weight-to-height correlation +
- 63. 1.How to know the child` body waight? A. To ask a colleague To use formula To
- 64. 2. Often the children born by diabetic mothers are: Severe premature Severe post termed Slim, spindly
- 65. Weight Weight loss in first few days: 5-10% of BWt (birth weight). Return to BWt: 7
- 67. Скачать презентацию
Physical development of different age groups children. Semiotics of the developmental
Physical development of different age groups children. Semiotics of the developmental
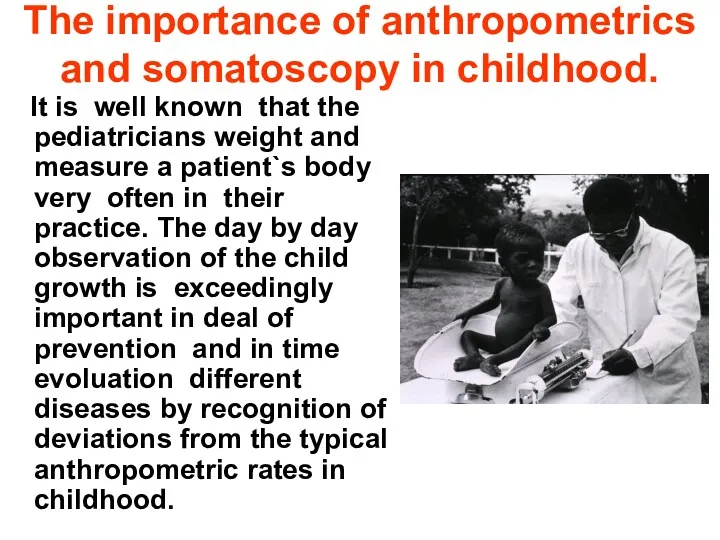
The importance of anthropometrics and somatoscopy in childhood.
It is
The importance of anthropometrics and somatoscopy in childhood.
It is
Growth assessment is an essential component of pediatric health surveillance. Many
Growth assessment is an essential component of pediatric health surveillance. Many
Following to practical purposes it is considered that the growth process
Following to practical purposes it is considered that the growth process
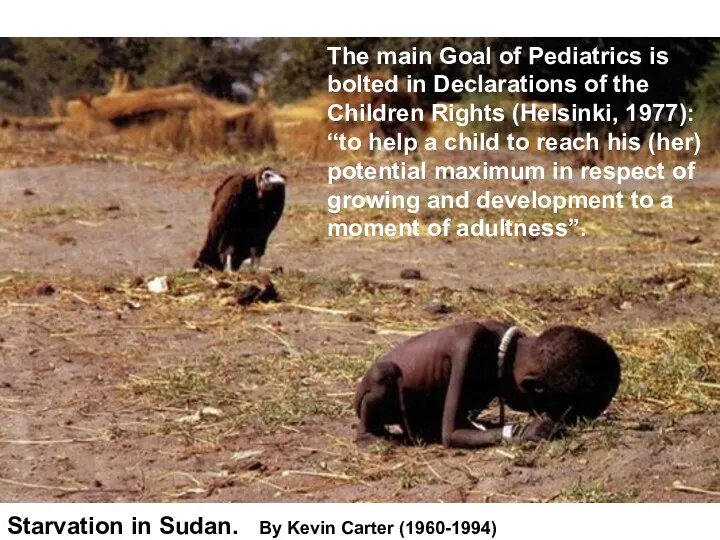
The main Goal of Pediatrics is bolted in Declarations of the
The main Goal of Pediatrics is bolted in Declarations of the
The below characteristics enter In “the physical development" notion.
The below characteristics enter In “the physical development" notion.
Physical developmental characteristics - Growth or stature
In anthropomethric and methrological sense
Physical developmental characteristics - Growth or stature
In anthropomethric and methrological sense
Physical development characteristics – the body weigh (mass)
The human body
Physical development characteristics – the body weigh (mass)
The human body
Physical development characteristics – the head and chest circumferences
This
Physical development characteristics – the head and chest circumferences
This
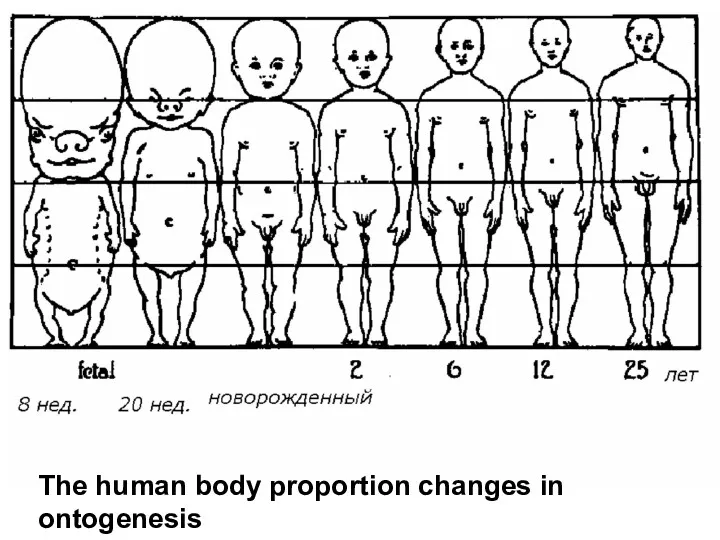
The human body proportion changes in ontogenesis
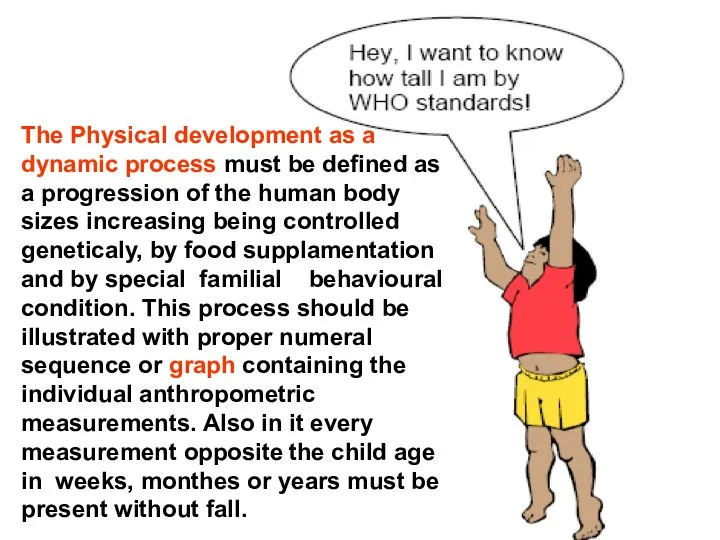
The Physical development as a dynamic process must be defined as
The Physical development as a dynamic process must be defined as
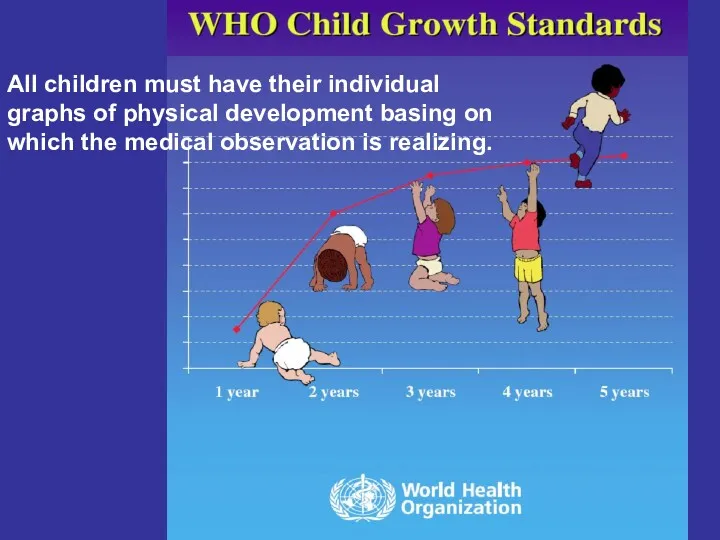
All children must have their individual graphs of physical development basing
All children must have their individual graphs of physical development basing
What have we know about anthropometric investigations in children?
To know the current body length/height, head circumference and body
To know the current body length/height, head circumference and body
It is necessary to measure the weight as often as it
The anthropometric results must be analysed.
There are a
The anthropometric results must be analysed.
There are a
Never forget about statistics!
It is considered that the
Never forget about statistics!
It is considered that the

In estimation of the results of anthropometry the most
In estimation of the results of anthropometry the most
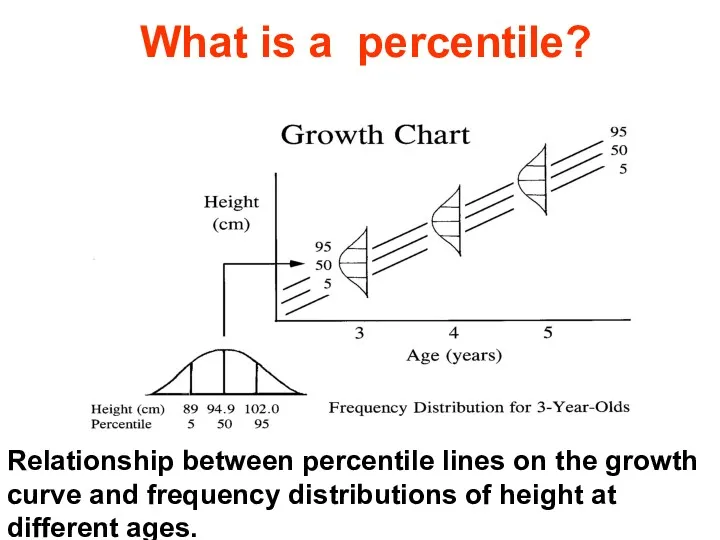
What is a percentile?
Relationship between percentile lines on the growth
What is a percentile?
Relationship between percentile lines on the growth
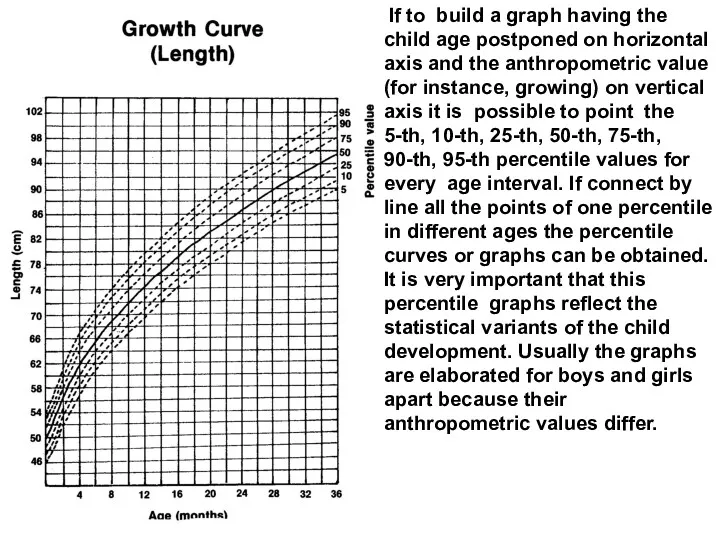
If to build a graph having the child age postponed
If to build a graph having the child age postponed
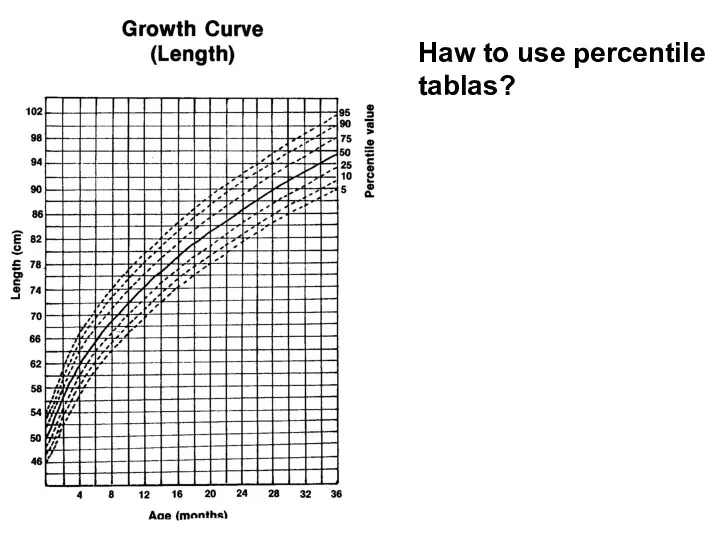
Haw to use percentile tablas?
Haw to use percentile tablas?
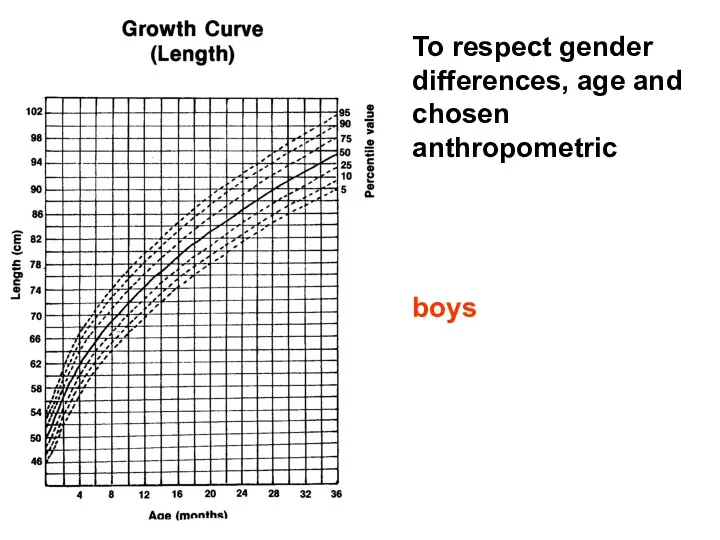
To respect gender differences, age and chosen anthropometric
boys
To respect gender differences, age and chosen anthropometric
boys
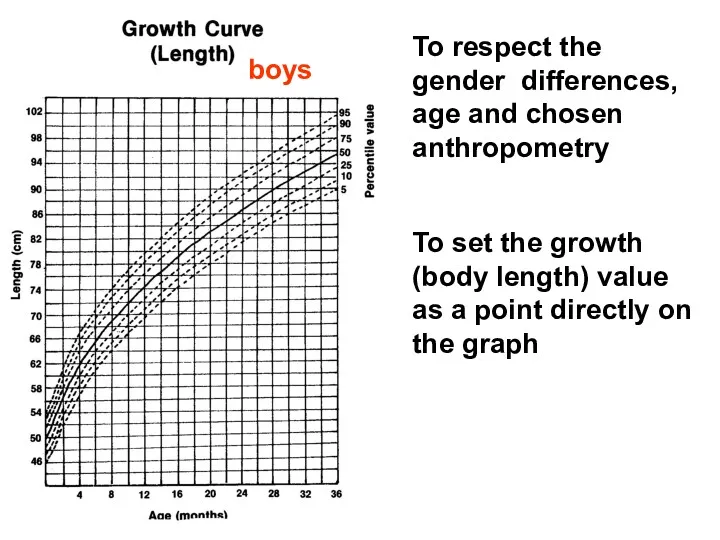
To respect the gender differences, age and chosen anthropometry
To set the
To respect the gender differences, age and chosen anthropometry
To set the
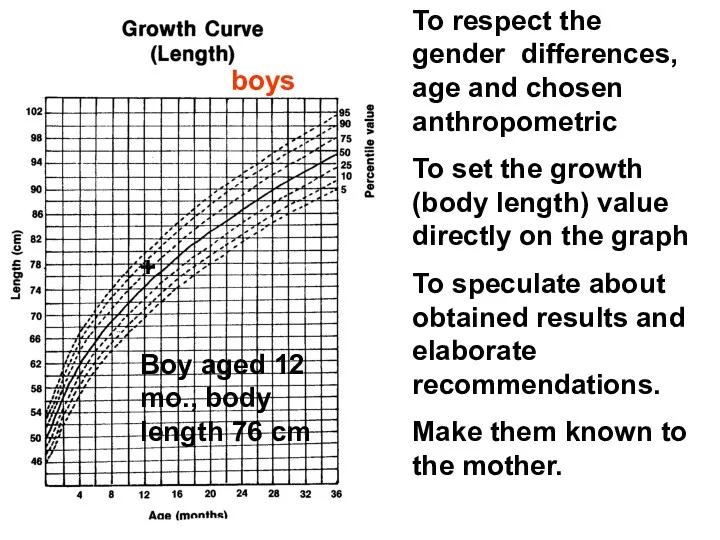
To respect the gender differences, age and chosen anthropometric
To set the
To respect the gender differences, age and chosen anthropometric
To set the
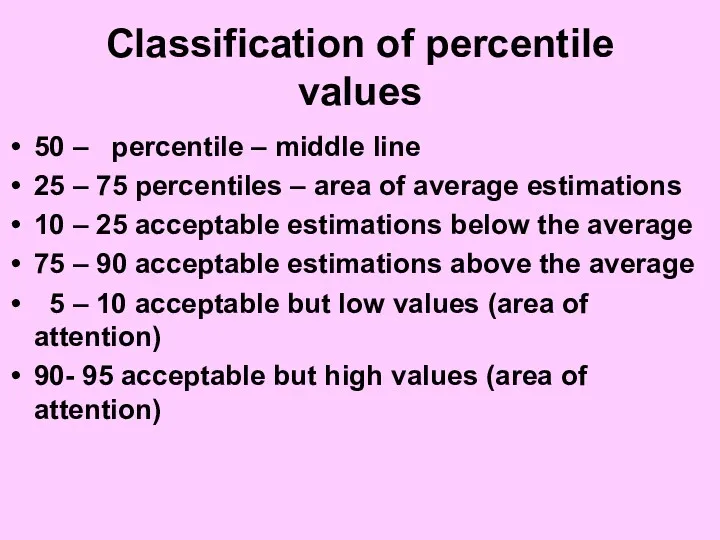
Classification of percentile values
50 – percentile – middle line
25 – 75
Classification of percentile values
50 – percentile – middle line
25 – 75
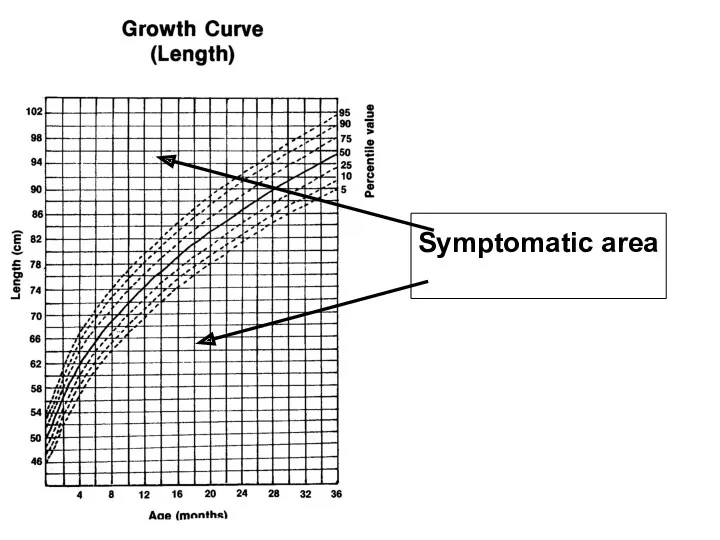
Symptomatic area
Symptomatic area
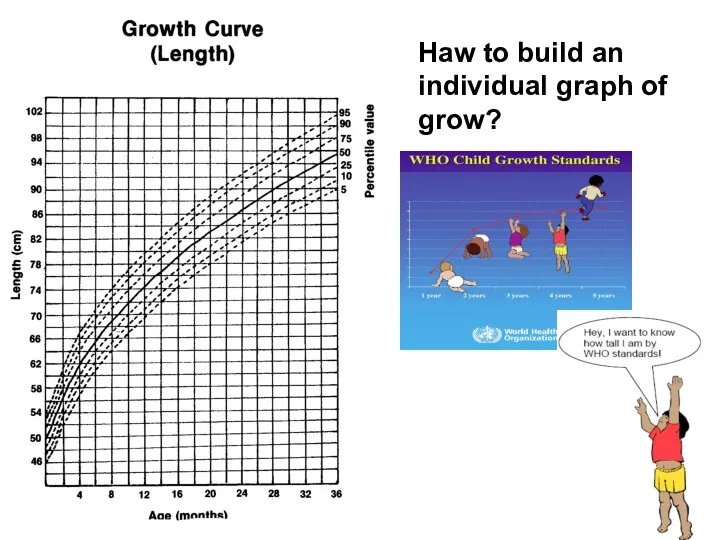
Haw to build an individual graph of grow?
Haw to build an individual graph of grow?
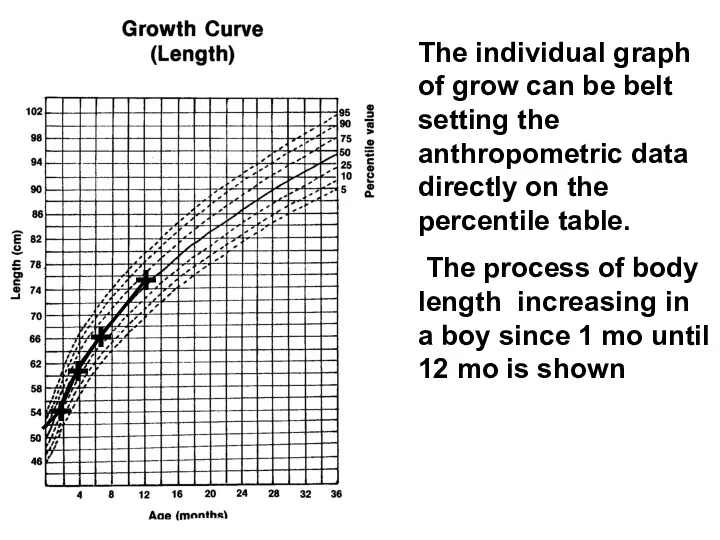
The individual graph of grow can be belt setting the anthropometric
The individual graph of grow can be belt setting the anthropometric
Estimations of the growth by means of the standard deviations method
Estimations of the growth by means of the standard deviations method
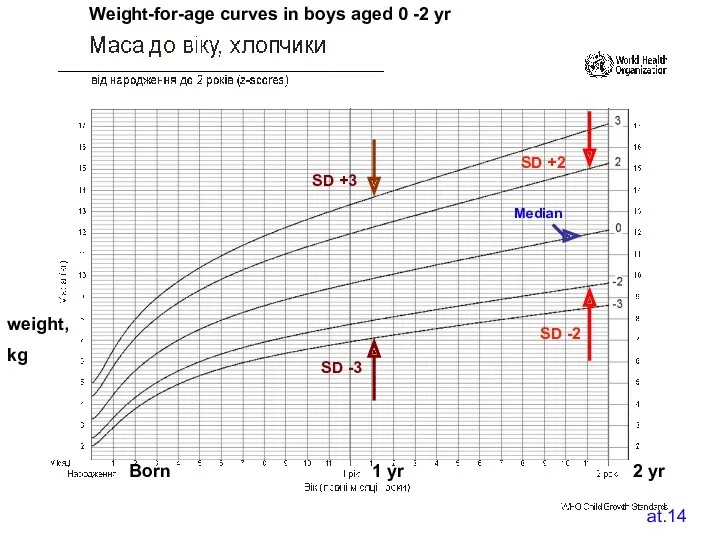
at.14
Median
SD +2
SD -2
SD -3
SD +3
Weight-for-age curves
at.14
Median
SD +2
SD -2
SD -3
SD +3
Weight-for-age curves
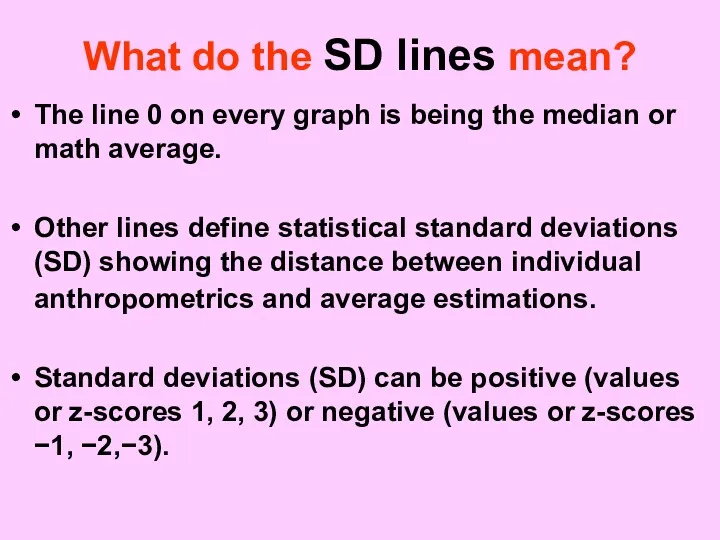
What do the SD lines mean?
The line 0 on every
What do the SD lines mean?
The line 0 on every
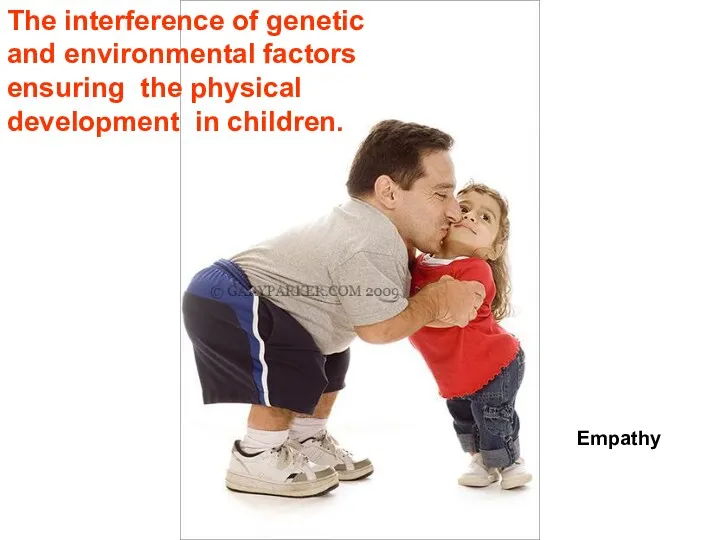
The interference of genetic and environmental factors ensuring the physical development
The interference of genetic and environmental factors ensuring the physical development
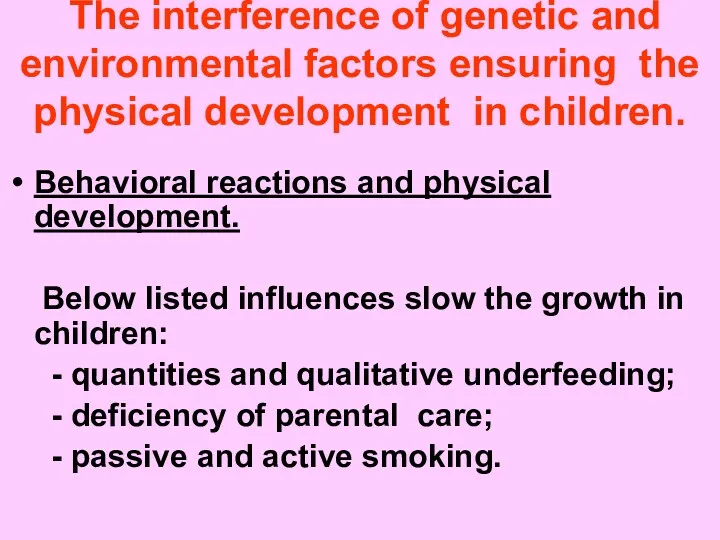
The interference of genetic and environmental factors ensuring the physical
The interference of genetic and environmental factors ensuring the physical
Physical development in children of the different age and its
Physical development in children of the different age and its
Growth during the gestation
Growth during the gestation
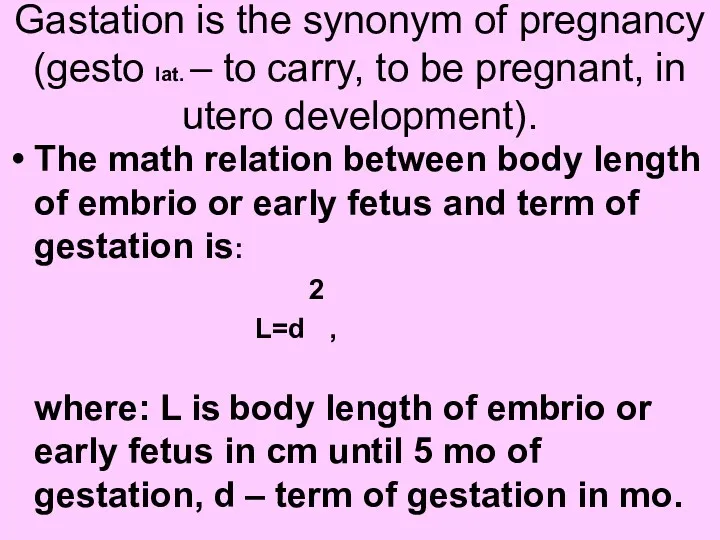
Gastation is the synonym of pregnancy (gesto lat. – to carry,
Gastation is the synonym of pregnancy (gesto lat. – to carry,
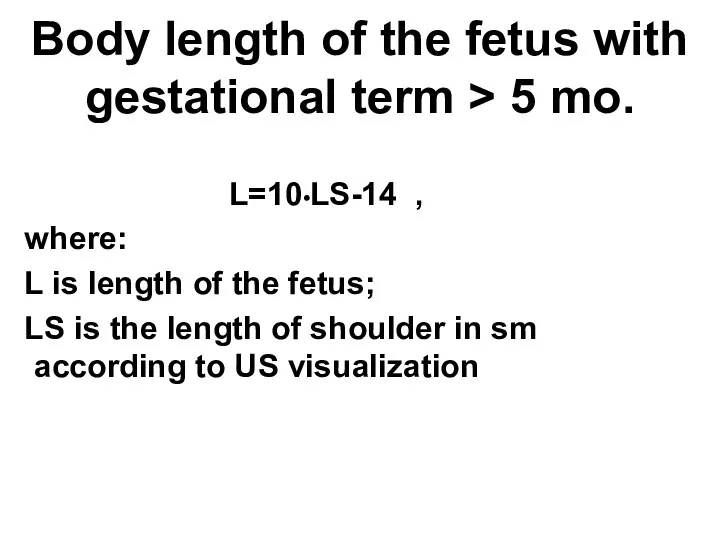
Body length of the fetus with gestational term > 5 mo.
Body length of the fetus with gestational term > 5 mo.
Weight-to-length coefficient in newborns
For well newborns there is the close
Weight-to-length coefficient in newborns
For well newborns there is the close
Developmental abnormalities in fetuses
One of the most important signs is
Developmental abnormalities in fetuses
One of the most important signs is
The causes of the intrauterinal growth delay are:
1. Chromosomal diseases.
2. Inborn
The causes of the intrauterinal growth delay are:
1. Chromosomal diseases.
2. Inborn
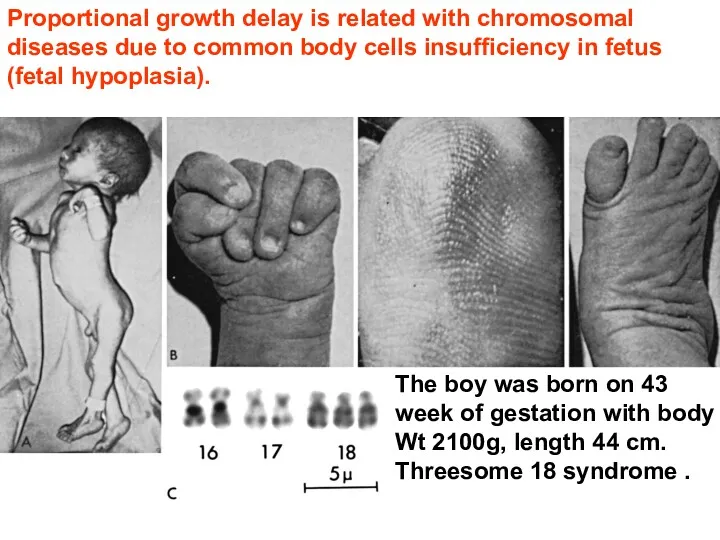
Proportional growth delay is related with chromosomal diseases due to common
Proportional growth delay is related with chromosomal diseases due to common
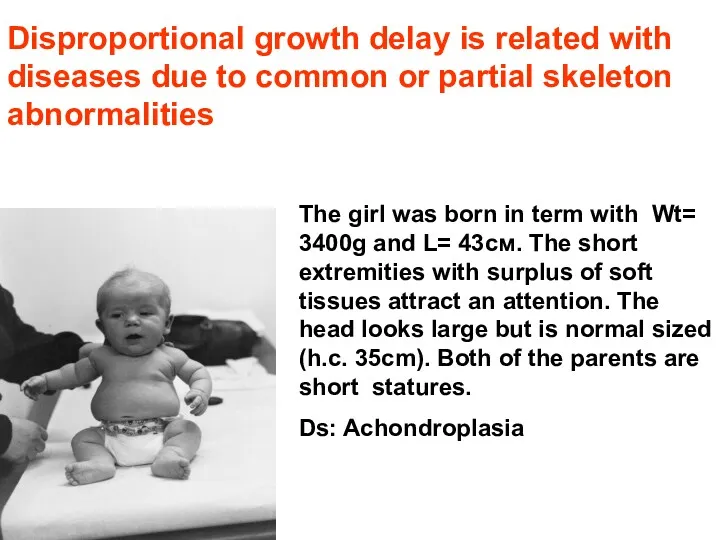
Disproportional growth delay is related with diseases due to common or
Disproportional growth delay is related with diseases due to common or
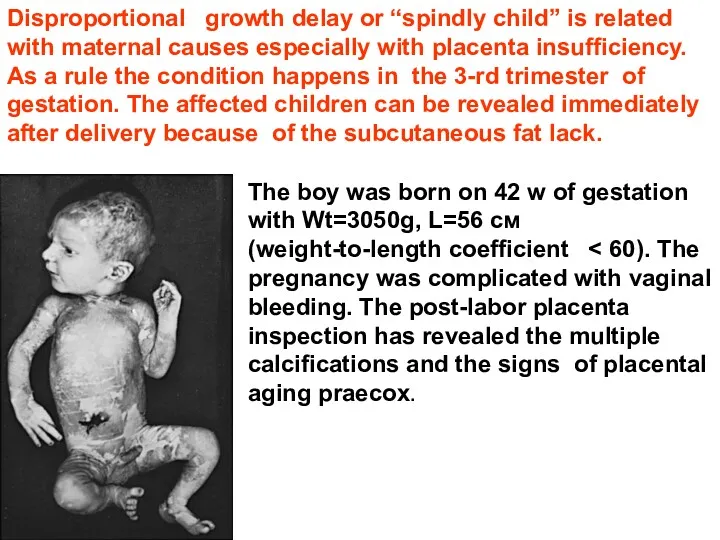
Disproportional growth delay or “spindly child” is related with maternal causes
Disproportional growth delay or “spindly child” is related with maternal causes
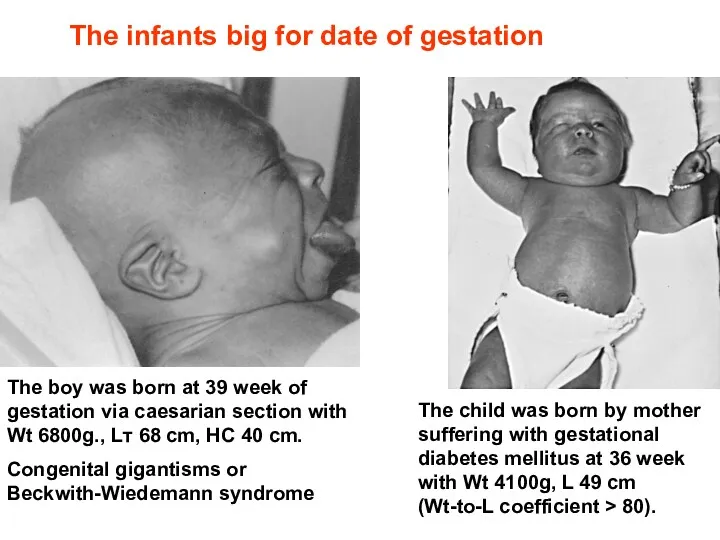
The infants big for date of gestation
The boy was
The infants big for date of gestation
The boy was
Physical development in children of the different age
The growth
Physical development in children of the different age
The growth
Weight loss in first few days: 5-10% of BWt (birth weight).
Weight loss in first few days: 5-10% of BWt (birth weight).
The early childhood must be defined as a very quick but
The early childhood must be defined as a very quick but
Median
Main range
Boy 1 mo of age,
Wt 4 кg
1000г
1200г
400г
400г
800г
400г
400г
400г
0г
200г
100г
100г
Wt,g
Age, mo
Median
Main range
Boy 1 mo of age,
Wt 4 кg
1000г
1200г
400г
400г
800г
400г
400г
400г
0г
200г
100г
100г
Wt,g
Age, mo
Semiotics of physical developmental abnormalities
Semiotics of physical developmental abnormalities
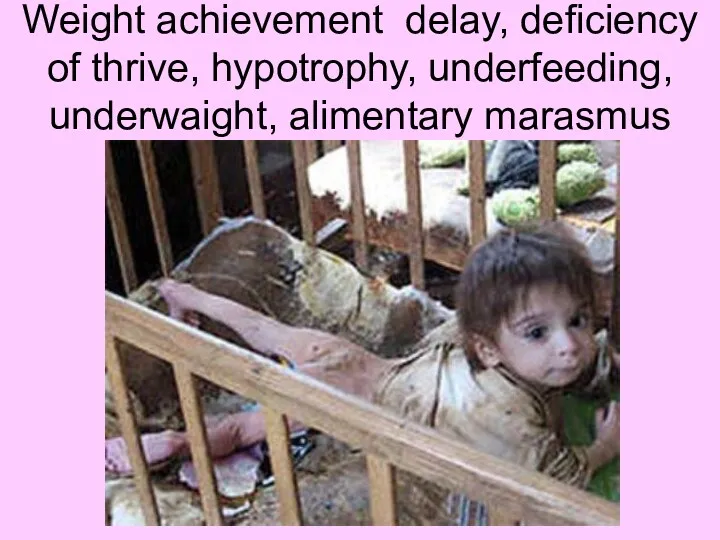
Weight achievement delay, deficiency of thrive, hypotrophy, underfeeding, underwaight, alimentary marasmus
Weight achievement delay, deficiency of thrive, hypotrophy, underfeeding, underwaight, alimentary marasmus
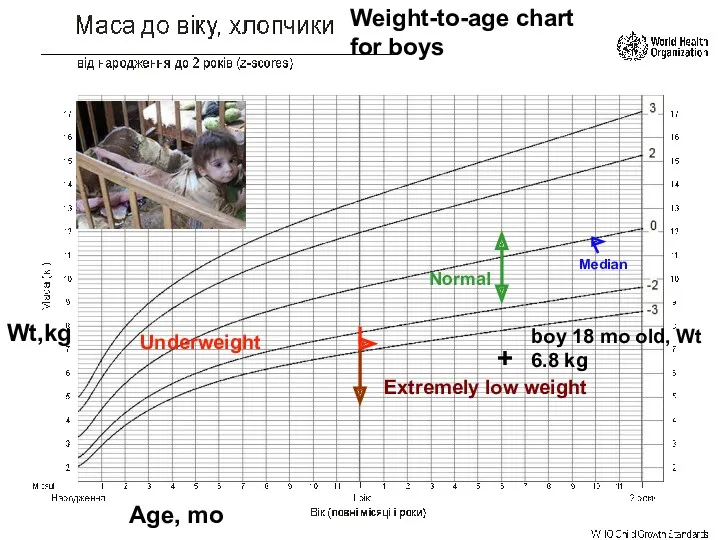
Median
Underweight
Normal
Extremely low weight
+
boy 18 mo old, Wt 6.8
Median
Underweight
Normal
Extremely low weight
+
boy 18 mo old, Wt 6.8
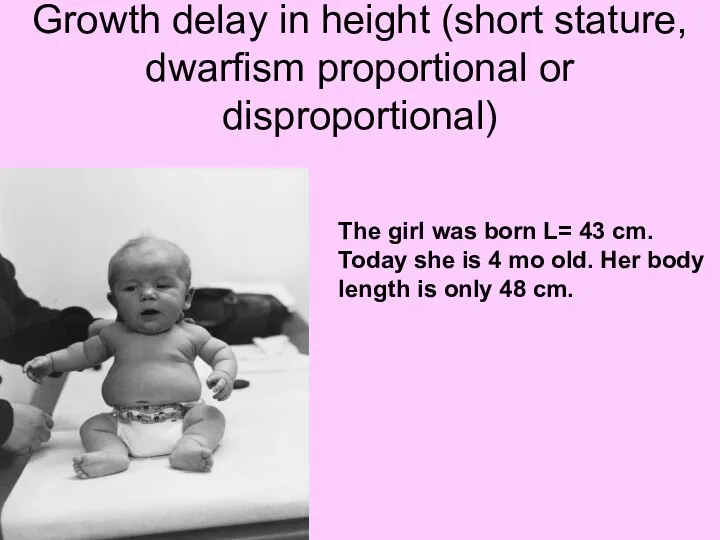
Growth delay in height (short stature, dwarfism proportional or disproportional)
The
Growth delay in height (short stature, dwarfism proportional or disproportional)
The
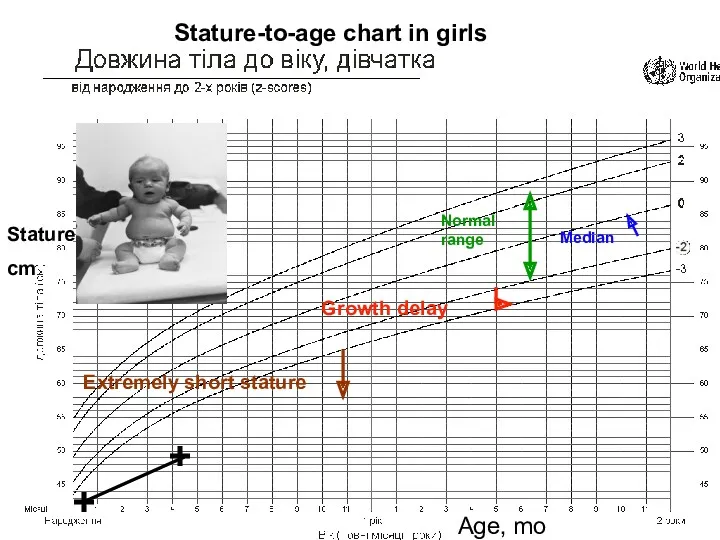
Median
Growth delay
Normalrange
Extremely short stature
+
+
Stature
cm
Age, mo
Stature-to-age chart in girls
Median
Growth delay
Normalrange
Extremely short stature
+
+
Stature
cm
Age, mo
Stature-to-age chart in girls
Physical development in children of the different age
The growth
Physical development in children of the different age
The growth
This age period of childhood is characterizing with more stable
This age period of childhood is characterizing with more stable
The growth of the children aged 3 – 18 yr.
The growth of the children aged 3 – 18 yr.
The main semiotics of growth disturbances in children aged 3 –
The main semiotics of growth disturbances in children aged 3 –
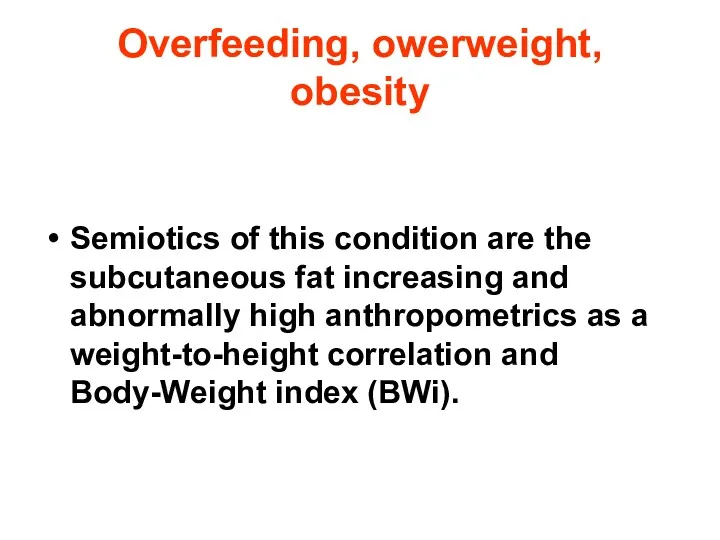
Overfeeding, owerweight, obesity
Semiotics of this condition are the subcutaneous fat increasing
Overfeeding, owerweight, obesity
Semiotics of this condition are the subcutaneous fat increasing
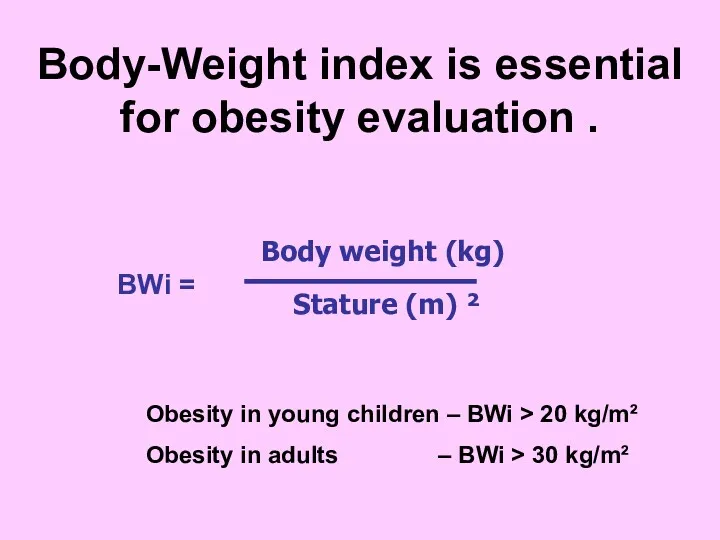
Body-Weight index is essential for obesity evaluation .
Obesity in young children
Body-Weight index is essential for obesity evaluation .
Obesity in young children
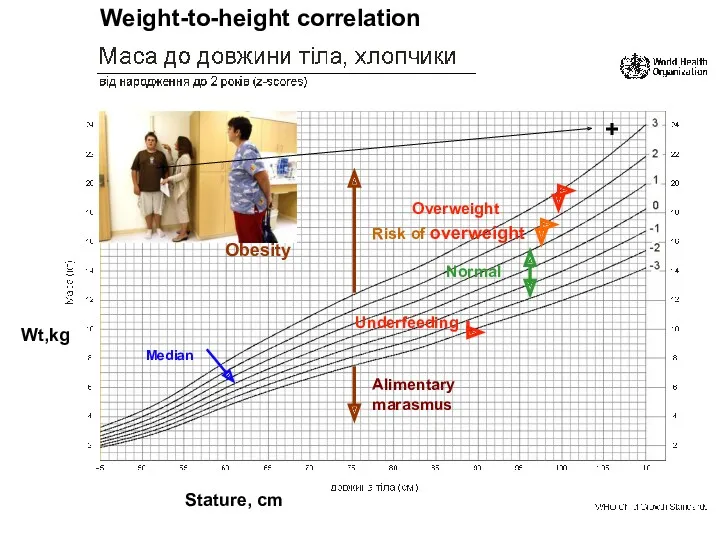
Median
Underfeeding
Normal
Alimentary marasmus
Risk of overweight
Overweight
Obesity
Wt,kg
Stature, cm
Weight-to-height correlation
+
Median
Underfeeding
Normal
Alimentary marasmus
Risk of overweight
Overweight
Obesity
Wt,kg
Stature, cm
Weight-to-height correlation
+
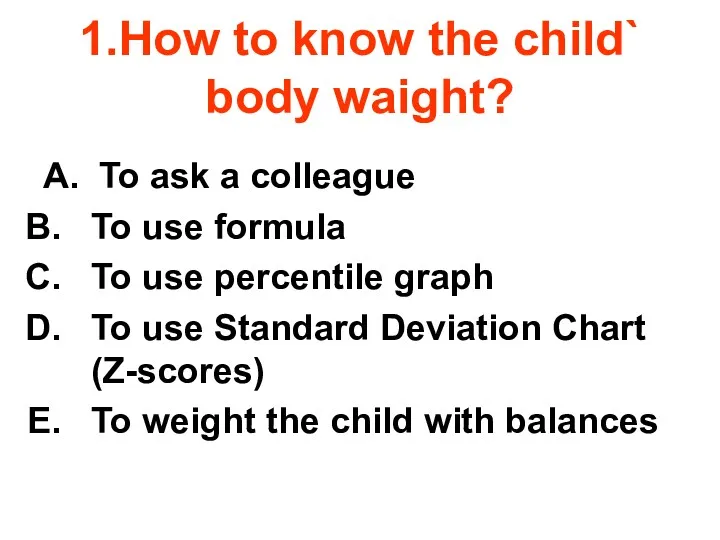
1.How to know the child` body waight?
A. To ask a colleague
To
1.How to know the child` body waight?
A. To ask a colleague
To
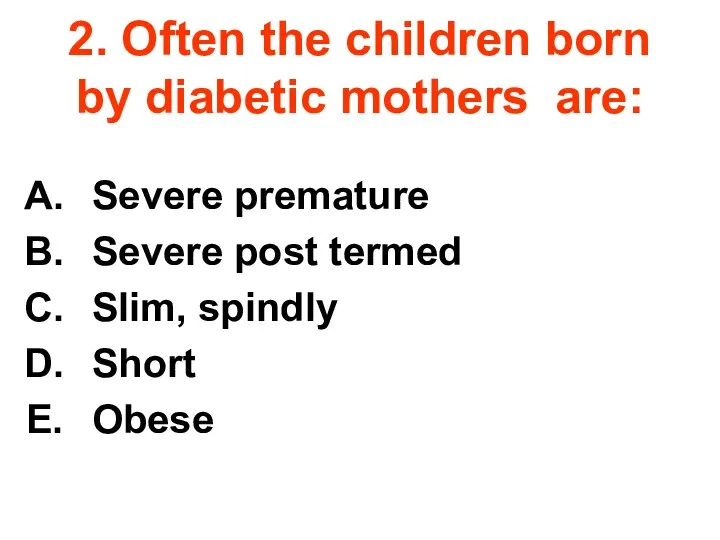
2. Often the children born by diabetic mothers are:
Severe premature
Severe post
2. Often the children born by diabetic mothers are:
Severe premature
Severe post
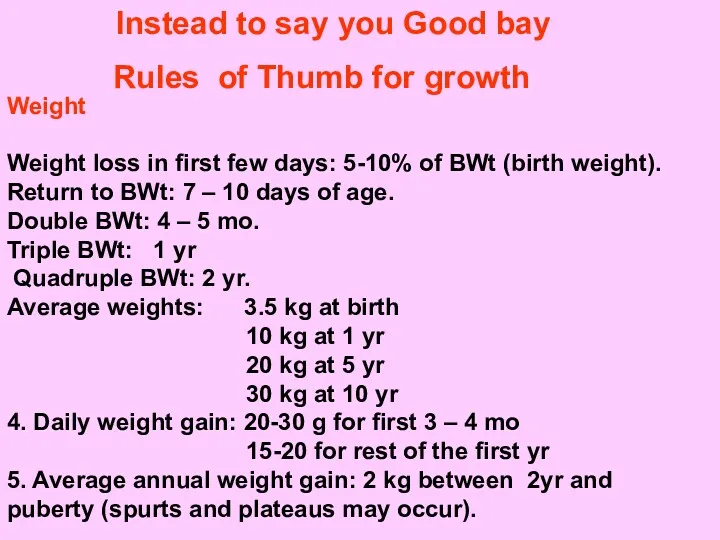
Weight
Weight loss in first few days: 5-10% of BWt (birth
Weight
Weight loss in first few days: 5-10% of BWt (birth
 Суточное мониторирование артериального давления в клинической практике
 Роль физической культуры и спорта в профилактике заболеваний и укреплении здоровья
 Лучевая диагностика органов дыхания
 Тауарлар қоры
 Диагностика и лечение артериальной гипертензии на уровне ПМСП
 Синдром красного глаза без снижения зрительных функций
 СНІД – чума ХХІ століття
 Определение нейрореабилитации
 Акушерская тактика при COVID-19
 Реабилитационные мероприятия при лечении перенесенного ишемического инсульта
 Цитологические основы наследственности
 Межевая линия и экватор. Типичные и атипичные линии
 Эозинофильный гранулематоз с полиангиитом
 Повреждения от действия тупых предметов. Судебная экспертиза
 Сопровождение лиц с нарушением зрения в образовательной среде ВУЗа
 Medical insurance for employees and their family members
 Анатомия, физиология и патология органов слуха речи и зрения
 Гипогонадизм. Гирсутизм
 Туа біткен кардиттер. Эластофиброз
 Расстройства кровообращения
 Гиподинамияның зияндылығы. Оқушылардың жүру және күн тәртібі режимі
 Особенности расстройств личности (психопатии) в детском и подростковом возрасте
 Бактериальные инфекции с трансмиссивным механизмом передачи (кровяные инфекции)
 Инфекции, передающиеся половым путем. Виды инфекций
 Энтеровирусты инфекция
 Инородные тела дыхательных путей
 Атеротромбоз. Основные причины смертности по всему миру
 Дәрігерге дейінгі алғашқы көмекадам өміріне немесе денсаулығына кенеттен қауіп төнгенде оның өмірін сақтап қалу үшін немесе