- An overview of statistics. (Сhapter 1.1)

Содержание
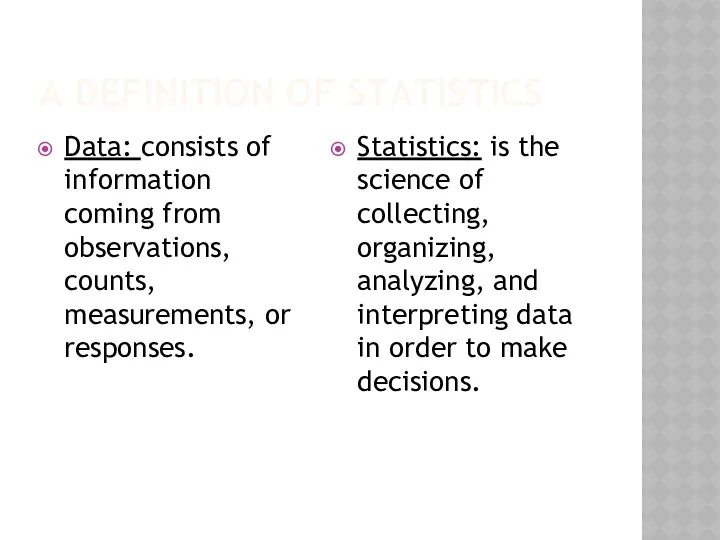
- 2. A DEFINITION OF STATISTICS Data: consists of information coming from observations, counts, measurements, or responses. Statistics:
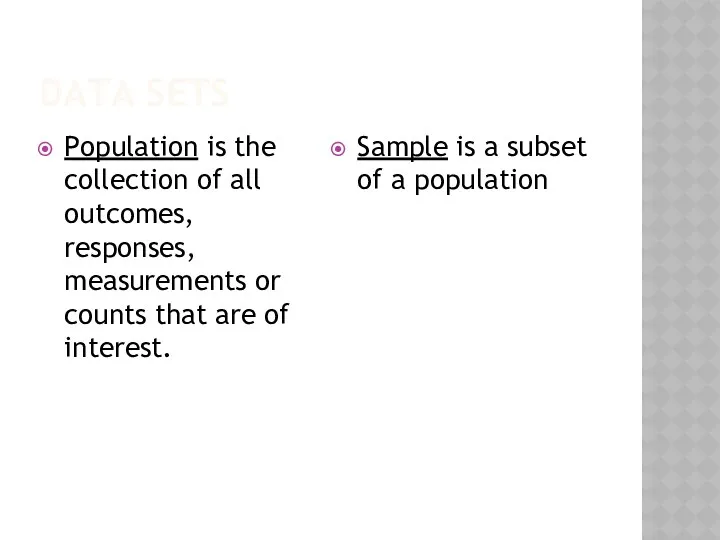
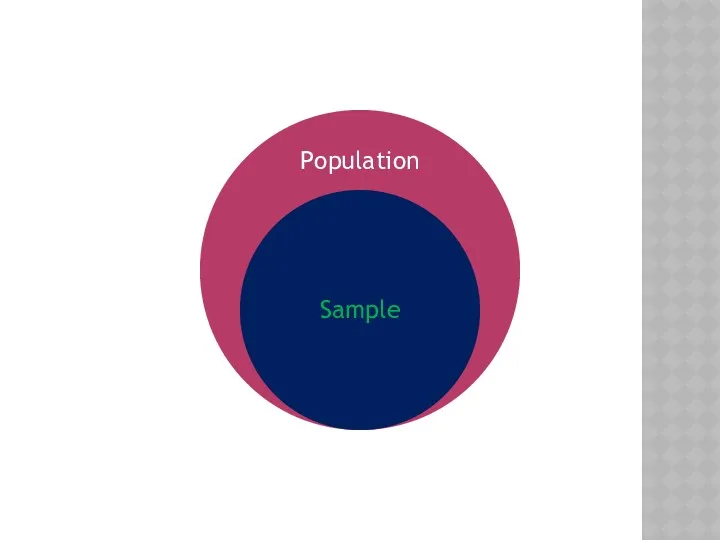
- 3. DATA SETS Population is the collection of all outcomes, responses, measurements or counts that are of
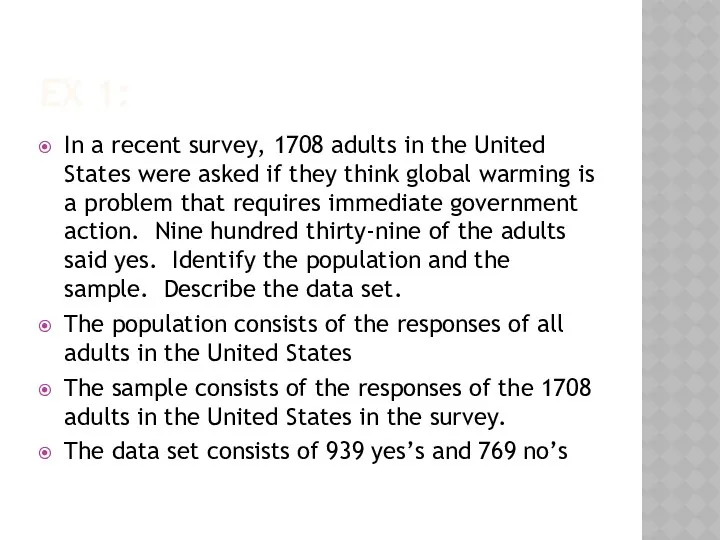
- 5. EX 1: In a recent survey, 1708 adults in the United States were asked if they
- 6. A parameter is a numerical description of a population characteristic. A statistic is a numerical description
- 7. Ex 2: Decide whether the numerical value describes a population parameter or a sample statistic. Explain
- 8. 2. Starting salaries for the 667 MBA graduates from the University of Chicago Graduate School of
- 9. BRANCHES OF STATISTICS Descriptive statistics is the branch of statistics that involves the organization, summarization, and
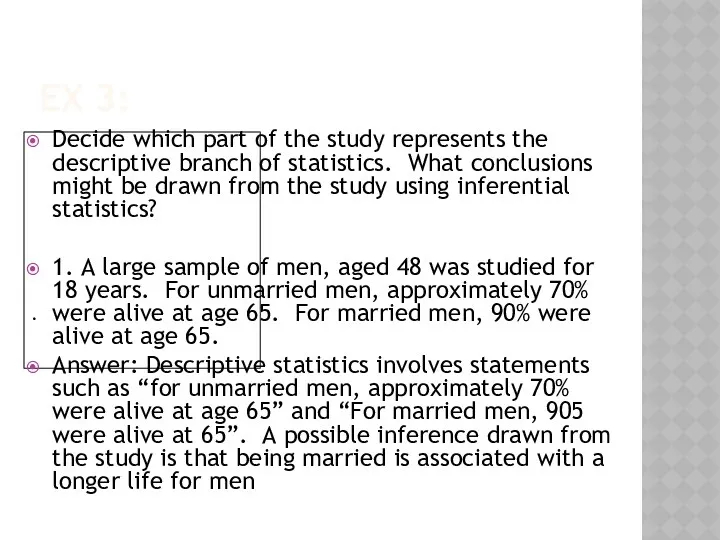
- 10. EX 3: Decide which part of the study represents the descriptive branch of statistics. What conclusions
- 11. 2. In a sample of Wall Street analysts, the percentage who incorrectly forecasted high-tech earning in
- 13. Скачать презентацию
A DEFINITION OF STATISTICS
Data: consists of information coming from observations, counts,
A DEFINITION OF STATISTICS
Data: consists of information coming from observations, counts,
DATA SETS
Population is the collection of all outcomes, responses, measurements or
DATA SETS
Population is the collection of all outcomes, responses, measurements or
EX 1:
In a recent survey, 1708 adults in the United States
EX 1:
In a recent survey, 1708 adults in the United States
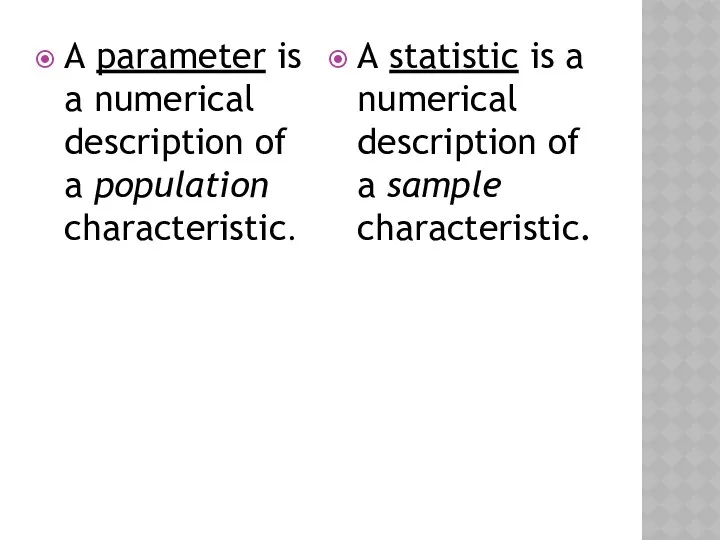
A parameter is a numerical description of a population characteristic.
A statistic
A parameter is a numerical description of a population characteristic.
A statistic
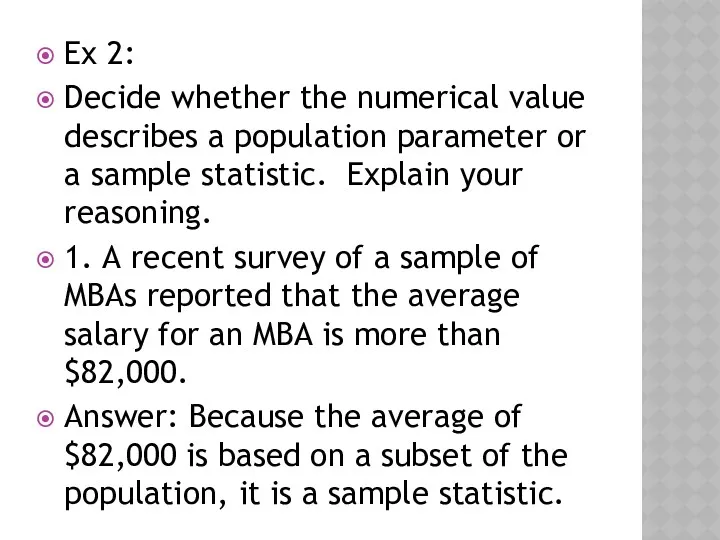
Ex 2:
Decide whether the numerical value describes a population parameter or
Ex 2:
Decide whether the numerical value describes a population parameter or
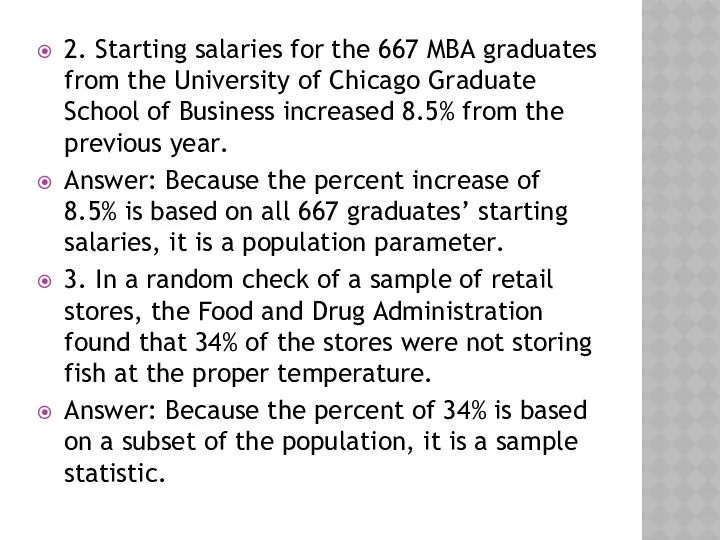
2. Starting salaries for the 667 MBA graduates from the University
2. Starting salaries for the 667 MBA graduates from the University
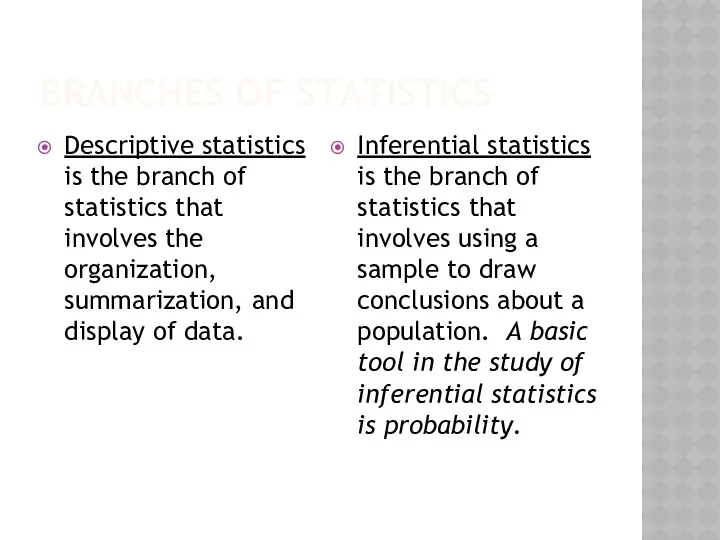
BRANCHES OF STATISTICS
Descriptive statistics is the branch of statistics that involves
BRANCHES OF STATISTICS
Descriptive statistics is the branch of statistics that involves
EX 3:
Decide which part of the study represents the descriptive branch
EX 3:
Decide which part of the study represents the descriptive branch
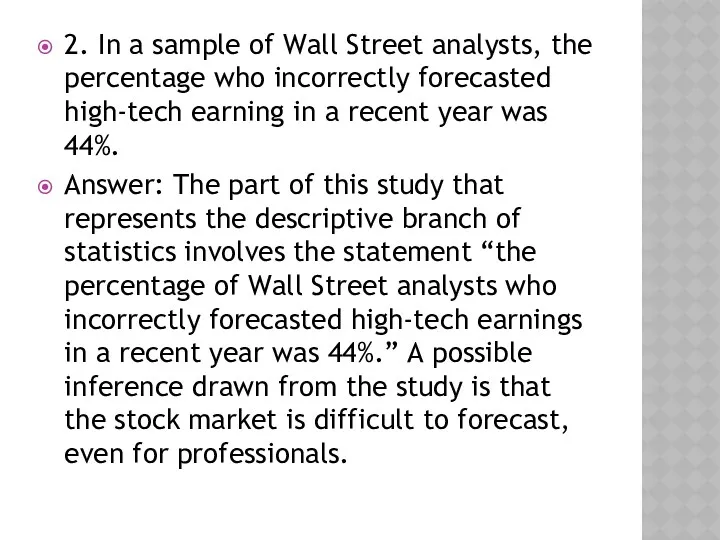
2. In a sample of Wall Street analysts, the percentage who
2. In a sample of Wall Street analysts, the percentage who
 Анархо-феминизм
 Студенческое самоуправление как фактор формирования социальных компетенций
 Презентация по темеПолитика
 Добровольческий Центр Волонтер в Кизнерском районе
 Форма и механизмы приобщения к культуре. Социализация и воспитание (составные части и разновидности социализации)
 Деятельность человека и её основные формы
 Зайнятість населення і безробіття
 Общество. Общественные отношения. Сферы общества
 Школа студенческого актива объединенного студенческого совета
 Загадка человека - 2.
 Представление программы элективного курса Право
 Международная молодежная организация Powered BY Aiesec. Программа волонтерских стажировок
 Волонтерское движение в разных странах мира
 Опыт организации профсоюзов в России
 Социологиялық зерттеулер әдістері
 Социальные институты и социальный контроль
 Социальная структура и социальные отношения. Изучаем социальную сферу жизни общества
 Ivolga 2.0 - молодежный форум
 Как влиять на достижение ЦУР своими повседневными действиями
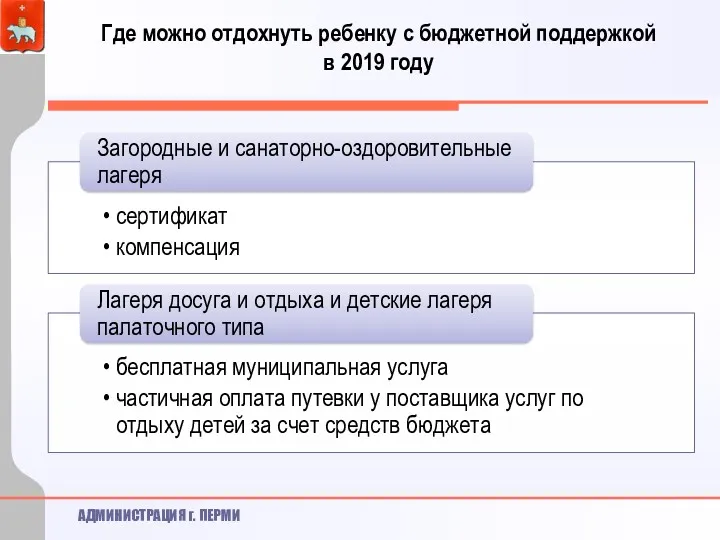 Где можно отдохнуть ребенку с бюджетной поддержкой в 2019 году
 Презентация и тест по обществознанию Мировая экономика
 Проект спортивной площадки на территории Городской классической гимназии
 Молодежь и электронная активность
 Кандидат на должность председателя первичной профсоюзной организации МГТУ ГА
 Этнос, народ, нация.
 Добровольчество
 Реализация государственной программы Доступная среда в Москве
 Отчет о проделанной работе депутатов Обнинского городского собрания