- Transportation impacts on environment

Содержание
- 2. Contents: History Development Sectors Environmental Impact Environmental Dimensions Mitigation S.W.O.T.
- 3. History of Transportation ? International trade was the driving motivator behind advancements in global transportation in
- 4. The development of Transportation Development can be defined as improving the welfare of a society through
- 5. Sectors The following figure show the impact of the different transportation :
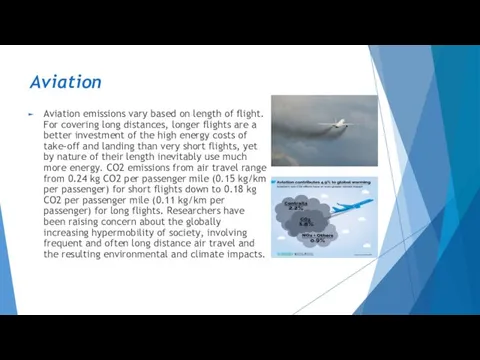
- 6. Aviation Aviation emissions vary based on length of flight. For covering long distances, longer flights are
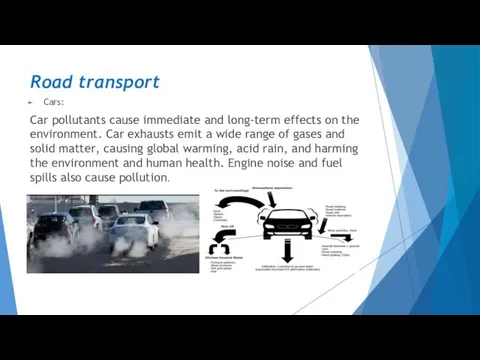
- 7. Road transport Cars: Car pollutants cause immediate and long-term effects on the environment. Car exhausts emit
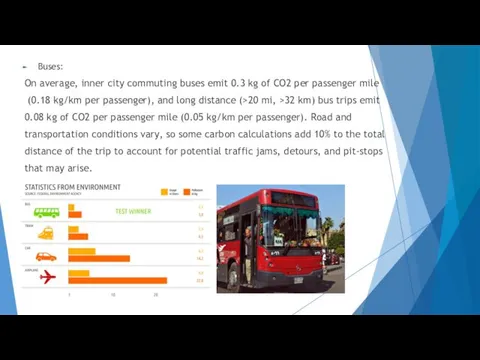
- 8. Buses: On average, inner city commuting buses emit 0.3 kg of CO2 per passenger mile (0.18
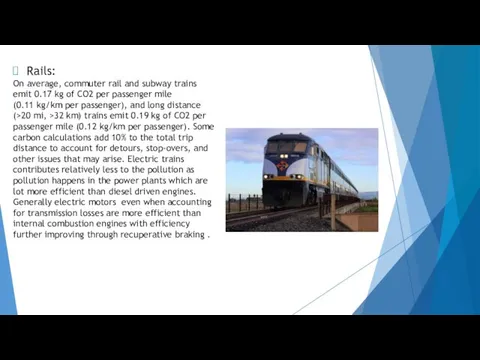
- 9. Rails: On average, commuter rail and subway trains emit 0.17 kg of CO2 per passenger mile
- 10. The Environmental impact The environmental impact of transport is significant because transport is a major user
- 12. Скачать презентацию
Contents:
History
Development
Sectors
Environmental Impact
Environmental Dimensions
Mitigation
S.W.O.T.
Contents:
History
Development
Sectors
Environmental Impact
Environmental Dimensions
Mitigation
S.W.O.T.
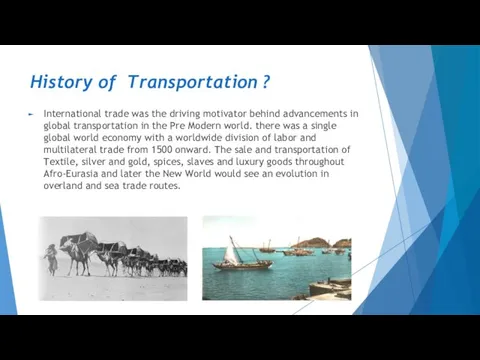
History of Transportation ?
International trade was the driving motivator behind advancements
History of Transportation ?
International trade was the driving motivator behind advancements
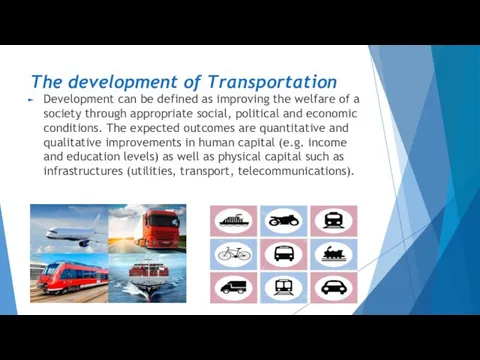
The development of Transportation
Development can be defined as improving the
The development of Transportation
Development can be defined as improving the
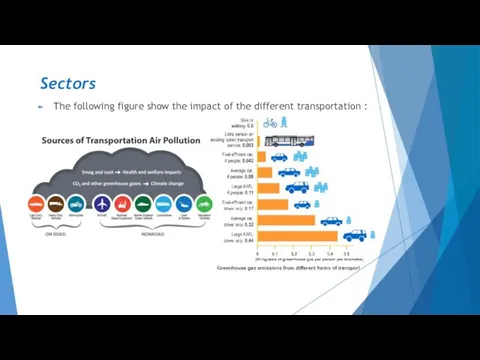
Sectors
The following figure show the impact of the different transportation :
Sectors
The following figure show the impact of the different transportation :
Aviation
Aviation emissions vary based on length of flight. For covering
Aviation
Aviation emissions vary based on length of flight. For covering
Road transport
Cars:
Car pollutants cause immediate and long-term effects on the environment.
Road transport
Cars:
Car pollutants cause immediate and long-term effects on the environment.
Buses:
On average, inner city commuting buses emit 0.3 kg of CO2
Buses:
On average, inner city commuting buses emit 0.3 kg of CO2
Rails:
On average, commuter rail and subway trains emit 0.17 kg of CO2 per passenger
Rails:
On average, commuter rail and subway trains emit 0.17 kg of CO2 per passenger
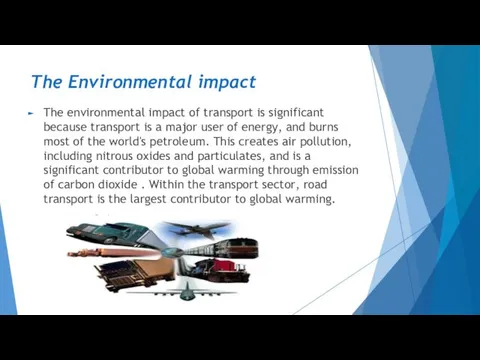
The Environmental impact
The environmental impact of transport is significant because
The Environmental impact
The environmental impact of transport is significant because
 Правила безопасности дома, на улице, в лесу. Интерактивная игра
 Совершенствование организации дорожного движения, разработка мероприятий по повышению безопасности дорожного движения г. Тлесток
 Презентация Ратные страницы истории Отечества
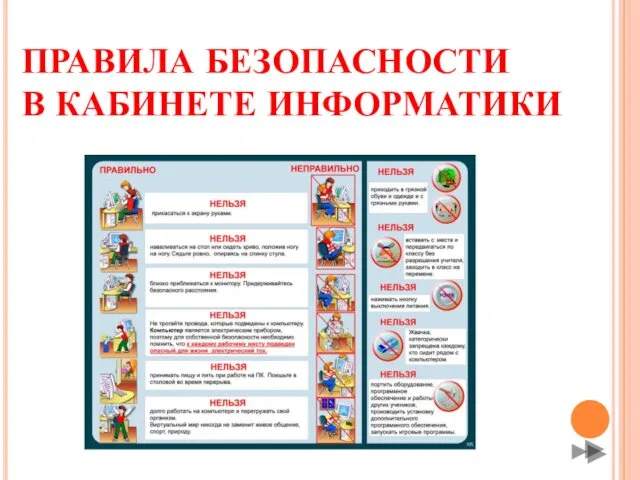 Правила безопасности в кабинете информатики
 Почему нужно есть много овощей и фруктов
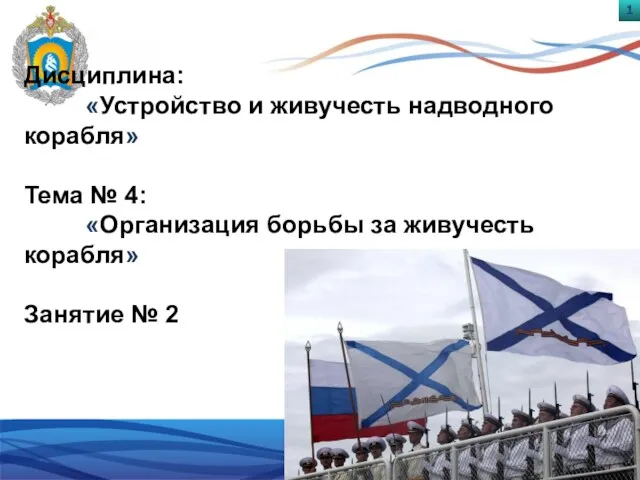 Организация борьбы за живучесть корабля
 Международный терроризм: глобальная угроза человечеству. Возникновение терроризма
 Понятие здоровье, его содержание и критерии
 Презентация по ОБЖ для учащихся 7-х классов Анатомо-физиологические особенности человека в подростковом возрасте
 Чрезвычайные ситуации природного характера
 Измерение уровня радиации в квартире
 Как стать ЮИД (Юный Инспектор Движения)
 Денсаулыққа әсер ететін қауіпті факторлар
 Инструктаж на период летних каникул
 Гаджеты в современном мире
 Здоровое питание
 Применение тросовых ограждений на автомобильных дорогах
 Healthy life style
 Игра для учащихся 8 класса по теме: Безопасность и защита человека в опасных и чрезвычайных ситуациях
 Мы спасаем кошкин дом. Причины пожаров
 Оповещение населения о чрезвычайных ситуациях
 Несчастный случай на производстве
 Знатоки правил дорожного движения. Игра-викторина
 Правила дорожного движения. Классный час
 Правила безопасного поведения при пожарах и взрывах
 Правила техники безопасности в швейной мастерской
 Здоровым быть здорово