- Attitudes and Behavior

Содержание
- 2. “… attitude is probably the most distinctive and indispensable concept in contemporary social psychology. No other
- 3. Why People Have Attitudes? Attitudes are necessary and adaptive for humans. They help us adjust to
- 4. Definition An attitude can be defined as a latent disposition or tendency to respond with some
- 5. Types of attitudes Global attitudes Attitudes toward behavior
- 6. Attitude: Unidimensional Definition Attitude is a hypothetical, latent construct. It is defined as the readiness to
- 7. Attitude vs. Beliefs Attitudes differ from beliefs. Beliefs are pieces of information (facts or opinions) about
- 8. Attitude vs. Beliefs If you think that a certain person is president or that it is
- 9. Attitude vs. Affect Attitude: Evaluation of a psychological object. Affect: Somatic system with evaluative dimension and
- 10. Tripartite Model of Attitude (Rosenberg & Hovland, 1960)
- 11. ABC model of attitudes Affective component: this involves a person’s feelings / emotions about the attitude
- 12. Tripartite Model of Attitude (Rosenberg & Hovland, 1960)
- 13. Attitude Measurement
- 14. Direct Evaluations Examples of Single-Item Measures “Do you approve of the way the President is doing
- 15. Single-Item Measures: Potential Problems Clerical errors in responding or coding Momentary distraction In phone survey: tone
- 17. Effect of Mood: positive feeling state was induced by giving subjects a free gift, and good
- 18. Direct Evaluations: Multi-Item Measures Repeated Evaluations With Variations Rosenberg (1965) Self-Esteem Scale 1. I feel that
- 19. Direct Attitude Assessment: Evaluative Semantic Differential One of the options being considered in the abortion debate
- 20. Semantic Differential: Rotated Factor Loadings (Osgood, Suci, & Tannenbaum, 1957) I II III IV 1. good-bad
- 21. The semantic differential technique reveals information on three basic dimensions of attitudes:
- 22. The semantic differential technique reveals information on three basic dimensions of attitudes: evaluation
- 23. The semantic differential technique reveals information on three basic dimensions of attitudes: evaluation potency (i.e. strength)
- 24. The semantic differential technique reveals information on three basic dimensions of attitudes: evaluation potency (i.e. strength)
- 25. • Evaluation is concerned with whether a person thinks positively or negatively about the attitude topic
- 26. Semantic Differential: Rotated Factor Loadings (Osgood, Suci, & Tannenbaum, 1957) I II III IV 1. good-bad
- 27. Inferential Attitude Measures (Thurstone, Likert, Guttman Scaling) Potential Items to Assess Attitudes Toward Abortion 1. It
- 28. Likert Scaling: Construct large number of items. Administer questionnaire: 5-point response scale: strongly agree (5), agree
- 29. Ideal Operating Characteristic Curves for Positive and Negative Likert Scale Items
- 30. Attitudes Toward Illegal Immigrants: Sample Items from a Likert Scale (Ommundsen & Larsen, 1997) 1. Illegal
- 31. Attitudes and Behavior
- 32. Validation of Attitude Measures: Predictive Validity Primary criterion for validity of attitude measure: Predictive validity, i.e.,
- 34. Other Examples of Attitude-Behavior Relations Corey (1937) Attitude: Likert scale. Attitude toward cheating. Behavior: No. items
- 35. Narrative Review of Over 50 Studies of the Attitude – Behavior Relation "Taken as a whole,
- 36. Wicker’s conclusions did not come as a surprise to sociologists who had questioned the importance of
- 37. Explanation I: Inadequate Attitude Measurement Major Critique Attitudes assess only the evaluative (affective) component. We must
- 38. Prediction of 8 Behaviors from Attitude Toward the Church (Ostrom, 1969) Mean Correlations Cognition – Behavior:
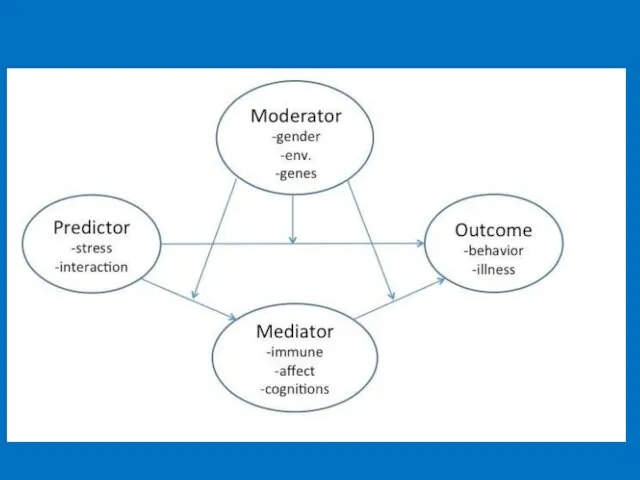
- 39. Explanation II: Other Additive Factors Behavior Personality traits Ability Motivation Attitude Habit Needs Social pressure Other
- 40. Explanation III: Moderating Variables Personality Self-monitoring (Snyder & Swann, 1976) Private self-consciousness (Scheier et al., 1978)
- 45. Explanation III: Moderating Variables Personality Self-monitoring (Snyder & Swann, 1976) Private self-consciousness (Scheier et al., 1978)
- 47. Effect of Confidence on Attitude-Behavior Correlation – Student Government (Warland & Sample, 1973)
- 48. Problems of Moderating Variables Approach 1. High attitude-behavior correlation only for some people under some conditions.
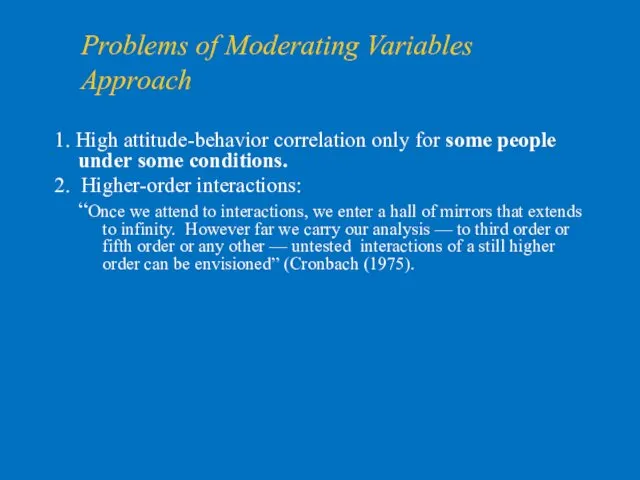
- 49. Problems of Moderating Variables Approach 1. High attitude-behavior correlation only for some people under some conditions.
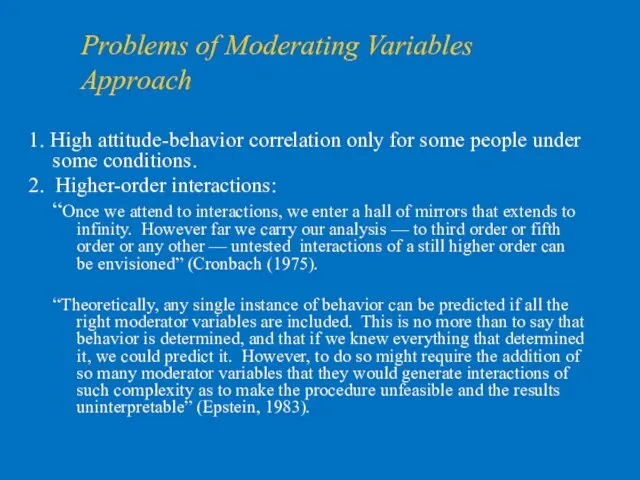
- 51. Problems of Moderating Variables Approach 1. High attitude-behavior correlation only for some people under some conditions.
- 53. Response Biases Long before it became evident that attitudes are poor predictors of behavior, investigators were
- 54. The methods available to avoid social desirability bias were of two types: 1) Disguised procedures of
- 55. The significant factors formed by scales of Semantic Differential in answers of
- 56. Graphic representation of modalities on the two factor axes of FA on the evaluation of different
- 57. Graphic representation of modalities on the two factor axes of FA on the evaluation of different
- 58. Graphic representation of modalities on the two factor axes of FA on the evaluation of different
- 59. Graphic representation of modalities on the two factor axes of FA on the evaluation of different
- 60. Graphic representation of modalities on the two factor axes of FA on the evaluation of different
- 61. The methods available to avoid social desirability bias were of two types: 1) Disguised procedures of
- 62. PREDICTING SINGLE BEHAVIORS Investigators are often interested not in a broad multiple-act index of behavior but
- 63. Principle of Compatibility A single behavior can be viewed as involving an action directed at a
- 64. Principle of Compatibility For example, we may be interested in understanding why people do or do
- 65. Principle of Compatibility The principle of compatibility (Ajzen, 1988; Ajzen & Fishbein, 1977) requires that measures
- 66. PREDICTING SINGLE BEHAVIORS: Principle of Compatibility Attitude Target Action Context Time Behavior Target Action Context Time
- 67. Manstead, Proffitt, and Smart (1983) reported a study on infant feeding practices. Toward the end of
- 68. Many studies have examined the relation between attitudes and behavior in the domain of physical exercise.
- 69. In a meta-analysis of 8 studies that manipulated level of compatibility while holding all other variables
- 70. Intention and behaviour
- 71. Intentions as Predictors of Behavior The previous discussion indicates that, consistent with the principle of compatibility,
- 72. Intentions as Predictors of Behavior Many studies have substantiated the predictive validity of behavioral intentions. When
- 73. The respondents were asked the following question: “Are you thinking about starting your own business within
- 74. One year later, we re-interviewed by telephone the “intenders”. The purpose of this survey was to
- 75. Low Intention–Behavior Relations However, notwithstanding these encouraging findings, there is also considerable variability in the magnitude
- 76. Intention – Behavior Gap: 6 Studies in Health Domain (Sheeran, 2002)
- 77. Reasons for Failure to Carry Out Intention Low control (INT-BEH moderated by control). Forgetting – Failure
- 78. Attitudes toward specific behaviors are good predictors of single actions. General attitudes usually do not provide
- 79. New models of relation between attitude and behavior appeared as a result of more careful study
- 80. From General Attitudes to Specific Behaviors: Automatic and Deliberative Processes (Fazio, 1990) The most direct and
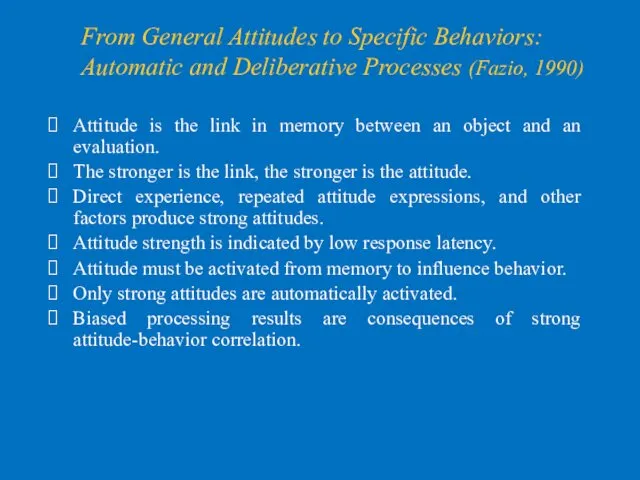
- 81. From General Attitudes to Specific Behaviors: Automatic and Deliberative Processes (Fazio, 1990) Attitude is the link
- 82. The MODE Model (Motivation and Opportunity as Determinants) – Fazio (1990)
- 83. Thus, automatic attitude activation occurs when a strong link has been established in memory between the
- 84. Studies that were designed to test directly the MODE model’s predictions concerning the attitude-to-behavior process have
- 85. Fazio and Williams (1986) predicted voting choice in the 1984 presidential election from attitudes toward the
- 87. Ronald Reagan
- 88. Walter Mondale
- 89. A total of 245 voting age residents of the Bloomington, Indiana area participated in the initial
- 90. Experiment The first five statements were intended to serve as practice items to acquaint subjects with
- 91. The answers of the participants of that experiment was recorded on a tape recorder, which allowed
- 92. The next phase concerned judgments of the candidates' performances during the nationally televised debates. The first
- 93. The day after the second debate, subjects were mailed a letter from the Political Behavior Research
- 94. Subjects were asked to endorse one of five statements: "Reagan was much more impressive," "Reagan was
- 97. The final phase of the investigation concerned voting behavior. Beginning the day after the election, an
- 99. The Role of Attitude Strength: Two Possibilities Response latency is an indicator of attitude strength. “Attitude
- 100. Stability of Intentions Perhaps more important, if intentions change after they are assessed, they will tend
- 101. Stability of Intentions Instead of relying on time interval as an indication of stability, some studies
- 102. Stability of Intentions In one of these investigations (Sheeran, Orbell, & Trafimow, 1999), undergraduate college students
- 103. Changes in Intentions Prior to Behavior (Sheeran, Orbell, & Trafimow, 1999) Behavior: Self-reported studying during winter
- 105. Скачать презентацию
“… attitude is probably the most distinctive and indispensable concept in
“… attitude is probably the most distinctive and indispensable concept in
Why People Have Attitudes?
Attitudes are necessary and adaptive for humans.
They
Why People Have Attitudes?
Attitudes are necessary and adaptive for humans.
They
Definition
An attitude can be defined as a latent disposition or tendency
Definition
An attitude can be defined as a latent disposition or tendency
Types of attitudes
Global attitudes
Attitudes toward behavior
Types of attitudes
Global attitudes
Attitudes toward behavior
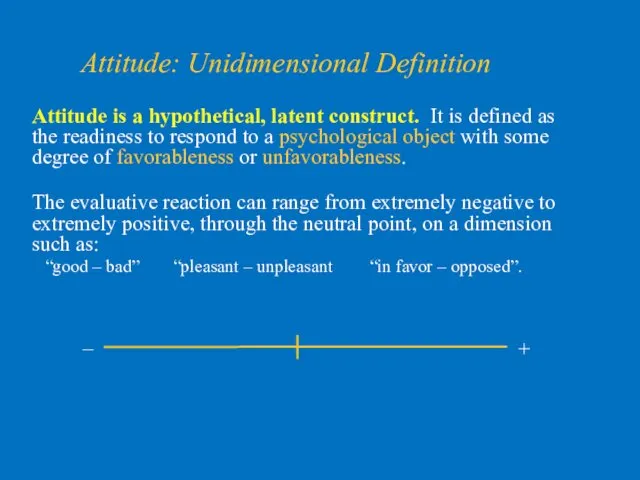
Attitude: Unidimensional Definition
Attitude is a hypothetical, latent construct. It is defined
Attitude: Unidimensional Definition
Attitude is a hypothetical, latent construct. It is defined
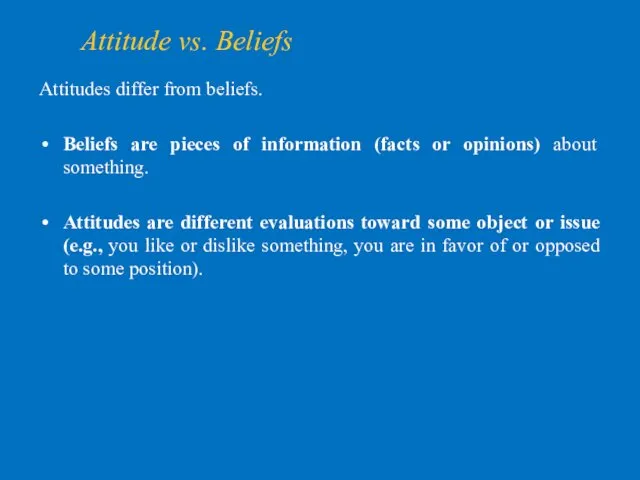
Attitude vs. Beliefs
Attitudes differ from beliefs.
Beliefs are pieces of information
Attitude vs. Beliefs
Attitudes differ from beliefs.
Beliefs are pieces of information
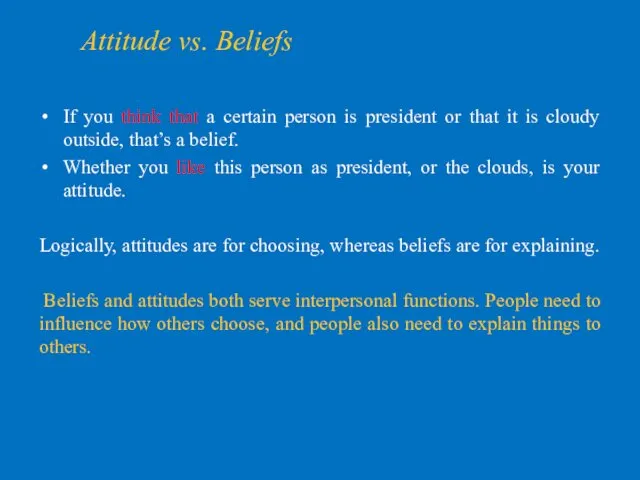
Attitude vs. Beliefs
If you think that a certain person is president
Attitude vs. Beliefs
If you think that a certain person is president
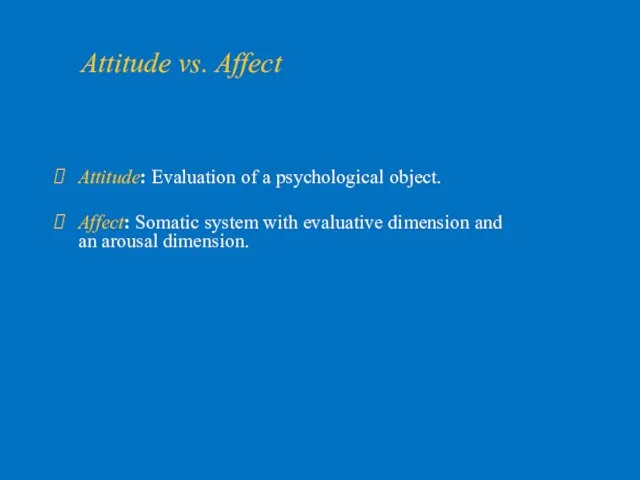
Attitude vs. Affect
Attitude: Evaluation of a psychological object.
Affect: Somatic system
Attitude vs. Affect
Attitude: Evaluation of a psychological object.
Affect: Somatic system

Tripartite Model of Attitude
(Rosenberg & Hovland, 1960)
Tripartite Model of Attitude
(Rosenberg & Hovland, 1960)
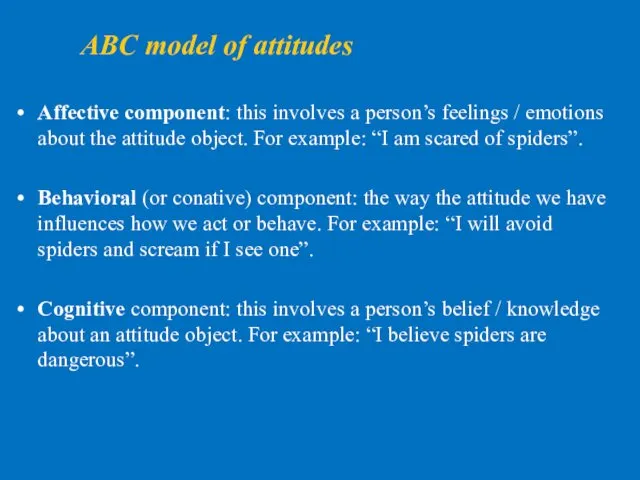
ABC model of attitudes
Affective component: this involves a person’s feelings /
ABC model of attitudes
Affective component: this involves a person’s feelings /
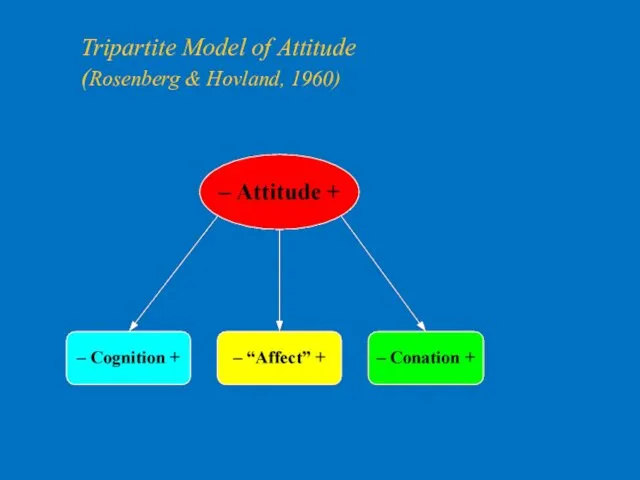
Tripartite Model of Attitude
(Rosenberg & Hovland, 1960)
Tripartite Model of Attitude
(Rosenberg & Hovland, 1960)
Attitude Measurement
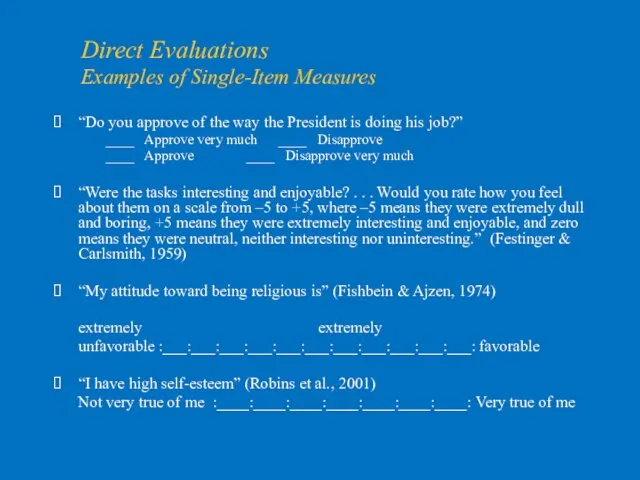
Direct Evaluations
Examples of Single-Item Measures
“Do you approve of the way the
Direct Evaluations
Examples of Single-Item Measures
“Do you approve of the way the
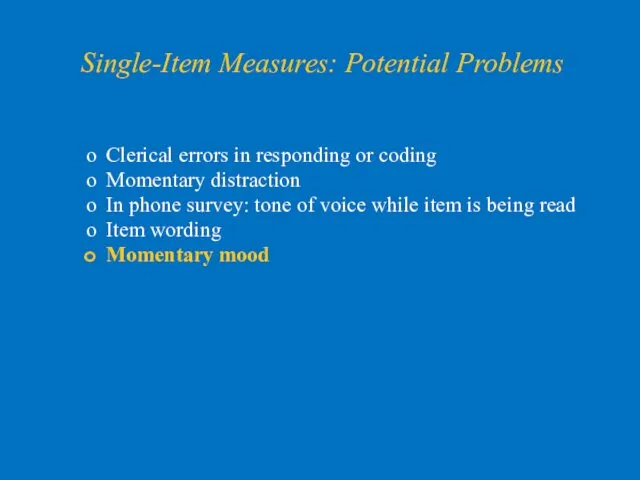
Single-Item Measures: Potential Problems
Clerical errors in responding or coding
Momentary distraction
In phone
Single-Item Measures: Potential Problems
Clerical errors in responding or coding
Momentary distraction
In phone
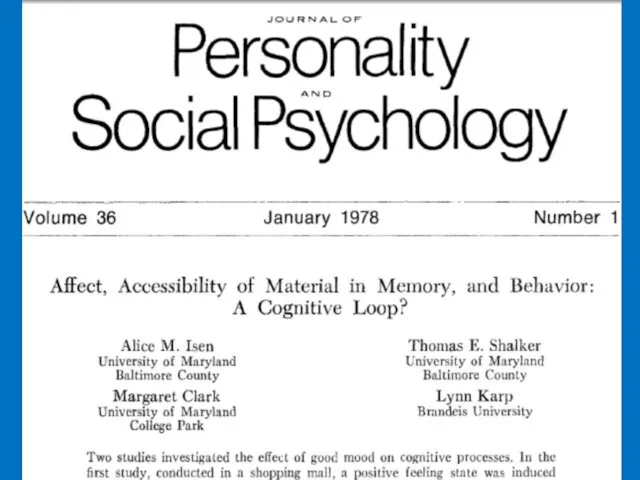
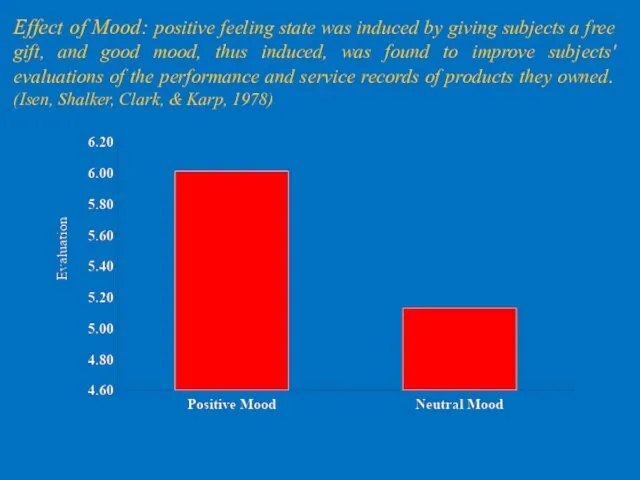
Effect of Mood: positive feeling state was induced by giving subjects
Effect of Mood: positive feeling state was induced by giving subjects
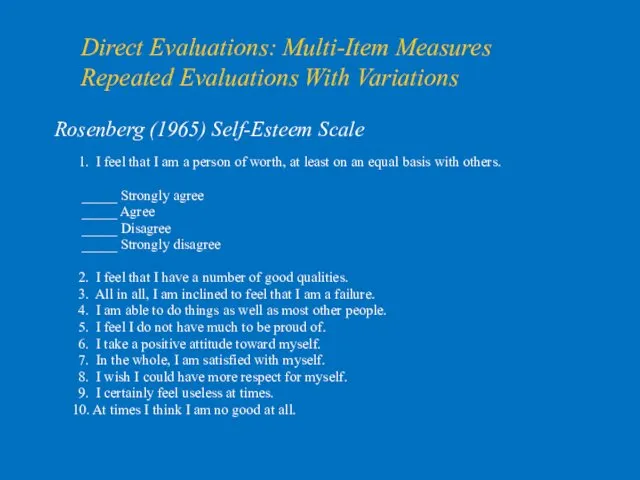
Direct Evaluations: Multi-Item Measures
Repeated Evaluations With Variations
Rosenberg (1965) Self-Esteem Scale
1. I
Direct Evaluations: Multi-Item Measures
Repeated Evaluations With Variations
Rosenberg (1965) Self-Esteem Scale
1. I
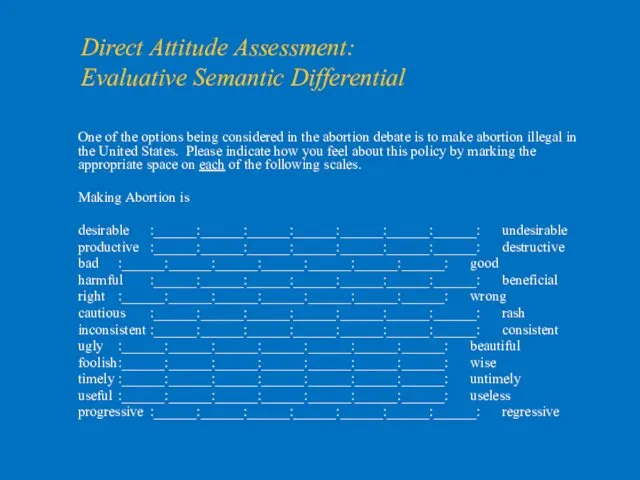
Direct Attitude Assessment:
Evaluative Semantic Differential
One of the options being considered
Direct Attitude Assessment:
Evaluative Semantic Differential
One of the options being considered
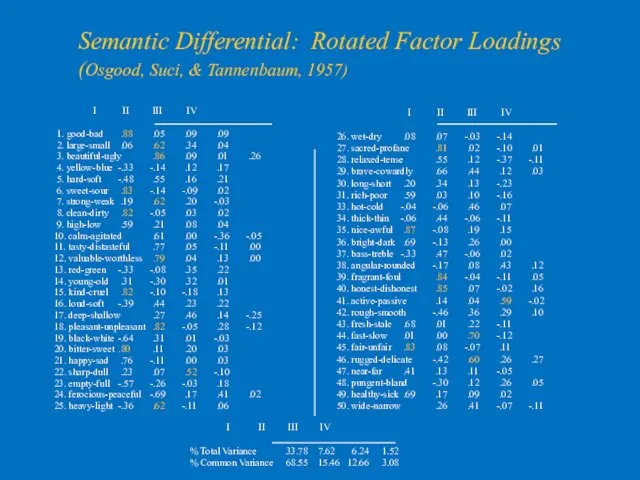
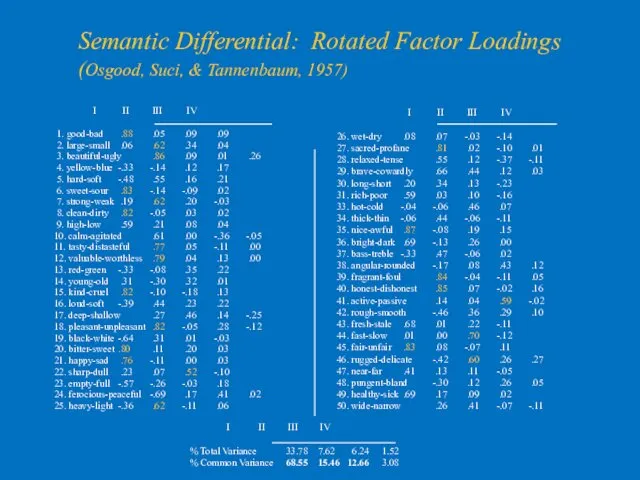
Semantic Differential: Rotated Factor Loadings
(Osgood, Suci, & Tannenbaum, 1957)
I II
Semantic Differential: Rotated Factor Loadings
(Osgood, Suci, & Tannenbaum, 1957)
I II
The semantic differential technique reveals information on three basic dimensions of
The semantic differential technique reveals information on three basic dimensions of
The semantic differential technique reveals information on three basic dimensions of
The semantic differential technique reveals information on three basic dimensions of
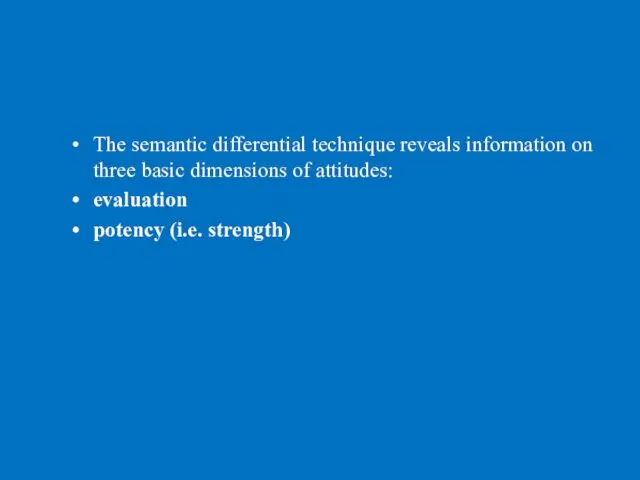
The semantic differential technique reveals information on three basic dimensions of
The semantic differential technique reveals information on three basic dimensions of
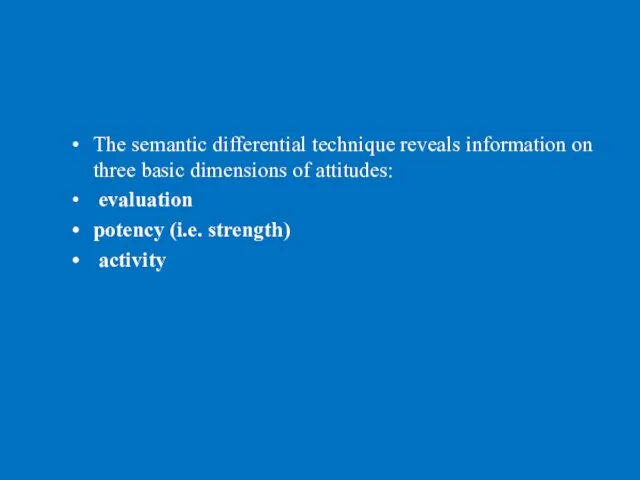
The semantic differential technique reveals information on three basic dimensions of
The semantic differential technique reveals information on three basic dimensions of
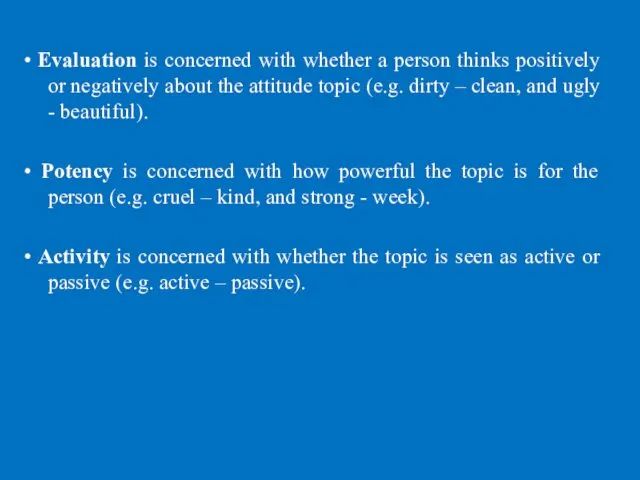
• Evaluation is concerned with whether a person thinks positively or
• Evaluation is concerned with whether a person thinks positively or
Semantic Differential: Rotated Factor Loadings
(Osgood, Suci, & Tannenbaum, 1957)
I II
Semantic Differential: Rotated Factor Loadings
(Osgood, Suci, & Tannenbaum, 1957)
I II
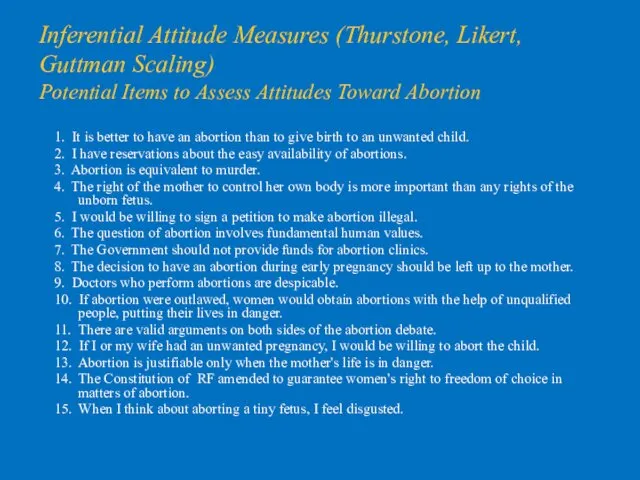
Inferential Attitude Measures (Thurstone, Likert, Guttman Scaling)
Potential Items to Assess Attitudes
Inferential Attitude Measures (Thurstone, Likert, Guttman Scaling) Potential Items to Assess Attitudes
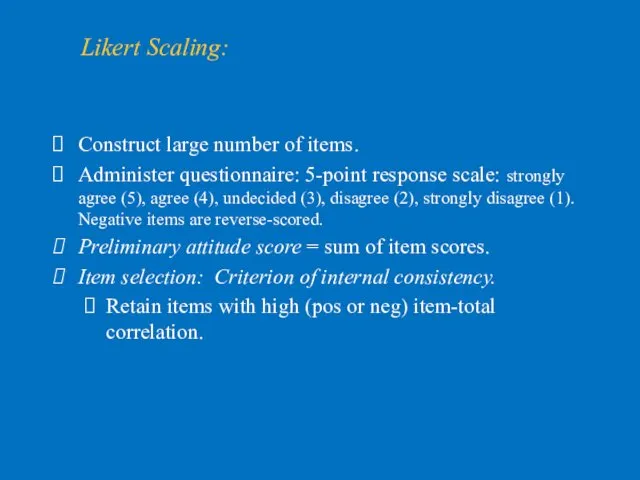
Likert Scaling:
Construct large number of items.
Administer questionnaire: 5-point response scale:
Likert Scaling:
Construct large number of items.
Administer questionnaire: 5-point response scale:
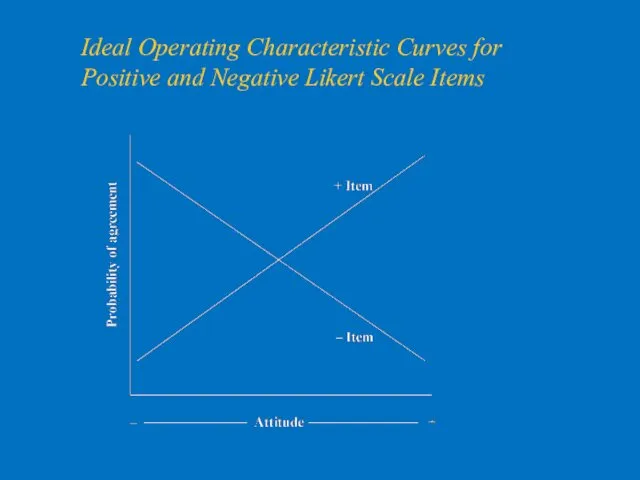
Ideal Operating Characteristic Curves for Positive and Negative Likert Scale Items
Ideal Operating Characteristic Curves for Positive and Negative Likert Scale Items
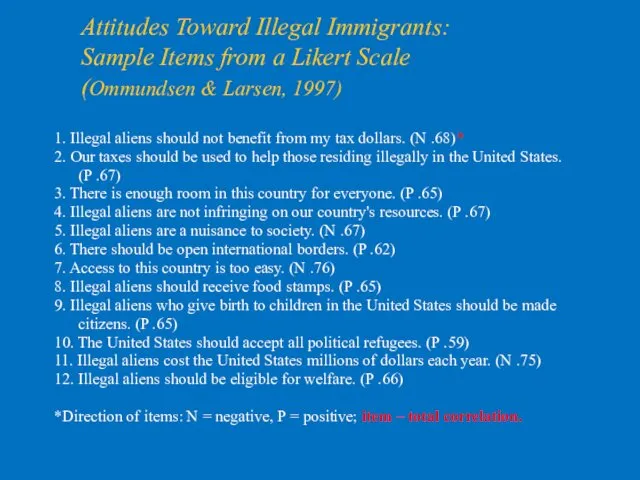
Attitudes Toward Illegal Immigrants:
Sample Items from a Likert Scale
(Ommundsen & Larsen,
Attitudes Toward Illegal Immigrants: Sample Items from a Likert Scale (Ommundsen & Larsen,
Attitudes and Behavior
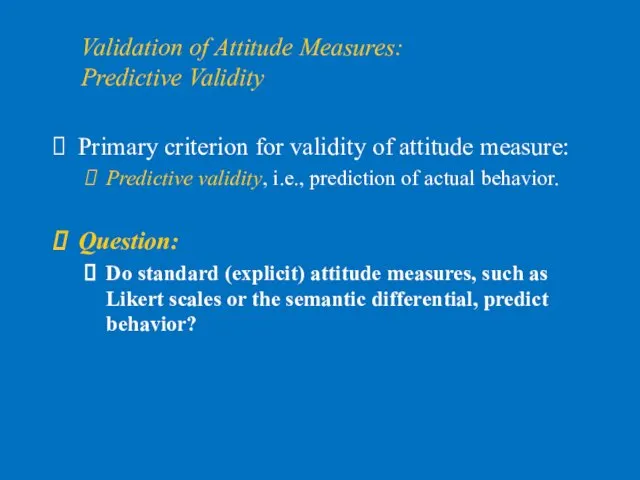
Validation of Attitude Measures:
Predictive Validity
Primary criterion for validity of attitude measure:
Predictive
Validation of Attitude Measures:
Predictive Validity
Primary criterion for validity of attitude measure:
Predictive
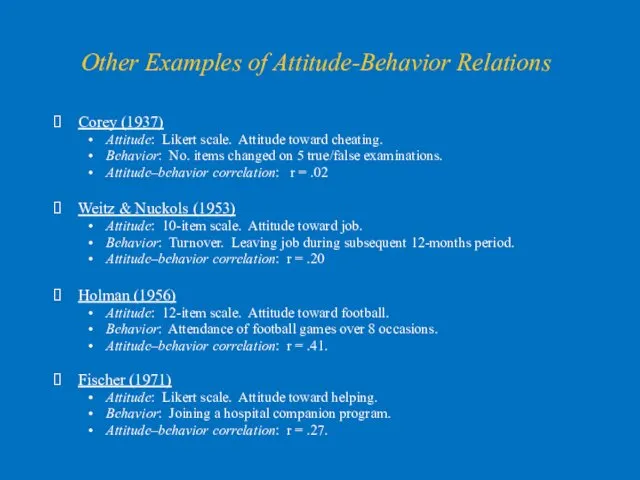
Other Examples of Attitude-Behavior Relations
Corey (1937)
Attitude: Likert scale. Attitude toward cheating.
Behavior:
Other Examples of Attitude-Behavior Relations
Corey (1937)
Attitude: Likert scale. Attitude toward cheating.
Behavior:
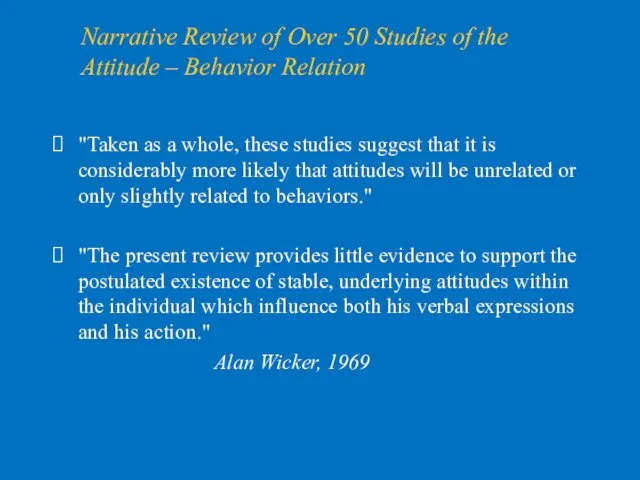
Narrative Review of Over 50 Studies of the
Attitude – Behavior
Narrative Review of Over 50 Studies of the Attitude – Behavior
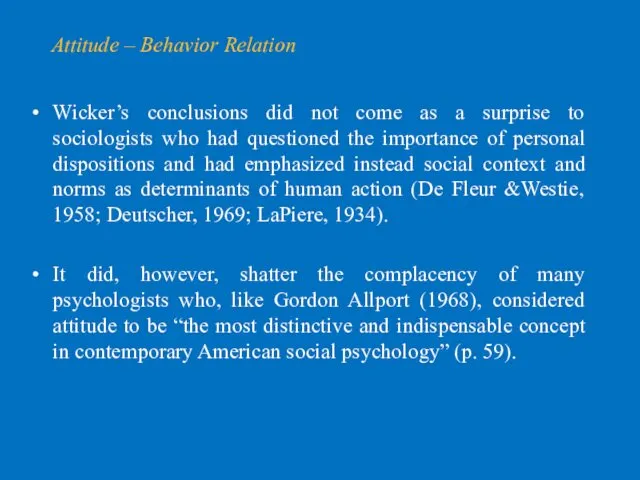
Wicker’s conclusions did not come as a surprise to sociologists who
Wicker’s conclusions did not come as a surprise to sociologists who
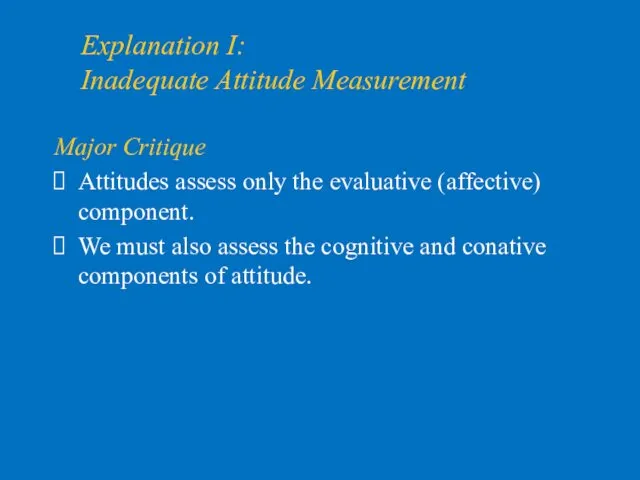
Explanation I:
Inadequate Attitude Measurement
Major Critique
Attitudes assess only the evaluative (affective)
Explanation I:
Inadequate Attitude Measurement
Major Critique
Attitudes assess only the evaluative (affective)
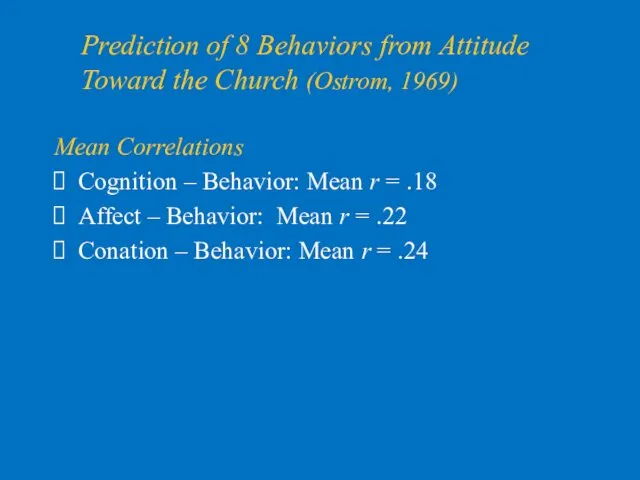
Prediction of 8 Behaviors from Attitude Toward the Church (Ostrom, 1969)
Mean
Prediction of 8 Behaviors from Attitude Toward the Church (Ostrom, 1969)
Mean
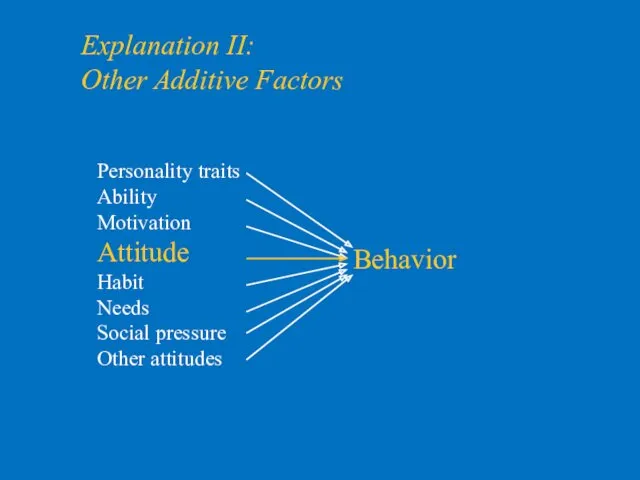
Explanation II:
Other Additive Factors
Behavior
Personality traits
Ability
Motivation
Attitude
Habit
Needs
Social pressure
Other attitudes
Explanation II:
Other Additive Factors
Behavior
Personality traits
Ability
Motivation
Attitude
Habit
Needs
Social pressure
Other attitudes

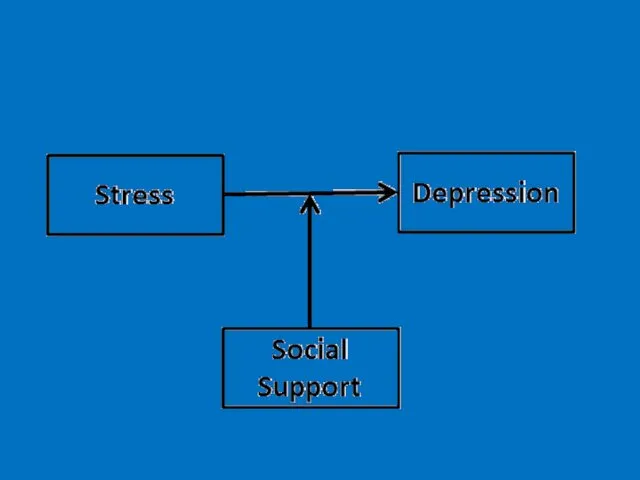
Explanation III:
Moderating Variables
Personality
Self-monitoring (Snyder & Swann, 1976)
Private self-consciousness (Scheier et al.,
Explanation III:
Moderating Variables
Personality
Self-monitoring (Snyder & Swann, 1976)
Private self-consciousness (Scheier et al.,
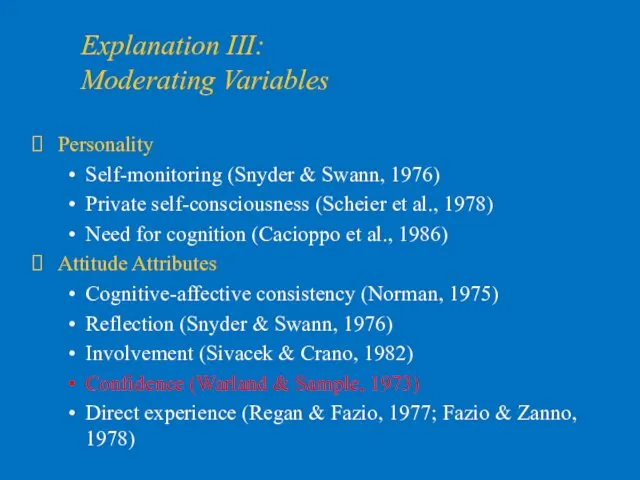
Explanation III:
Moderating Variables
Personality
Self-monitoring (Snyder & Swann, 1976)
Private self-consciousness (Scheier et al.,
Explanation III:
Moderating Variables
Personality
Self-monitoring (Snyder & Swann, 1976)
Private self-consciousness (Scheier et al.,
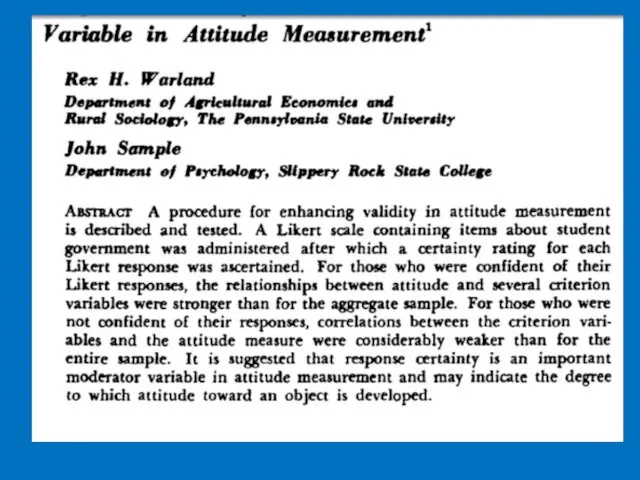
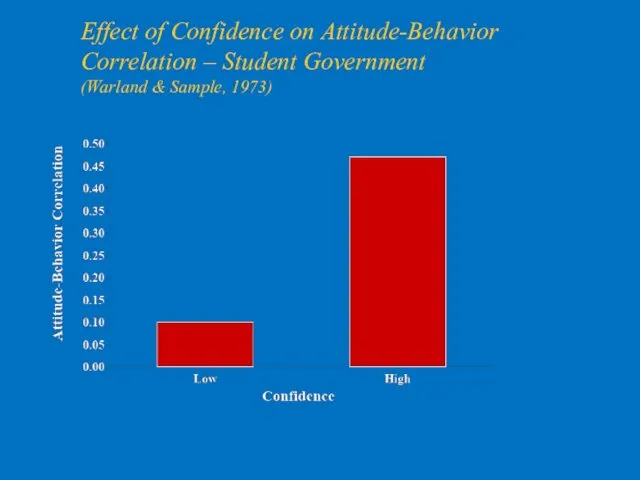
Effect of Confidence on Attitude-Behavior Correlation – Student Government
(Warland &
Effect of Confidence on Attitude-Behavior Correlation – Student Government (Warland &
Problems of Moderating Variables Approach
1. High attitude-behavior correlation only for some
Problems of Moderating Variables Approach
1. High attitude-behavior correlation only for some
Problems of Moderating Variables Approach
1. High attitude-behavior correlation only for some
Problems of Moderating Variables Approach
1. High attitude-behavior correlation only for some
Problems of Moderating Variables Approach
1. High attitude-behavior correlation only for some
Problems of Moderating Variables Approach
1. High attitude-behavior correlation only for some

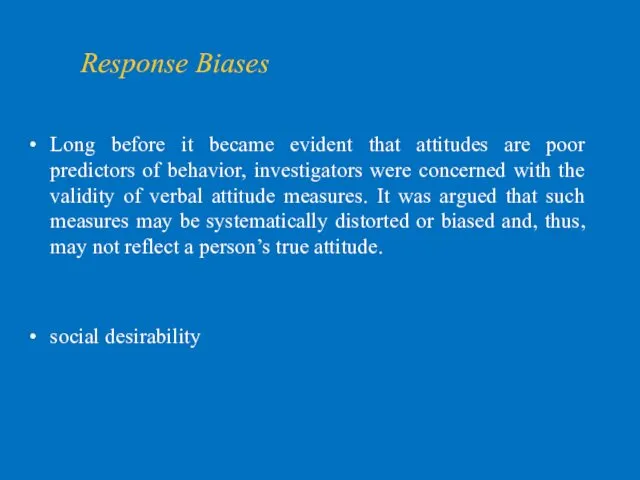
Response Biases
Long before it became evident that attitudes are poor predictors
Response Biases
Long before it became evident that attitudes are poor predictors
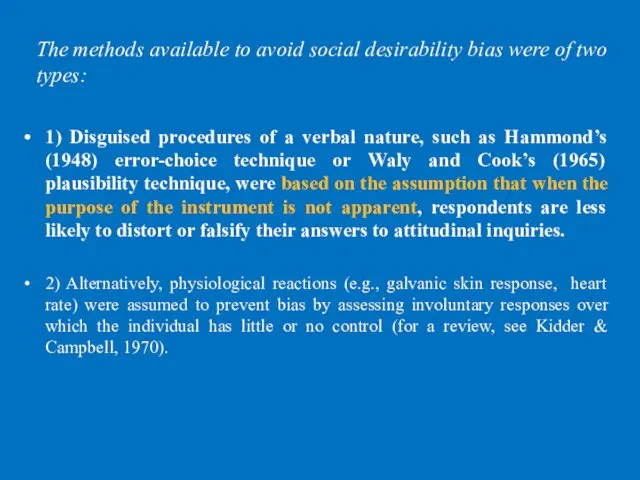
The methods available to avoid social desirability bias were of two
The methods available to avoid social desirability bias were of two
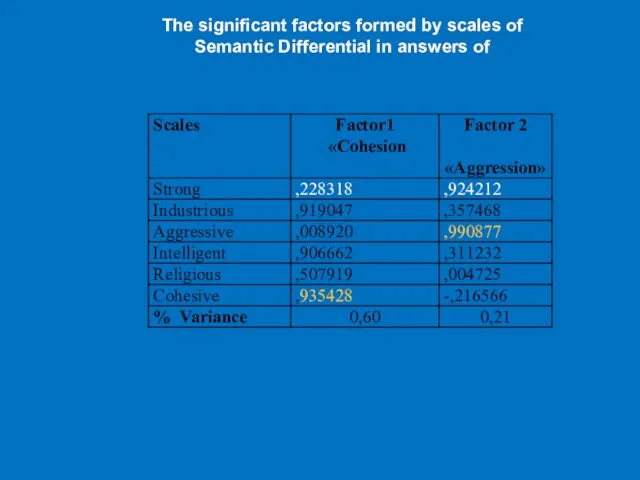
The significant factors formed by scales of
Semantic Differential in answers of
The significant factors formed by scales of
Semantic Differential in answers of
Graphic representation of modalities on the two factor axes of FA
Graphic representation of modalities on the two factor axes of FA
Graphic representation of modalities on the two factor axes of FA
Graphic representation of modalities on the two factor axes of FA

Graphic representation of modalities on the two factor axes of FA
Graphic representation of modalities on the two factor axes of FA
Graphic representation of modalities on the two factor axes of FA
Graphic representation of modalities on the two factor axes of FA
Graphic representation of modalities on the two factor axes of FA
Graphic representation of modalities on the two factor axes of FA
The methods available to avoid social desirability bias were of two
The methods available to avoid social desirability bias were of two
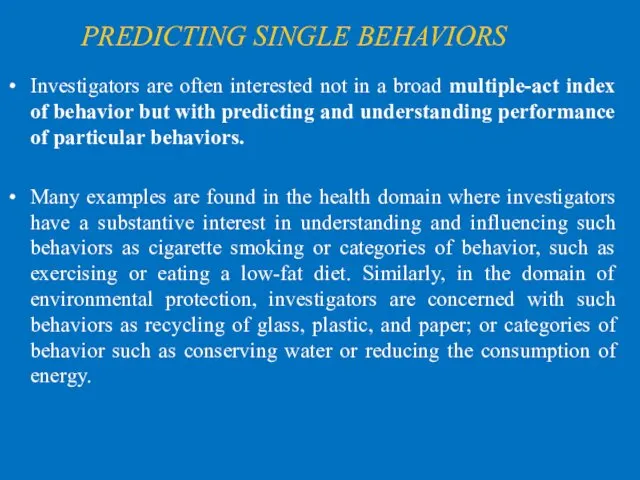
PREDICTING SINGLE BEHAVIORS
Investigators are often interested not in a broad multiple-act
PREDICTING SINGLE BEHAVIORS
Investigators are often interested not in a broad multiple-act
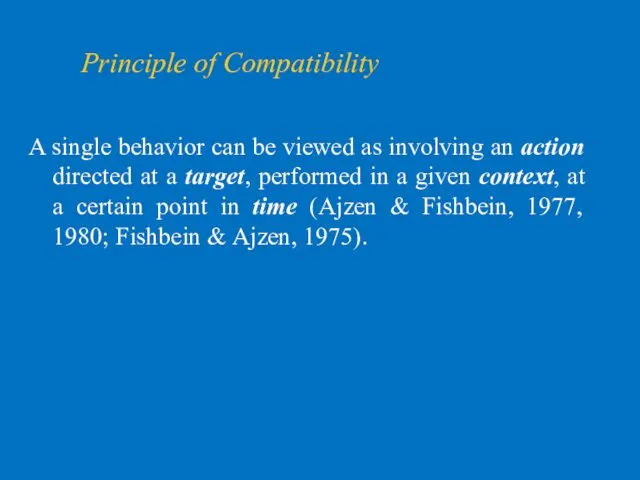
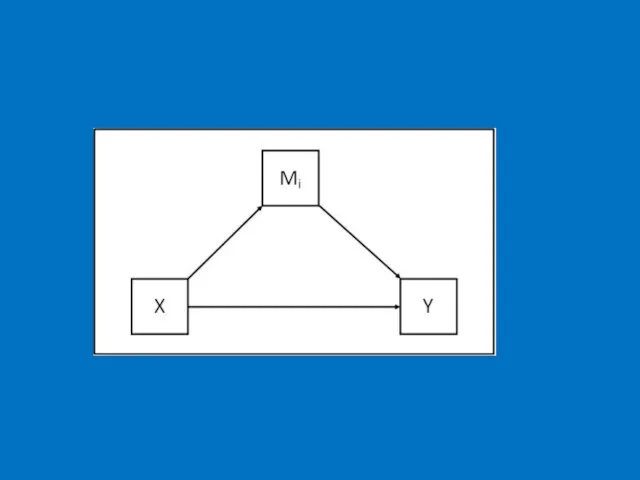
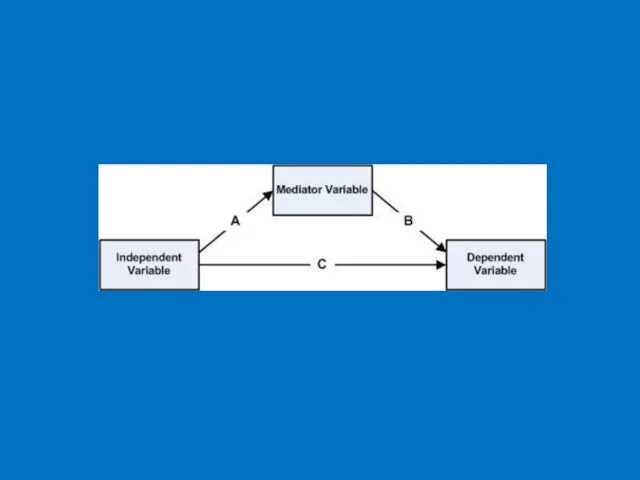
Principle of Compatibility
A single behavior can be viewed as involving an
Principle of Compatibility
A single behavior can be viewed as involving an
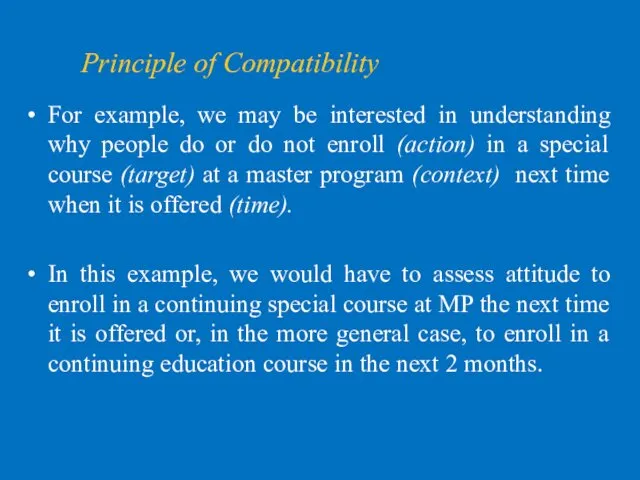
Principle of Compatibility
For example, we may be interested in understanding why
Principle of Compatibility
For example, we may be interested in understanding why
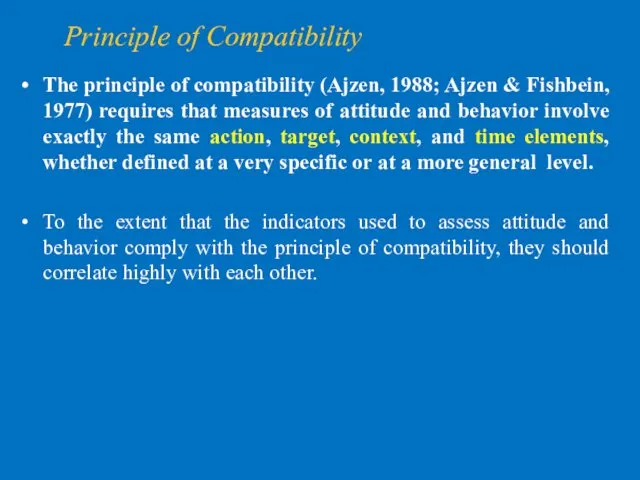
Principle of Compatibility
The principle of compatibility (Ajzen, 1988; Ajzen & Fishbein,
Principle of Compatibility
The principle of compatibility (Ajzen, 1988; Ajzen & Fishbein,
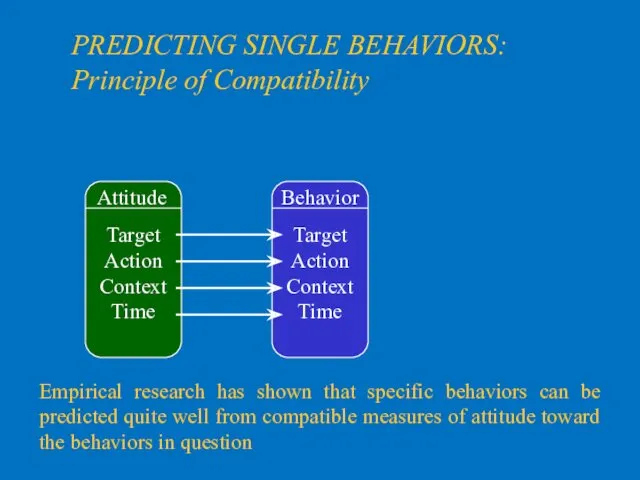
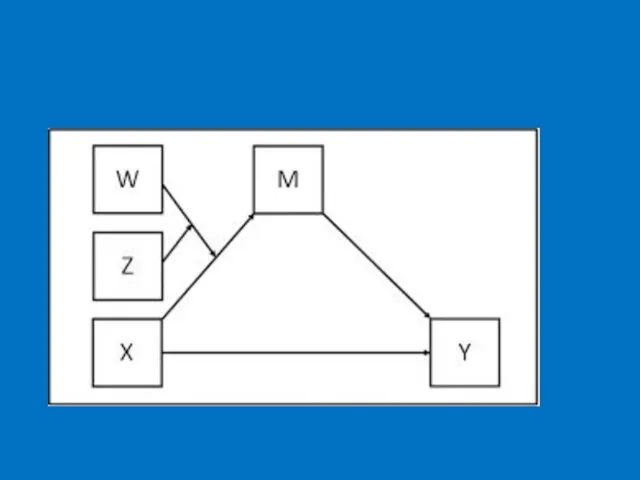
PREDICTING SINGLE BEHAVIORS: Principle of Compatibility
Attitude
Target
Action
Context
Time
Behavior
Target
Action
Context
Time
Empirical research has shown that specific
PREDICTING SINGLE BEHAVIORS: Principle of Compatibility
Attitude
Target
Action
Context
Time
Behavior
Target
Action
Context
Time
Empirical research has shown that specific
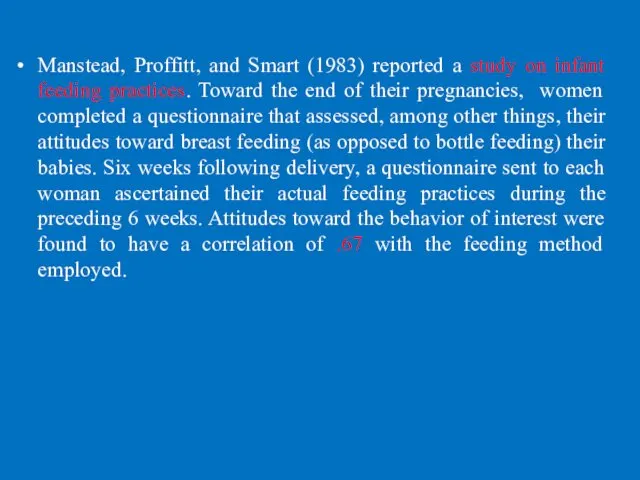
Manstead, Proffitt, and Smart (1983) reported a study on infant feeding
Manstead, Proffitt, and Smart (1983) reported a study on infant feeding
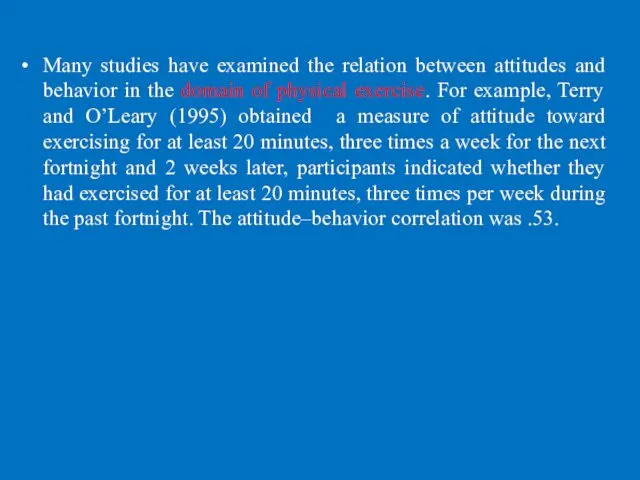
Many studies have examined the relation between attitudes and behavior in
Many studies have examined the relation between attitudes and behavior in
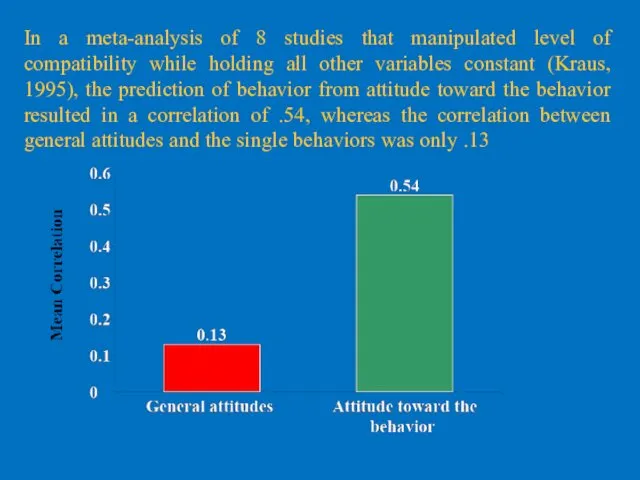
In a meta-analysis of 8 studies that manipulated level of compatibility
In a meta-analysis of 8 studies that manipulated level of compatibility
Intention and behaviour
Intention and behaviour
Intentions as Predictors of Behavior
The previous discussion indicates that, consistent with
Intentions as Predictors of Behavior
The previous discussion indicates that, consistent with
Intentions as Predictors of Behavior
Many studies have substantiated the predictive validity
Intentions as Predictors of Behavior
Many studies have substantiated the predictive validity
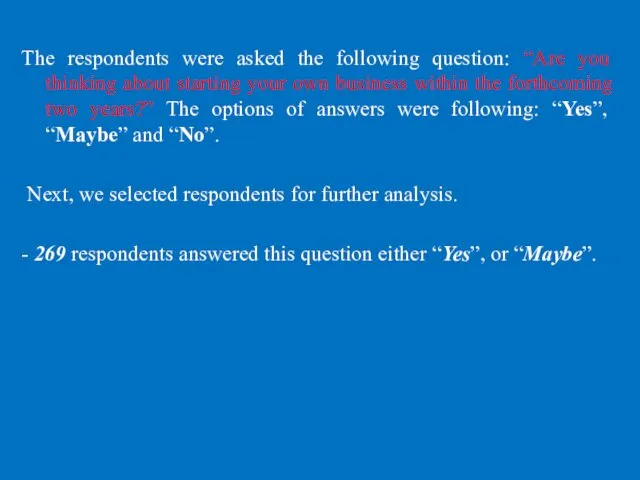
The respondents were asked the following question: “Are you thinking about
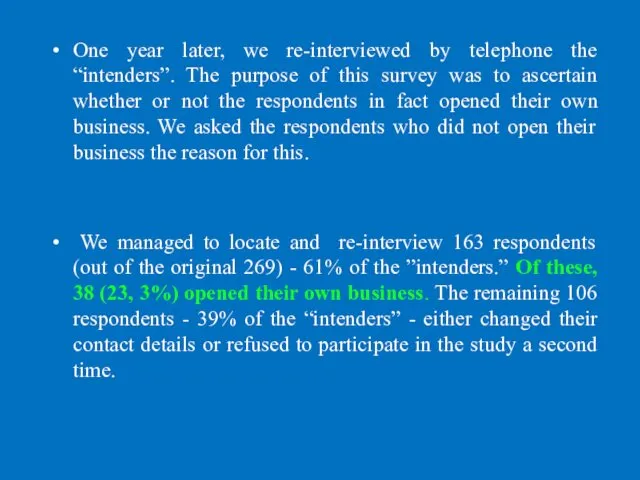
One year later, we re-interviewed by telephone the “intenders”. The purpose
One year later, we re-interviewed by telephone the “intenders”. The purpose
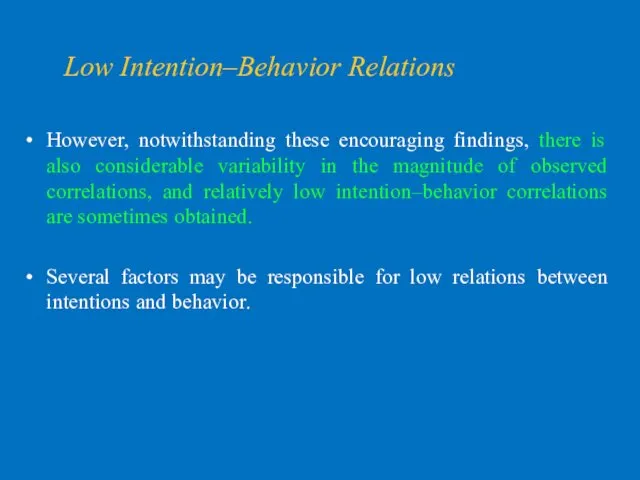
Low Intention–Behavior Relations
However, notwithstanding these encouraging findings, there is also considerable
Low Intention–Behavior Relations
However, notwithstanding these encouraging findings, there is also considerable
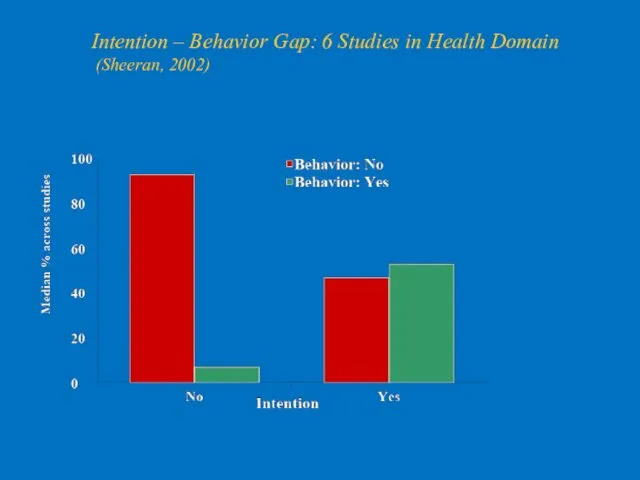
Intention – Behavior Gap: 6 Studies in Health Domain (Sheeran, 2002)
Intention – Behavior Gap: 6 Studies in Health Domain (Sheeran, 2002)
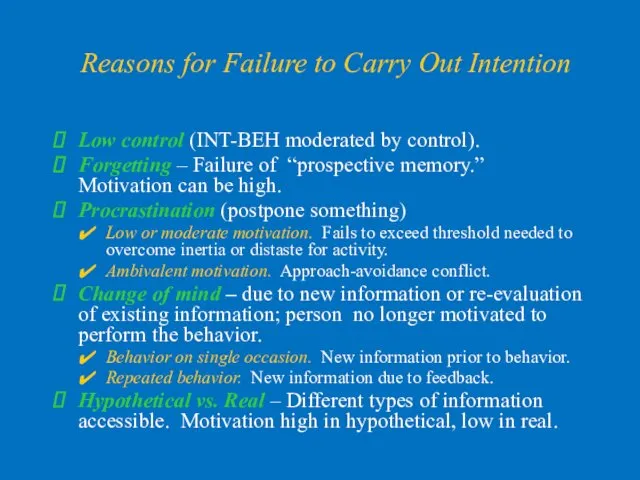
Reasons for Failure to Carry Out Intention
Low control (INT-BEH moderated by
Reasons for Failure to Carry Out Intention
Low control (INT-BEH moderated by
Attitudes toward specific behaviors are good predictors of single actions.
General
Attitudes toward specific behaviors are good predictors of single actions.
General
New models of relation between attitude and behavior appeared as a
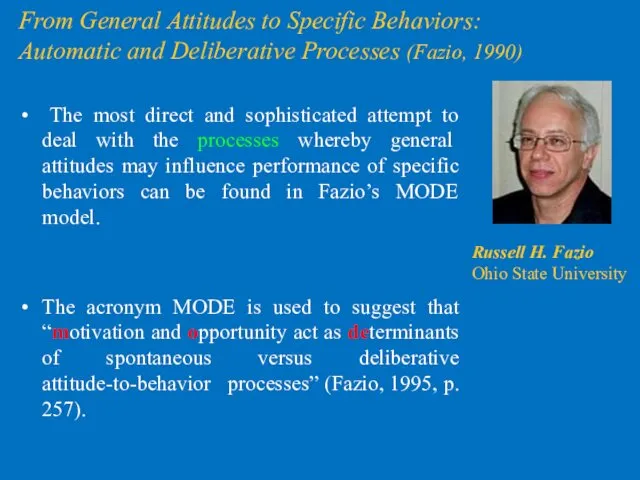
From General Attitudes to Specific Behaviors: Automatic and Deliberative Processes (Fazio,
From General Attitudes to Specific Behaviors: Automatic and Deliberative Processes (Fazio,
From General Attitudes to Specific Behaviors: Automatic and Deliberative Processes (Fazio,
From General Attitudes to Specific Behaviors: Automatic and Deliberative Processes (Fazio,
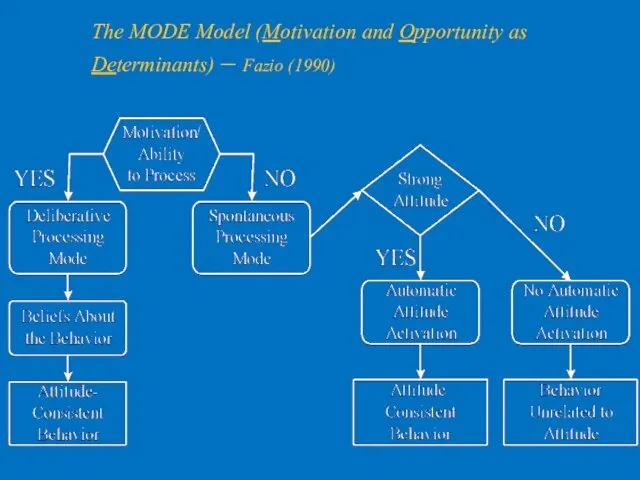
The MODE Model (Motivation and Opportunity as Determinants) – Fazio (1990)
The MODE Model (Motivation and Opportunity as Determinants) – Fazio (1990)
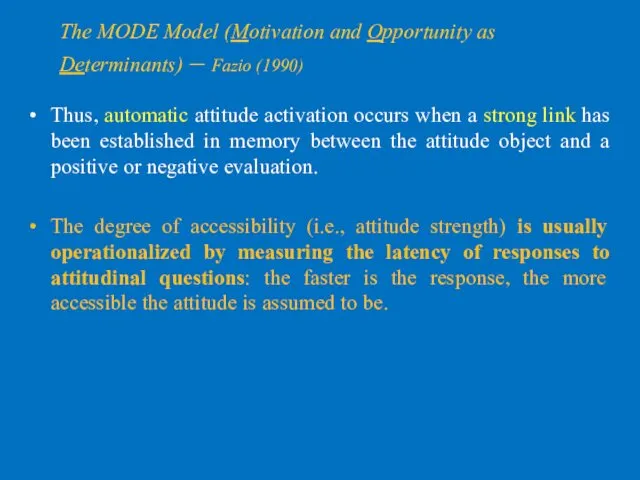
Thus, automatic attitude activation occurs when a strong link has been
Studies that were designed to test directly the MODE model’s predictions
Studies that were designed to test directly the MODE model’s predictions
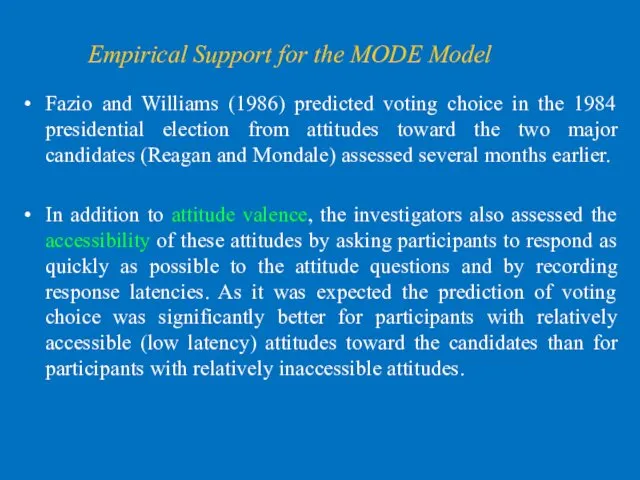
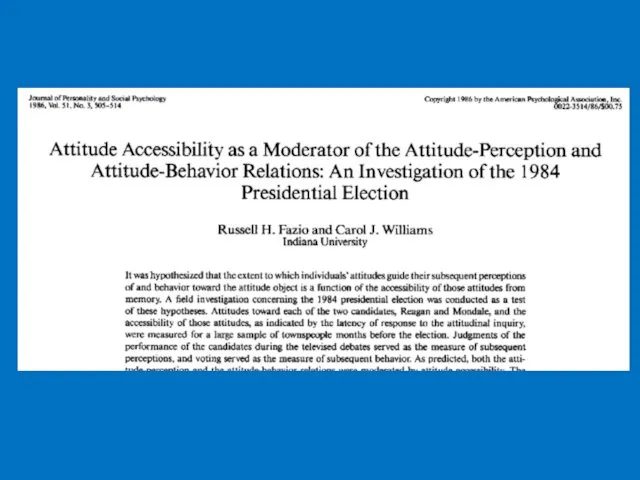
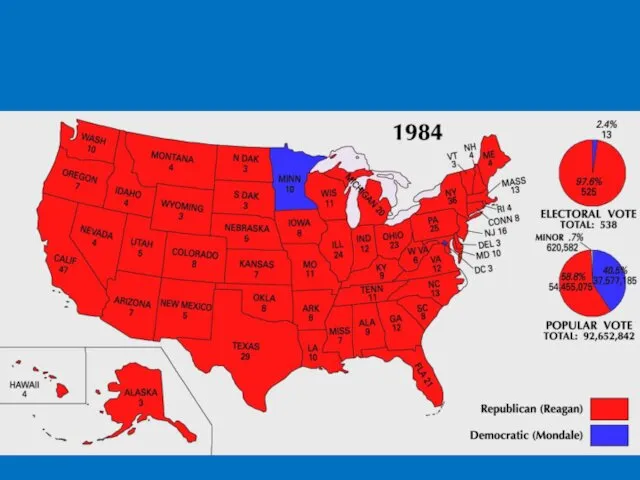
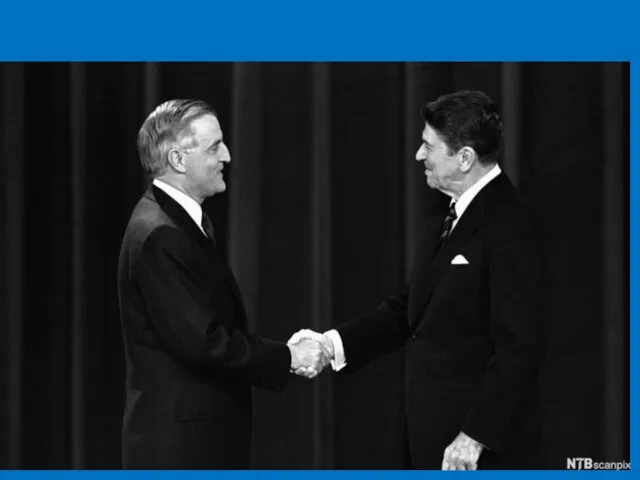
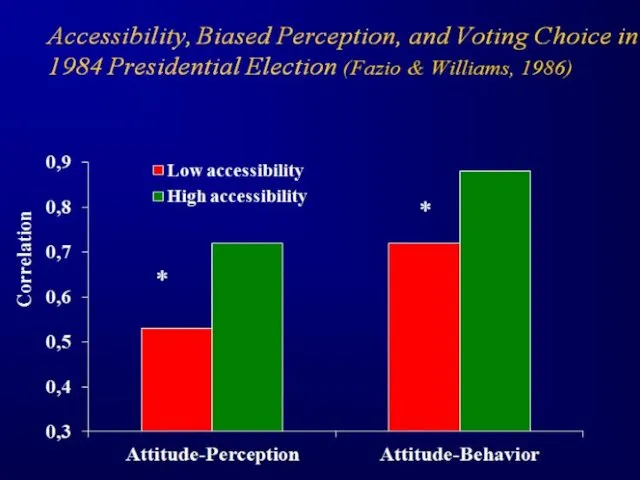
Fazio and Williams (1986) predicted voting choice in the 1984 presidential
Fazio and Williams (1986) predicted voting choice in the 1984 presidential

Ronald Reagan
Ronald Reagan

Walter Mondale
Walter Mondale
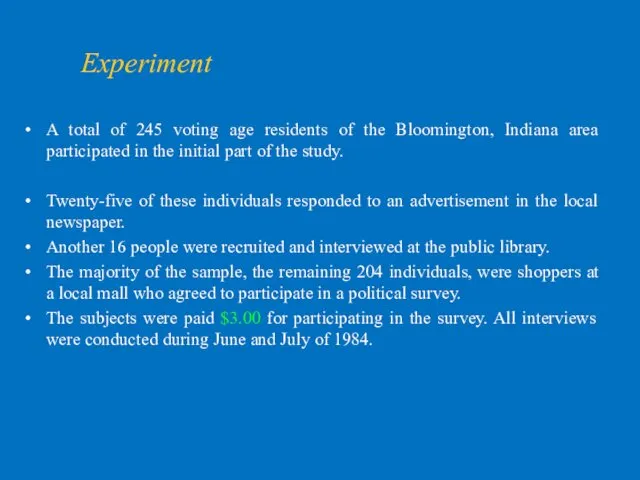
A total of 245 voting age residents of the Bloomington, Indiana
A total of 245 voting age residents of the Bloomington, Indiana
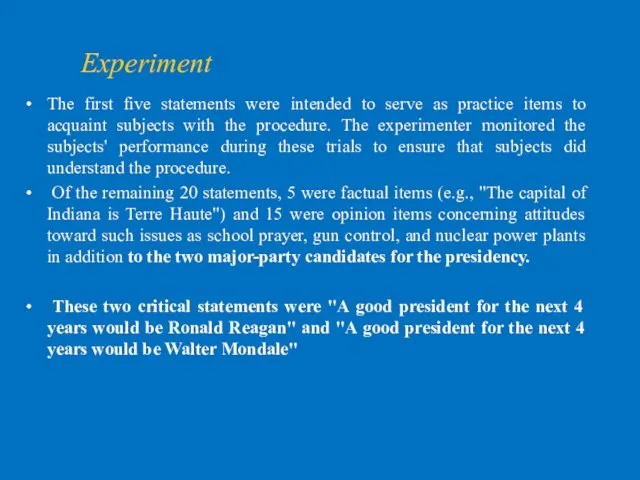
Experiment
The first five statements were intended to serve as practice items
Experiment
The first five statements were intended to serve as practice items
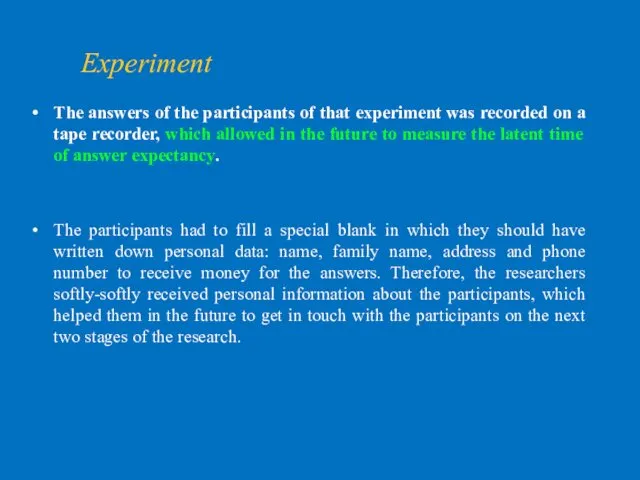
The answers of the participants of that experiment was recorded on
The answers of the participants of that experiment was recorded on
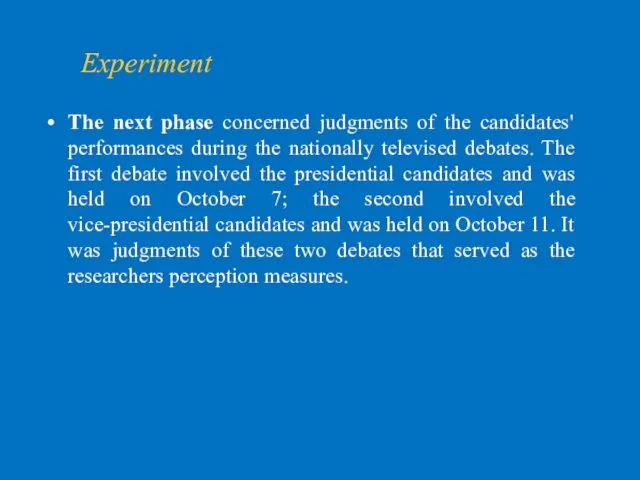
The next phase concerned judgments of the candidates' performances during the
The next phase concerned judgments of the candidates' performances during the
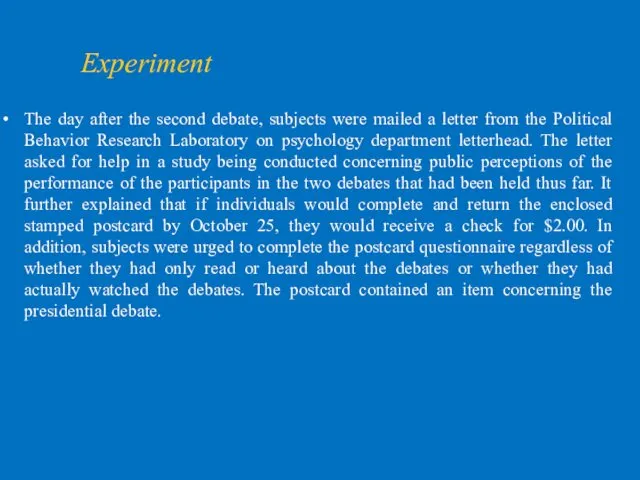
The day after the second debate, subjects were mailed a letter
The day after the second debate, subjects were mailed a letter
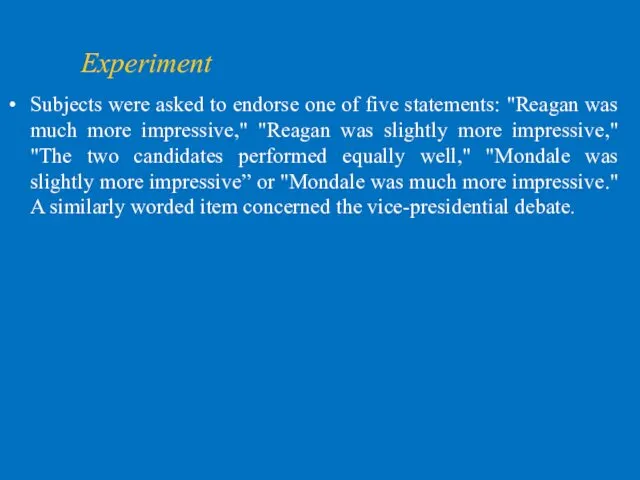
Subjects were asked to endorse one of five statements: "Reagan was
Subjects were asked to endorse one of five statements: "Reagan was
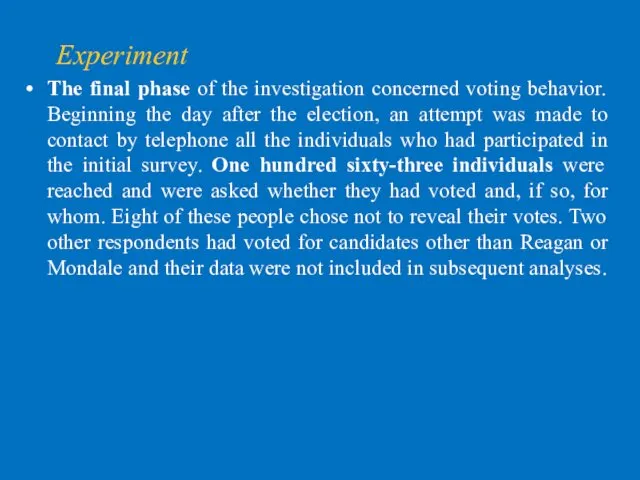
The final phase of the investigation concerned voting behavior. Beginning the
The final phase of the investigation concerned voting behavior. Beginning the
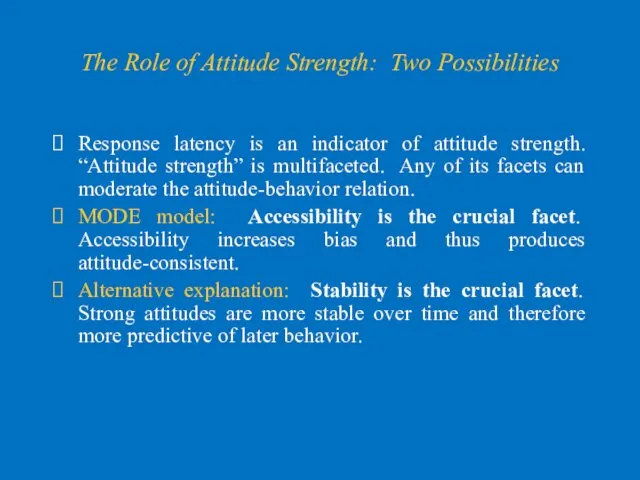
The Role of Attitude Strength: Two Possibilities
Response latency is an indicator
The Role of Attitude Strength: Two Possibilities
Response latency is an indicator
Stability of Intentions
Perhaps more important, if intentions change after they are
Stability of Intentions
Perhaps more important, if intentions change after they are
Stability of Intentions
Instead of relying on time interval as an indication
Stability of Intentions
Instead of relying on time interval as an indication
Stability of Intentions
In one of these investigations (Sheeran, Orbell, & Trafimow,
Stability of Intentions
In one of these investigations (Sheeran, Orbell, & Trafimow,
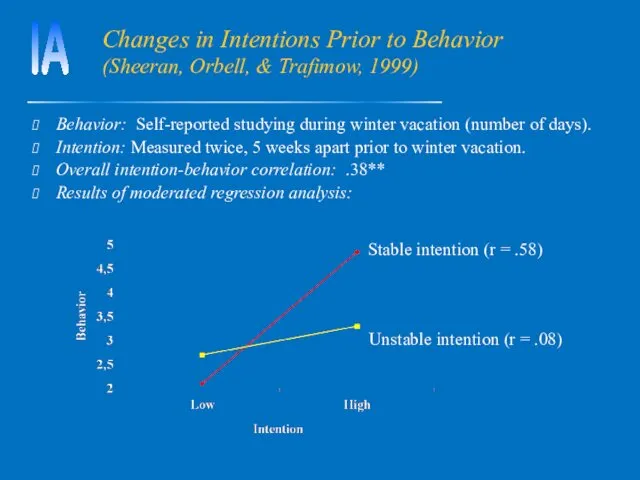
Changes in Intentions Prior to Behavior (Sheeran, Orbell, & Trafimow, 1999)
Behavior:
Changes in Intentions Prior to Behavior (Sheeran, Orbell, & Trafimow, 1999)
Behavior:
 Формирование социальной компетенции на уроке иностранного языка
 Будь смелым
 Работа с понятиями и создание визуальных образов на занятиях в курсе истории
 Устранение причин стресса путем совершенствования поведенческих навыков
 Межличностные отношения. Тема 6
 Психологические особенности детей с ОВЗ
 Педагогические ситуации и пути их разрешения
 Роль взрослого в формировании у детей отношения к сверстникам в ситуации игрового взаимодействия и в повседневной жизни
 Стресс для использования школьными психологами.
 Домашнее насилие
 Речевое развитие ребёнка
 Альтернативная коммуникация
 Психология мотивации и эмоций
 Сексуальное и репродуктивное поведение
 Как достичь цели
 Подростки и секс
 Я-высказывание
 Общая характеристика психологии в эпоху Средневековья
 Управление стрессом
 Классификация возрастных периодов по Д. Б. Эльконину
 Дизонтогенез психического развития. Классификация психического дизонтогенеза
 Игра и роль игрушки
 Сознательное и бессознательное
 Осознанное сновидение
 Деловая дискуссия. Публичное выступление
 Профессиограмма
 Учимся, играя!. Качество мышления
 Психологическая безопасность образовательной среды