- Admissions statistics on undergraduate programs

Содержание
- 2. Statistics on Students Admitted to the NU undergraduate programs 2014-2019
- 3. Statistics on Students Admitted by NU Schools 2014-2019 * With students who were enrolled to BApn
- 4. Statistics on Students Admitted by Category 2014-2019 * Without BApn program students
- 5. Statistics on Average Scores of IELTS and GPA (admitted students) 2014-2019
- 6. Statistics on SAT1–Reasoning Test Average Scores (admitted students) 2014-2019 without students who were enrolled on fee-paying
- 7. Statistics on SAT 2–Subject Test Average Scores (admitted students) 2014-2019 without students who were enrolled on
- 9. Скачать презентацию
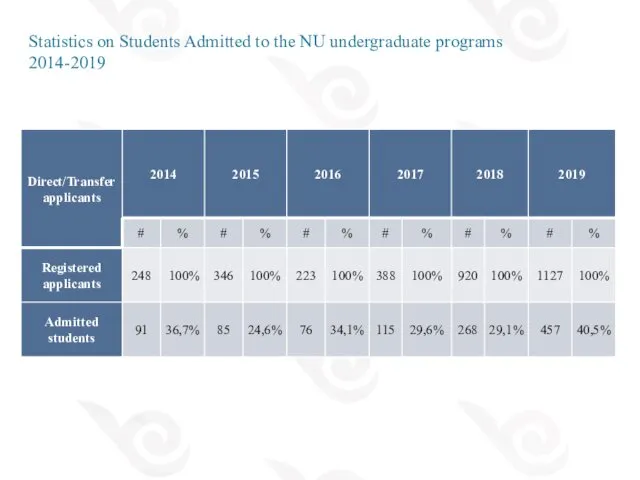
Statistics on Students Admitted to the NU undergraduate programs 2014-2019
Statistics on Students Admitted to the NU undergraduate programs 2014-2019
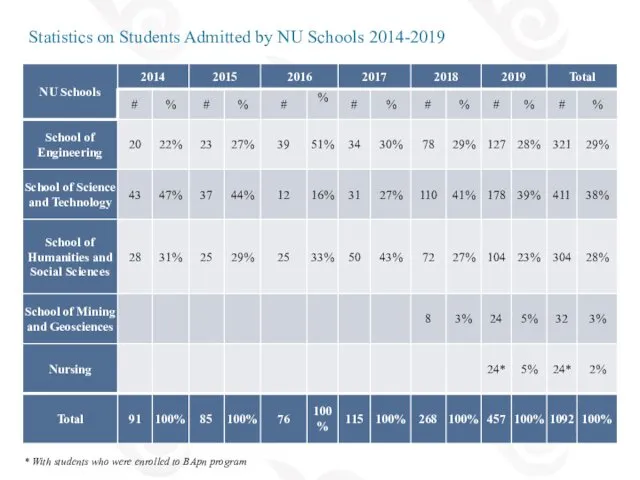
Statistics on Students Admitted by NU Schools 2014-2019
* With students who
Statistics on Students Admitted by NU Schools 2014-2019
* With students who
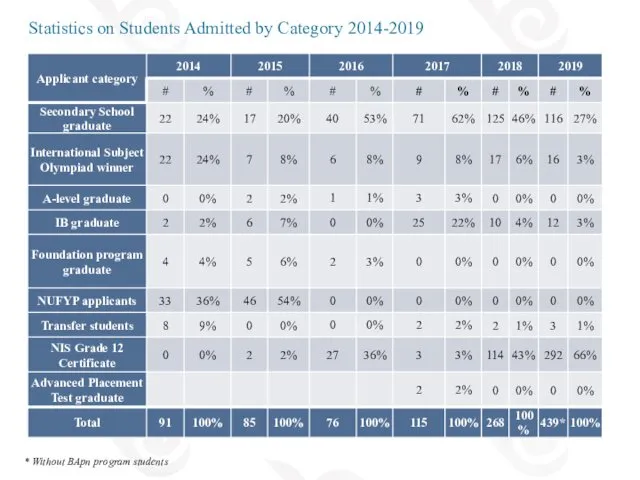
Statistics on Students Admitted by Category 2014-2019
* Without BApn program students
Statistics on Students Admitted by Category 2014-2019
* Without BApn program students
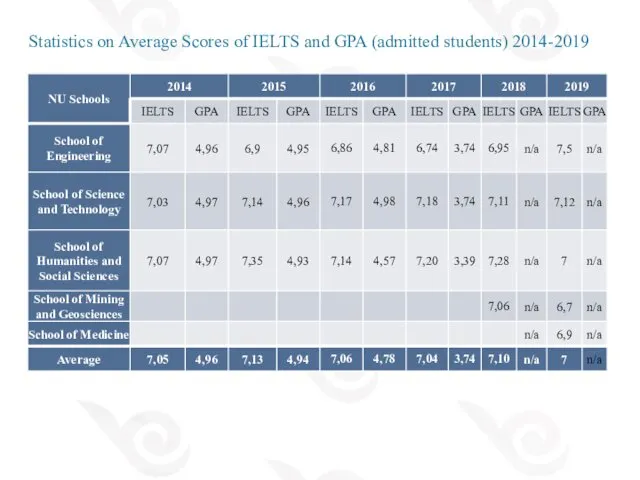
Statistics on Average Scores of IELTS and GPA (admitted students) 2014-2019
Statistics on Average Scores of IELTS and GPA (admitted students) 2014-2019
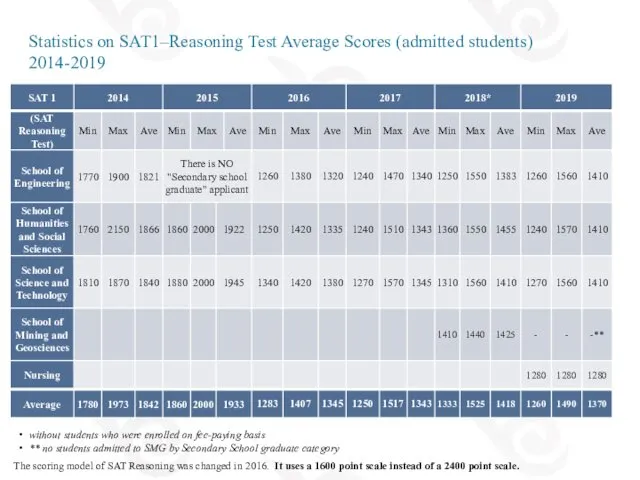
Statistics on SAT1–Reasoning Test Average Scores (admitted students)
2014-2019
without students who were
Statistics on SAT1–Reasoning Test Average Scores (admitted students)
2014-2019
without students who were
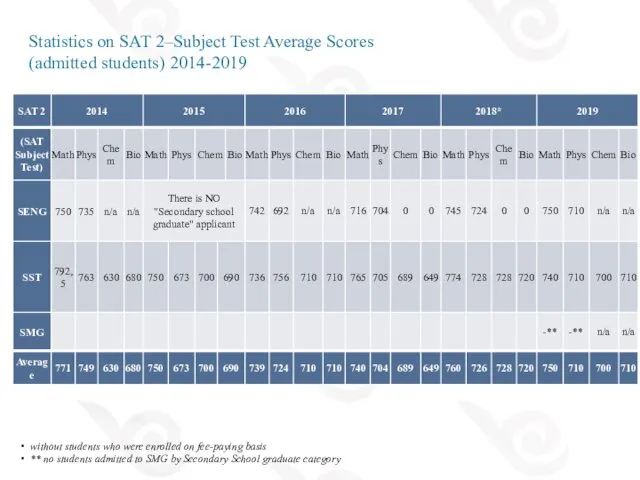
Statistics on SAT 2–Subject Test Average Scores
(admitted students) 2014-2019
without students
Statistics on SAT 2–Subject Test Average Scores
(admitted students) 2014-2019
without students
 Цветочные композиции в бисероплетении
 Проект Художники в русской глубинке
 Тимофеев - (Еф) - шк. 44 им. С.Ф.Бароненко - презентация
 Комбинационные блоки
 Роман Джейн Эйр
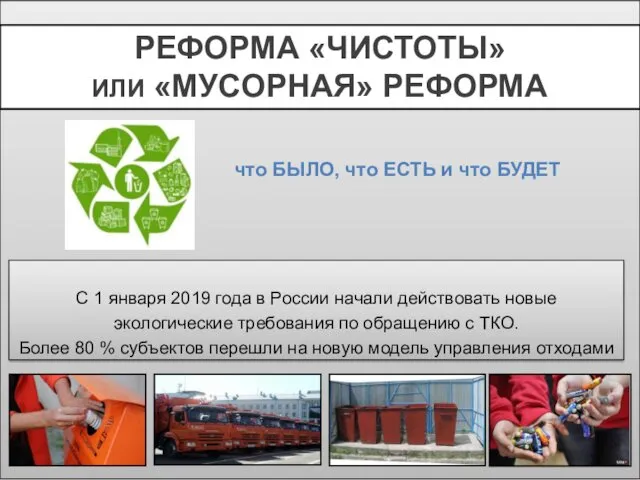 Реформа Чистоты или Мусорная реформа - 2
 Жергілікті жердің нүктелер координаталары және олардың аэросуреттегі сол бейнелердің арасындағы байланыс
 Презентация Металлы в искусстве
 презентации Диск
 Порядок поступления ТМЦ и особенности учета
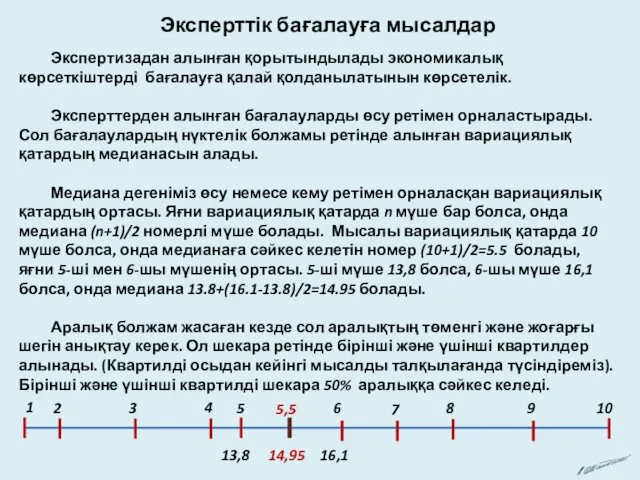 Экспертиза. Пример. Эксперттік бағалауға мысалдар
 Основные принципы конструирования радиоэлектронных устройств
 презентация к уроку краеведения в 6 классе по теме Ядовитые растения Сахалинской области
 Multi-apartment residential building Al-Yasamin in Damascus
 Сказ о деятельности планово-экономического отдела
 Можно всё, друзья, найти в этой сказочной сети!
 Чесменская церковь. Архитектурно-художественная подсветка
 Бабушкин юбилей
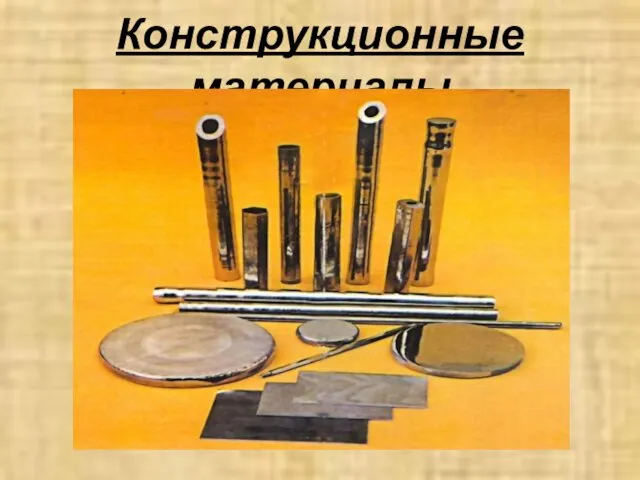 Конструкционные материалы
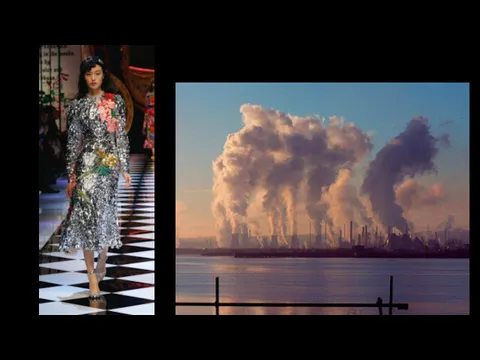 Сlothing industry
 Взаимодействие семьи и школы в духовнонравственном воспитании школьника
 Его имя помнят люди. К 182-ой годовщине со дня смерти А.И. Полежаева
 Загальні положення про право власності: поняття, ознаки і зміст. (Тема 1)
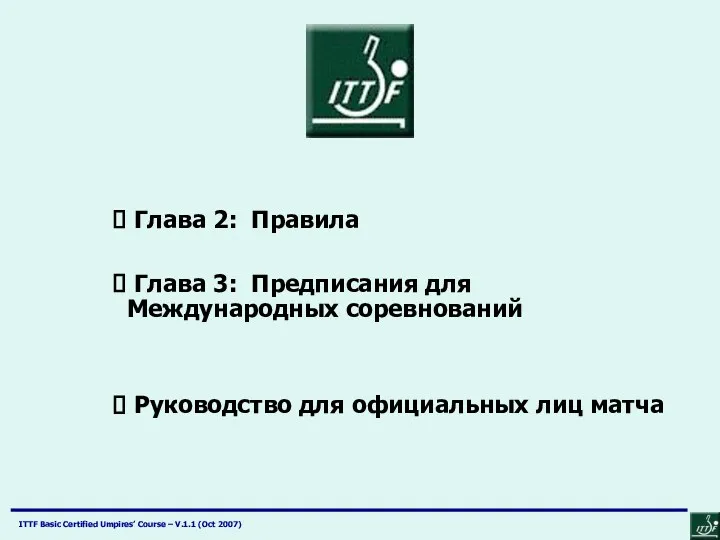 Правила настольного тенниса-2
 Презентация к родительскому собранию Права и обязанности родителей
 Комната. Мебель
 Презентация Птицы Кубани 2015 год
 Ser y estar en español