- Before and after

Содержание
- 2. A First Step Towards Automatic Verification of PDE Code Hans Petter Langtangen Ola Skaghaug Simula Research
- 3. A First Step Towards Automatic Verification of PDE Code Hans Petter Langtangen Ola Skaghaug Simula Research
- 4. Before
- 5. This presentation shows the evolution from a manual environment to one that is automated manual Fortran
- 6. Before
- 7. This presentation compares methods for reducing emissions of sulfur dioxide from coal power plants
- 8. Before
- 9. Converting an analog signal to a digital signal requires a sampling of the signal Accelerometer outputs
- 10. Before
- 11. Although researchers give validation more attention, validation requires successful verification
- 12. Iron An abundant metal, makes up 5.6% of earth’s crust Properties: shaped, sharpened, welded strong, durable
- 13. [Kesler 1994] Iron Ore Distribution [www.star-bits.com] Iron ore Where is the largest concentration of iron ores
- 14. Led to 59% recall Led to 77% recall p Students learning from the transformed slide scored
- 15. Before
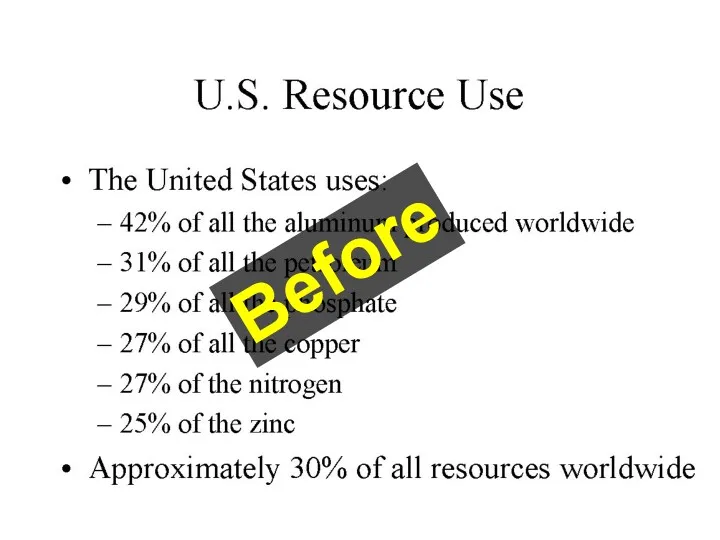
- 16. Although the U.S. has 5% of the world's population, we use an average of 30% of
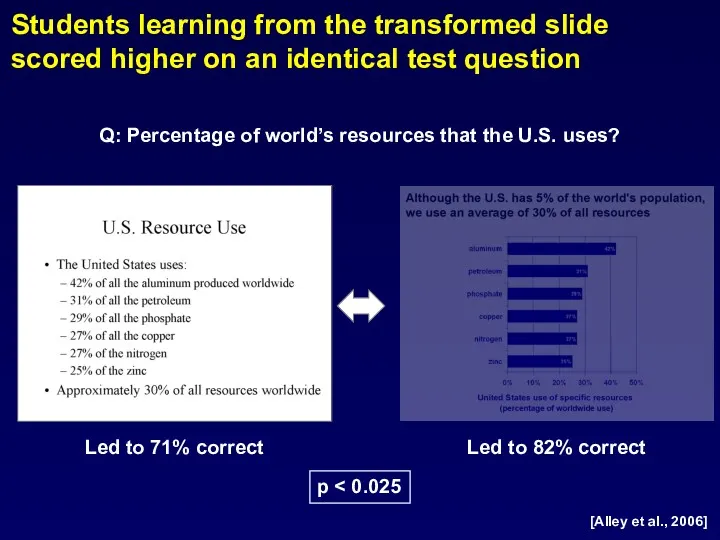
- 17. Led to 71% correct Led to 82% correct Students learning from the transformed slide scored higher
- 18. Before
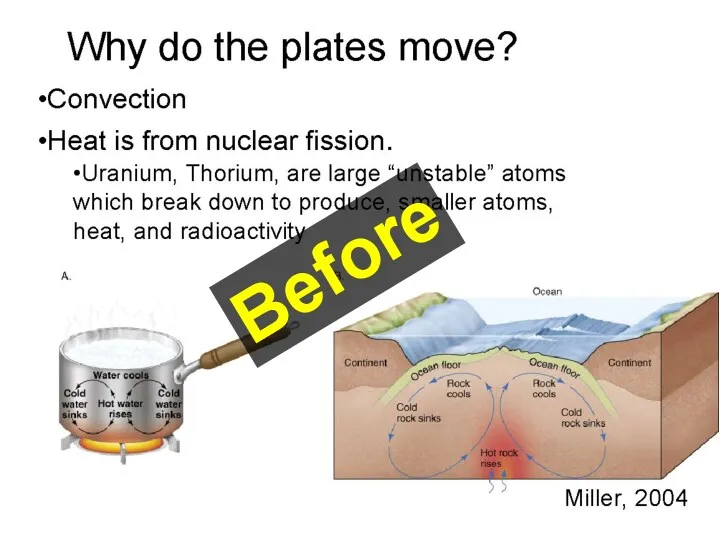
- 19. Plates move because of convection caused by heat from decay of radioactive elements in the mantle
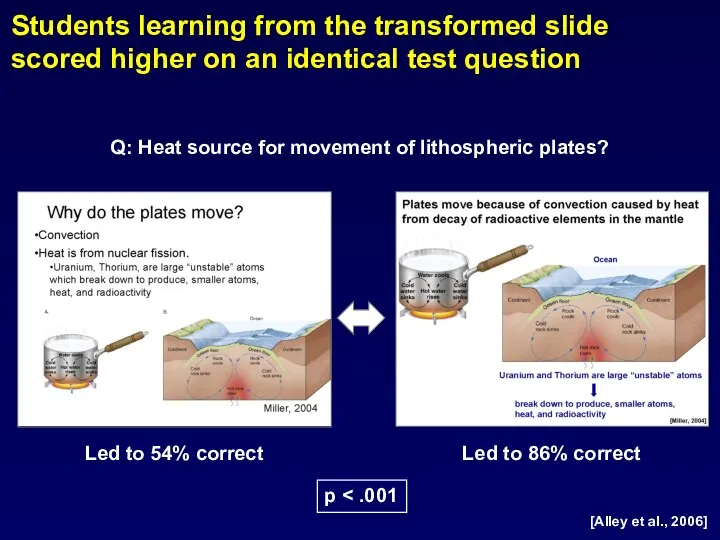
- 20. Led to 54% correct Led to 86% correct Students learning from the transformed slide scored higher
- 21. Fossil Fuels: Who has what? Before
- 22. OPEC countries control about 75% of the world’s oil
- 24. Скачать презентацию
A First Step
Towards Automatic Verification
of PDE Code
Hans Petter Langtangen
Ola Skaghaug
Simula
A First Step
Towards Automatic Verification
of PDE Code
Hans Petter Langtangen
Ola Skaghaug
Simula
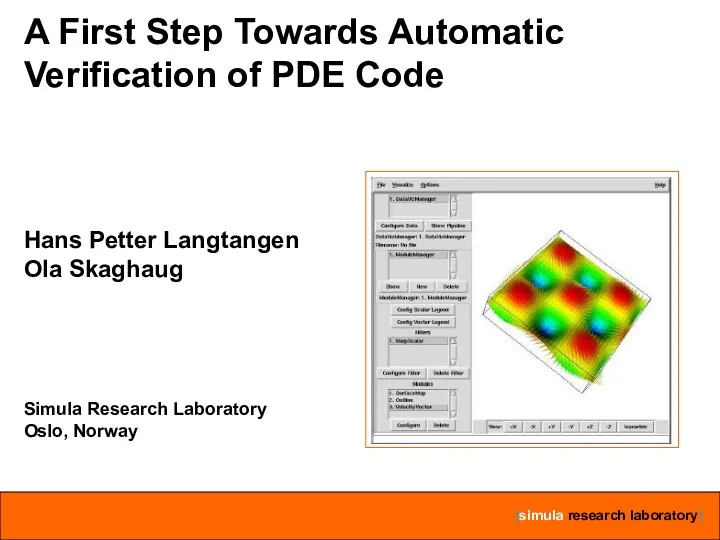
A First Step Towards Automatic
Verification of PDE Code
Hans Petter Langtangen
Ola
A First Step Towards Automatic
Verification of PDE Code
Hans Petter Langtangen
Ola
Before
Before
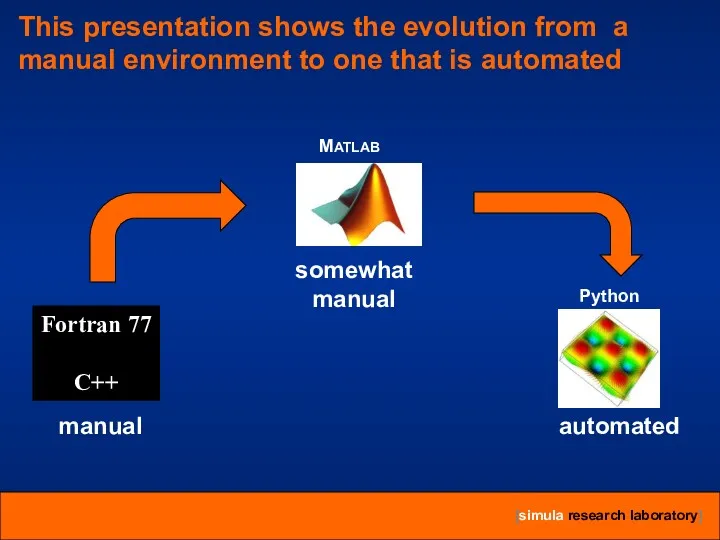
This presentation shows the evolution from a manual environment to one
This presentation shows the evolution from a manual environment to one
Before
Before
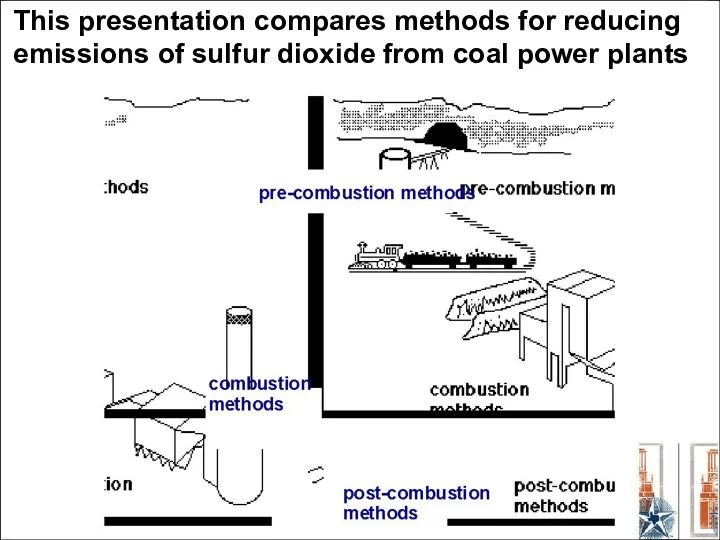
This presentation compares methods for reducing emissions of sulfur dioxide from
This presentation compares methods for reducing emissions of sulfur dioxide from
Before
Before
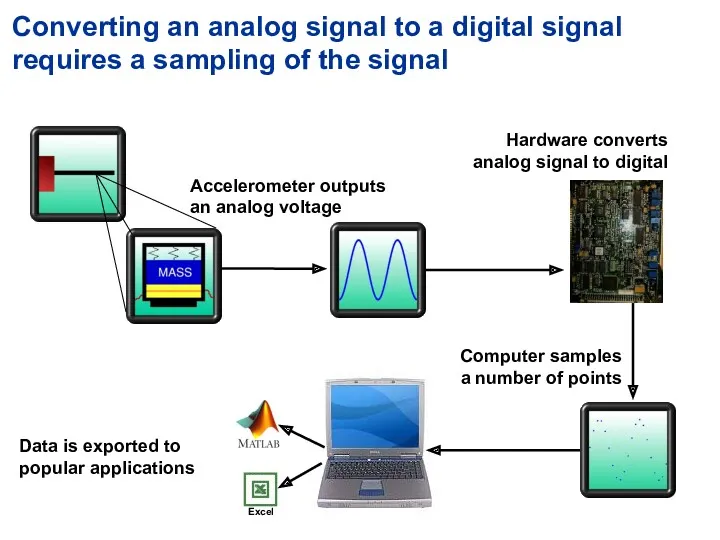
Converting an analog signal to a digital signal requires a sampling
Converting an analog signal to a digital signal requires a sampling
Before
Before
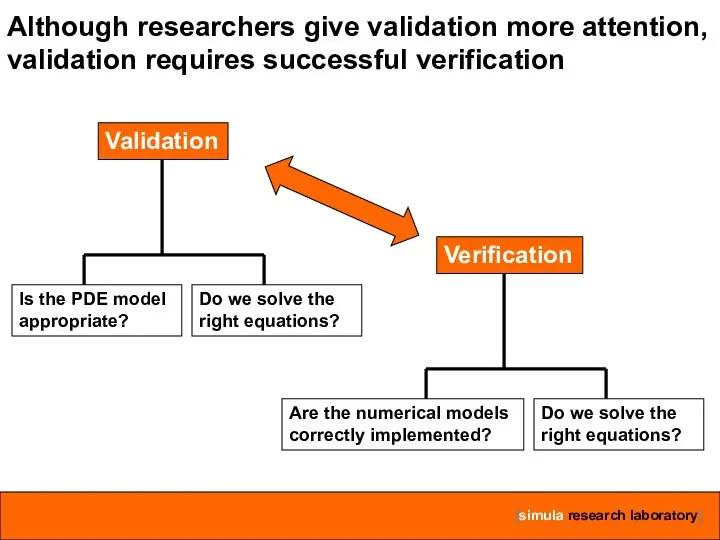
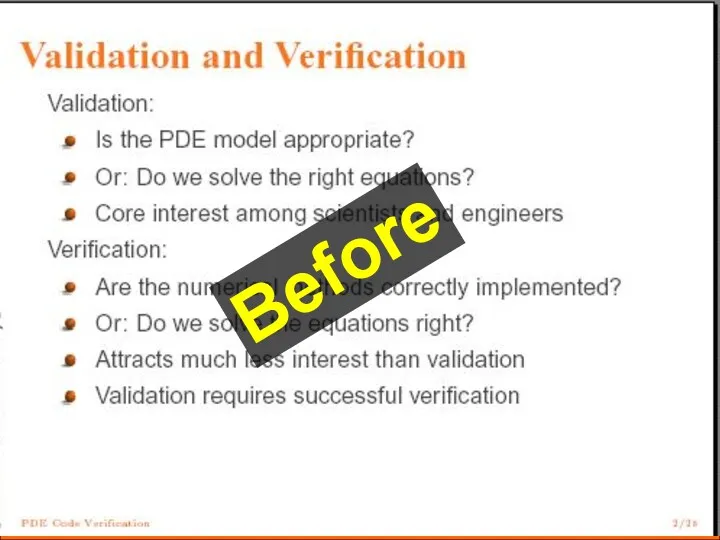
Although researchers give validation more attention, validation requires successful verification
Although researchers give validation more attention, validation requires successful verification
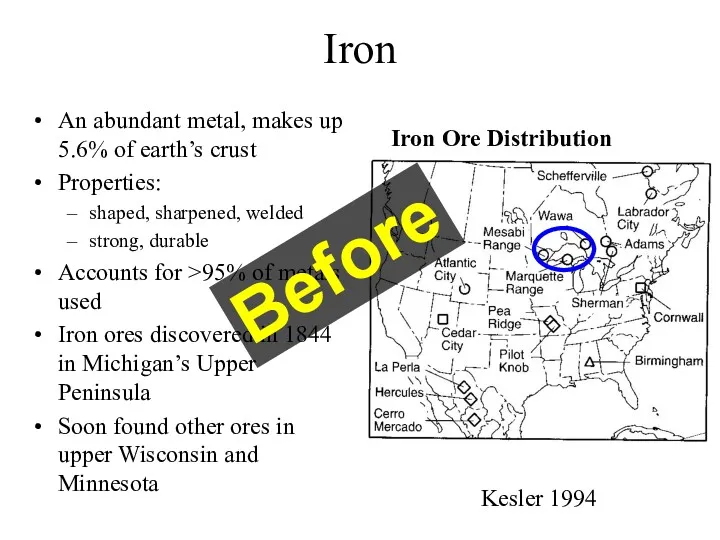
Iron
An abundant metal, makes up 5.6% of earth’s crust
Properties:
shaped,
Iron
An abundant metal, makes up 5.6% of earth’s crust
Properties:
shaped,
![[Kesler 1994] Iron Ore Distribution [www.star-bits.com] Iron ore Where is](/_ipx/f_webp&q_80&fit_contain&s_1440x1080/imagesDir/jpg/27945/slide-12.jpg)
[Kesler 1994]
Iron Ore Distribution
[www.star-bits.com]
Iron ore
Where is the largest concentration of iron
[Kesler 1994]
Iron Ore Distribution
[www.star-bits.com]
Iron ore
Where is the largest concentration of iron
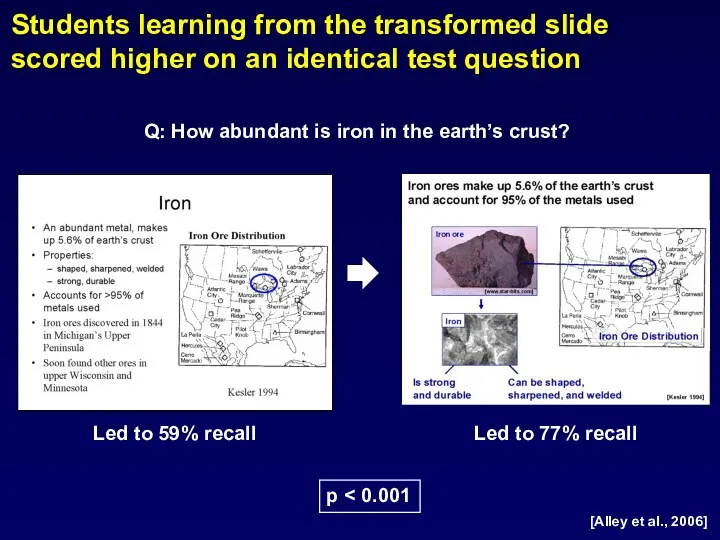
Led to 59% recall
Led to 77% recall
p < 0.001
Students learning from
Led to 59% recall
Led to 77% recall
p < 0.001
Students learning from
Before
Before
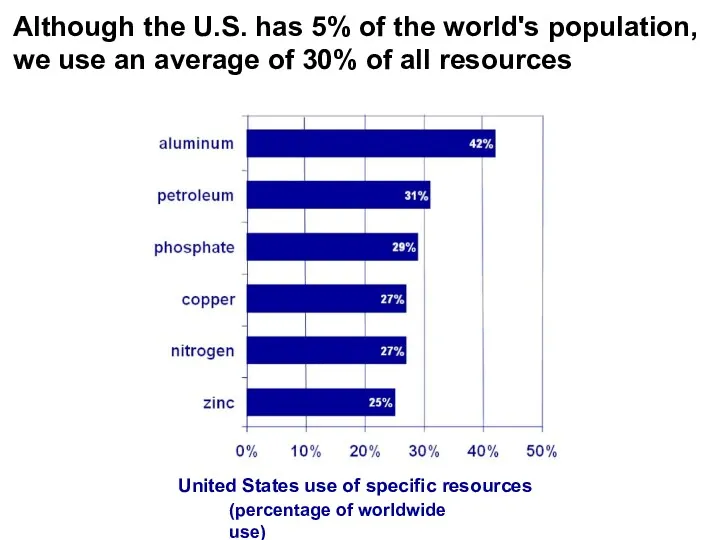
Although the U.S. has 5% of the world's population, we use
Although the U.S. has 5% of the world's population, we use
Led to 71% correct
Led to 82% correct
Students learning from the transformed
Led to 71% correct
Led to 82% correct
Students learning from the transformed
Before
Before
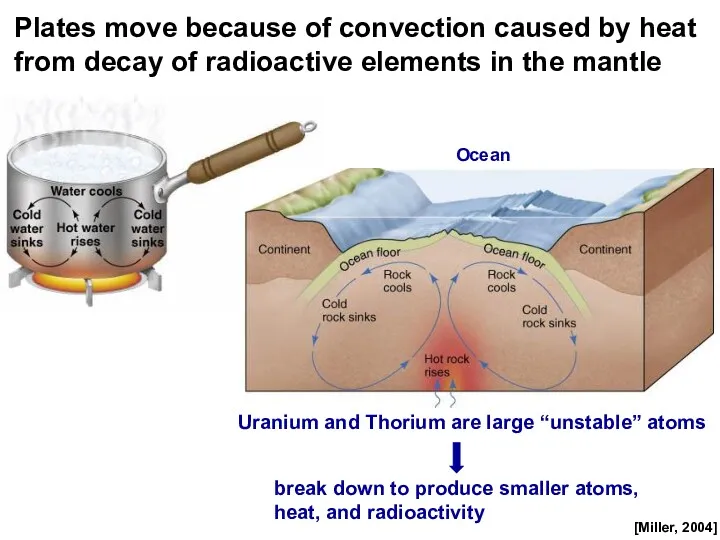
Plates move because of convection caused by heat from decay of
Plates move because of convection caused by heat from decay of
Led to 54% correct
Led to 86% correct
Students learning from the transformed
Led to 54% correct
Led to 86% correct
Students learning from the transformed
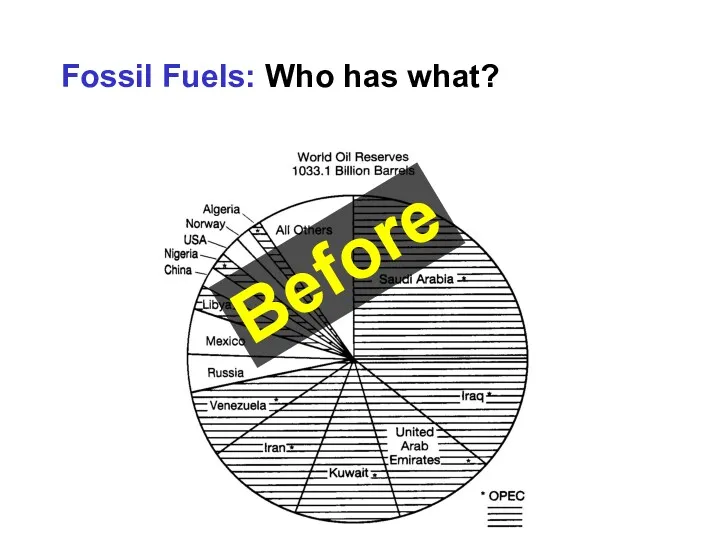
Fossil Fuels: Who has what?
Before
Fossil Fuels: Who has what?
Before
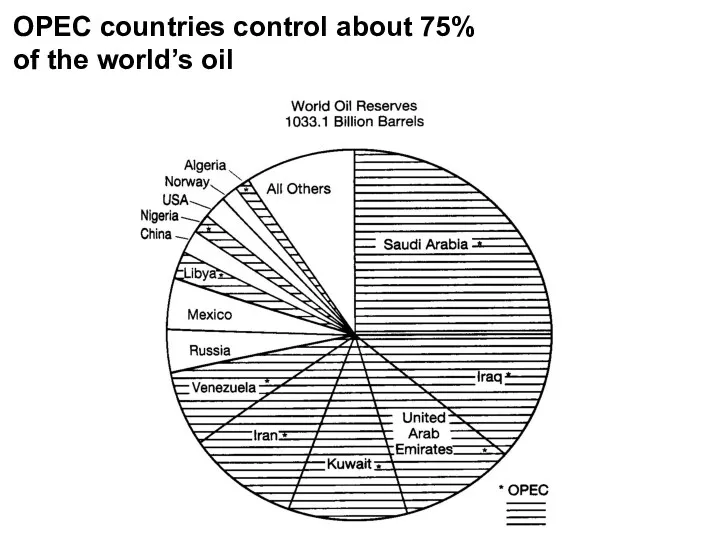
OPEC countries control about 75% of the world’s oil
OPEC countries control about 75% of the world’s oil
 Күйдіру прцесстерінің теоритикалық негізднрі
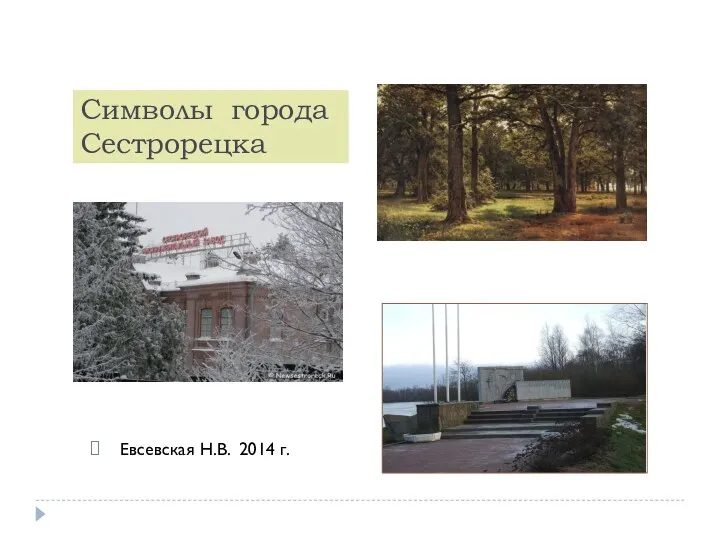 Символы города Сестрорецк
 Животные и растения из Красной книги Чувашской Республики
 чтение текста с картинками
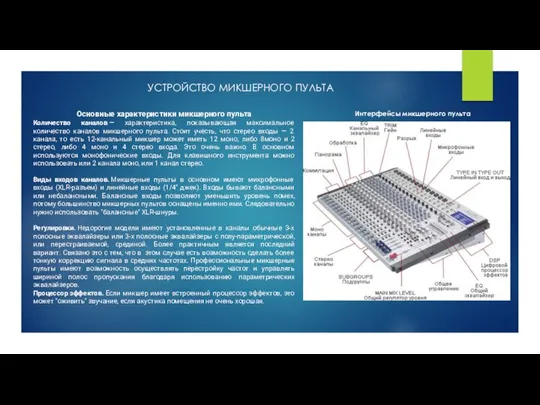 Устройство микшерного пульта
 Деревянное зодчество Древней Руси
 Совершенствование стратегии развития организации с целью повышения ее экономической безопасности ООО МТК
 Пилотный проект фонда социального страхования Российской Федерации Прямые Выплаты
 Хиллари Дайан Родэм Клинтон
 Презентация по математике Свойства вычитания (1 класс)
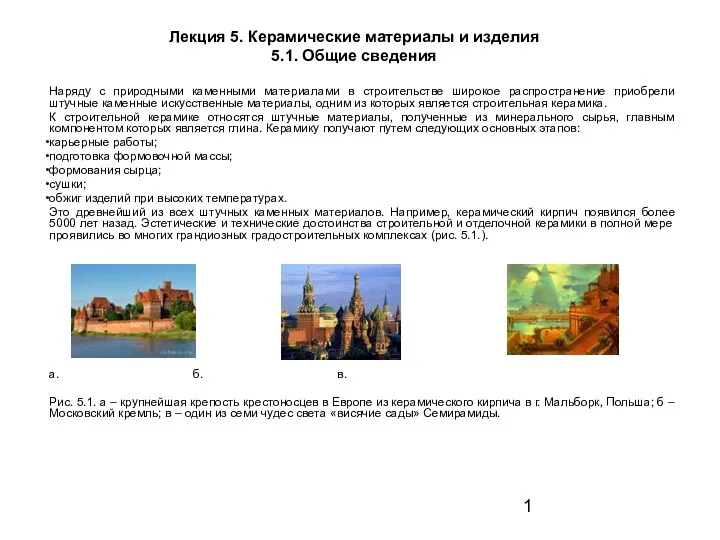 Керамические материалы и изделия
 Поделка Корзина цветов
 Информатика кабинетіндегі қауіпсіздік ережесі
 Формирование графических навыков у детей раннего возраста
 Написание письма личного характера
 Сердечно-лёгочная реанимация. Тема 3.2
 Пусть наши дети будут всегда здоровы и счастливы!
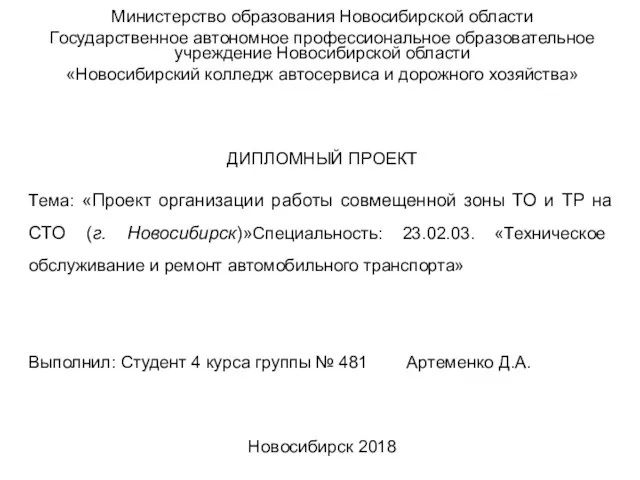 Проект организации работы совмещенной зоны ТО и ТР на СТО
 Лекарственные растения как источники антиоксидантов
 Творча майстерня “Аграфка”
 Ломоносов М.В.
 Тренинговые упражнения по культуре речи
 Озеро Байкал
 Агата Крісті
 Заболевания носа, придаточных пазух
 Родительское собрание Подводим первые итоги
 Увлажнитель воздуха с ночником
 Композиционный прием НЮАНС.