- European energy transition

Содержание
- 2. Table of contents ▶ Status of natural gas in Europe © World Energy Council 2014 ▶
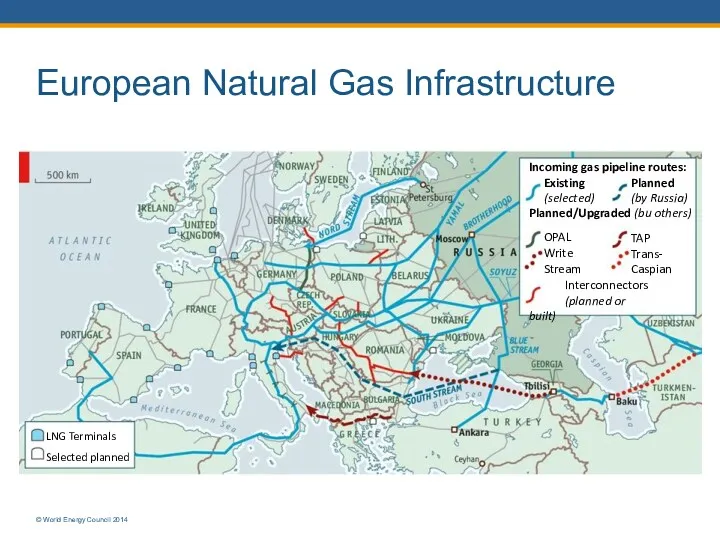
- 3. European Natural Gas Infrastructure © World Energy Council 2014 LNG Terminals Selected planned Incoming gas pipeline
- 4. European Natural Gas Demand/Supply © World Energy Council 2014
- 5. EU sets ambitious targets for 2030 Renewbale Energy 40% 27% 20% 13% Current Targets for 2020
- 6. Natural Gas Contract Duration Changes There is evidence of both an increased overall amount of short/
- 7. Table of contents ▶ Status of natural gas in Europe © World Energy Council 2014 ▶
- 8. Despite the recent turmoil, the outlook for the world economy in 2020 remains unclear © World
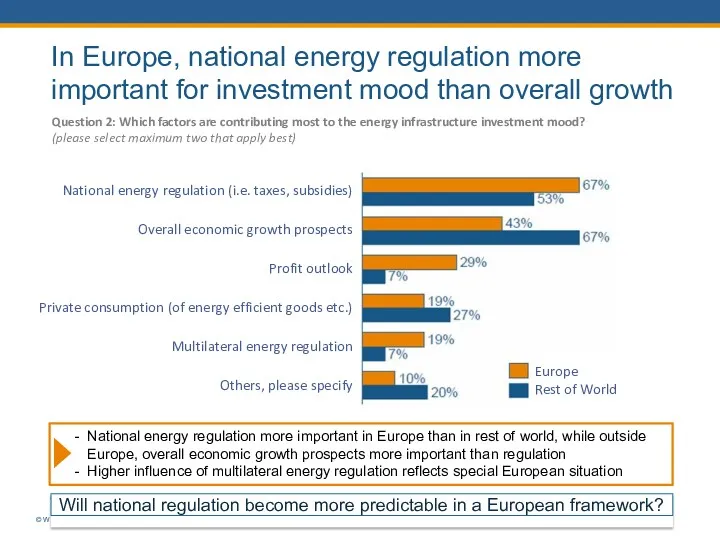
- 9. orld Energy Council 2014 Will national regulation become more predictable in a European framework? © W
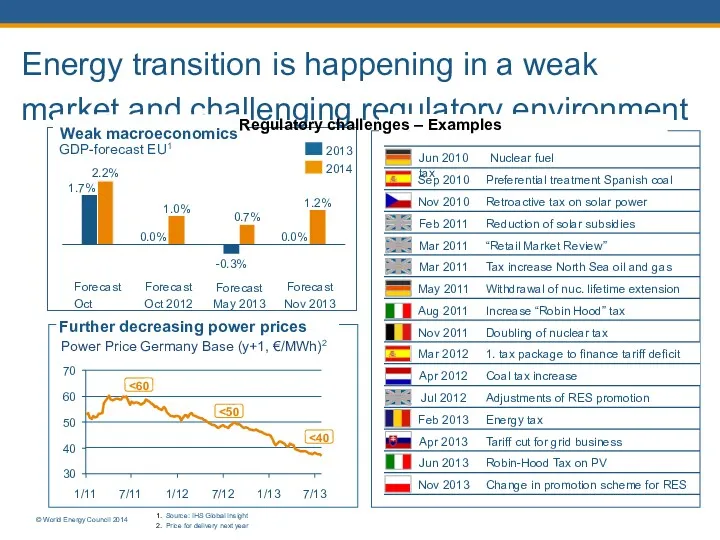
- 10. 10 Energy transition is happening in a weak market and challenging regulatory environment GDP-forecast EU1 2.2%
- 11. EU places high priority on improving energy security © World Energy Council 2014 ▶ Increasing energy
- 12. Dynamic innovation and technology are driving changes on energy markets Examples US Gas 2040 Net exporter
- 13. Table of contents ▶ Status of natural gas in Europe ▶ Forces for change © World
- 14. The Economics of Unconventionals are Preferred in times of Uncertainty Conoco Phillips: Flexibility vs. Returns by
- 16. Скачать презентацию
Table of contents
▶ Status of natural gas in Europe
© World Energy Council
Table of contents
▶ Status of natural gas in Europe
© World Energy Council
European Natural Gas Infrastructure
© World Energy Council 2014
LNG Terminals
Selected planned
Incoming gas
European Natural Gas Infrastructure
© World Energy Council 2014
LNG Terminals
Selected planned
Incoming gas
European Natural Gas Demand/Supply
© World Energy Council 2014
European Natural Gas Demand/Supply
© World Energy Council 2014
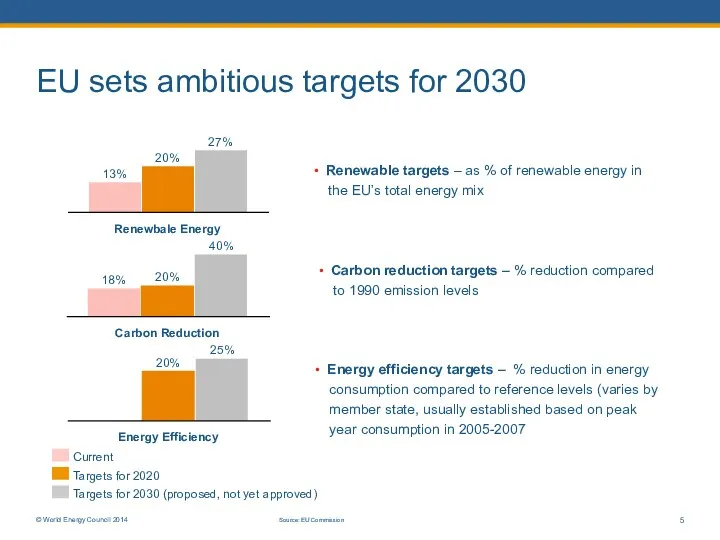
EU sets ambitious targets for 2030
Renewbale Energy
40%
27%
20%
13%
Current
Targets for 2020
Targets for 2030
EU sets ambitious targets for 2030
Renewbale Energy
40%
27%
20%
13%
Current
Targets for 2020
Targets for 2030
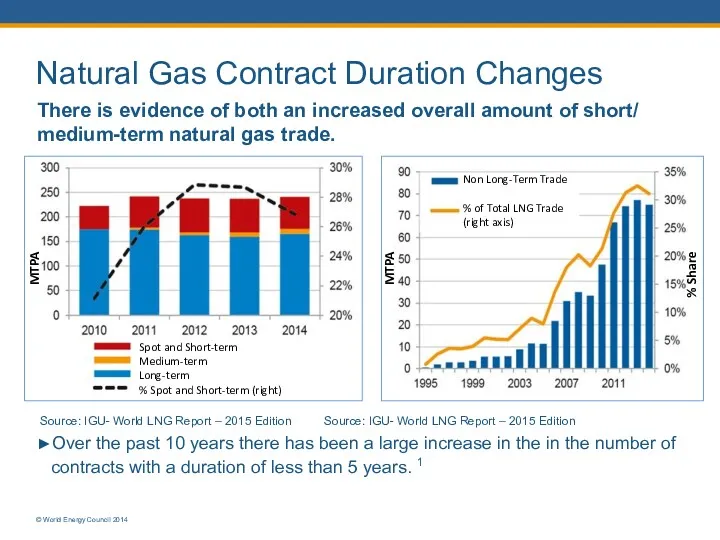
Natural Gas Contract Duration Changes
There is evidence of both an increased
Natural Gas Contract Duration Changes
There is evidence of both an increased
Table of contents
▶ Status of natural gas in Europe
© World Energy Council
Table of contents
▶ Status of natural gas in Europe
© World Energy Council

Despite the recent turmoil, the outlook for the world economy in
Despite the recent turmoil, the outlook for the world economy in
orld Energy Council 2014
Will national regulation become more predictable in a
orld Energy Council 2014
Will national regulation become more predictable in a
10
Energy transition is happening in a weak market and challenging regulatory environment
GDP-forecast
10
Energy transition is happening in a weak market and challenging regulatory environment
GDP-forecast
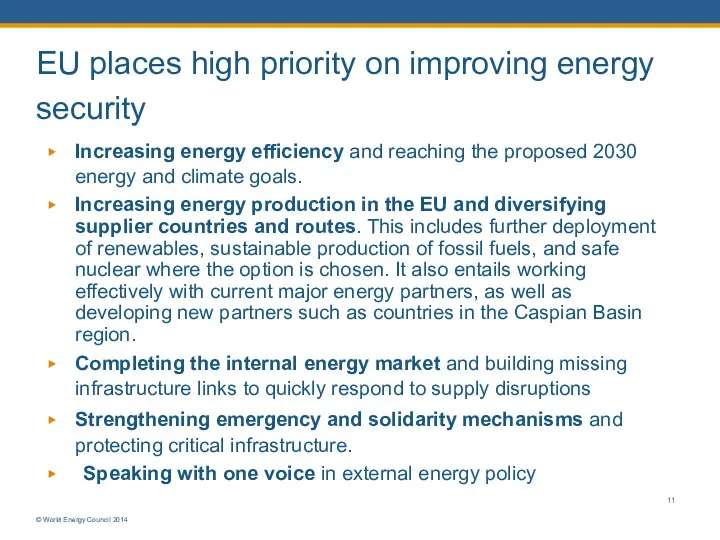
EU places high priority on improving energy security
© World Energy Council
EU places high priority on improving energy security
© World Energy Council
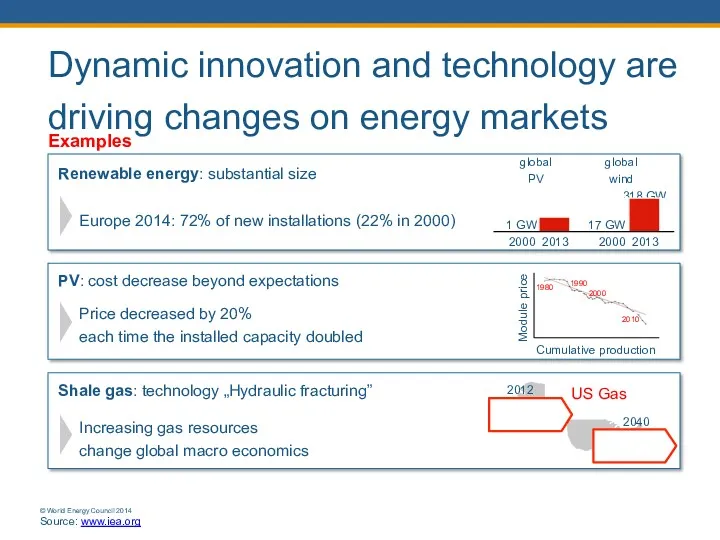
Dynamic innovation and technology are driving changes on energy markets
Examples
US Gas
2040
Net
Dynamic innovation and technology are driving changes on energy markets
Examples
US Gas
2040
Net
Table of contents
▶ Status of natural gas in Europe
▶ Forces for change
© World
Table of contents
▶ Status of natural gas in Europe
▶ Forces for change
© World
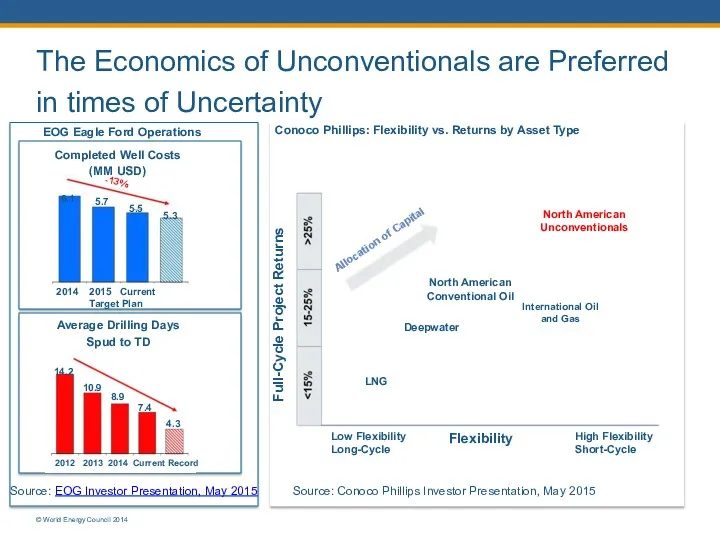
The Economics of Unconventionals are Preferred in times of Uncertainty
Conoco Phillips:
The Economics of Unconventionals are Preferred in times of Uncertainty
Conoco Phillips:
 Презентация Сюжетно-ролевая игра в развитии старших дошкольников
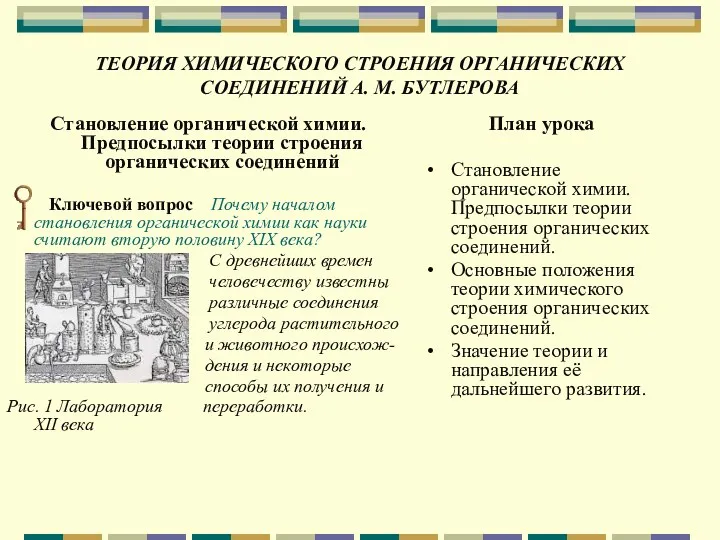 Теория строение органических соединений
 Приложение 1 к уроку по теме Озёра. Презентация. часть1
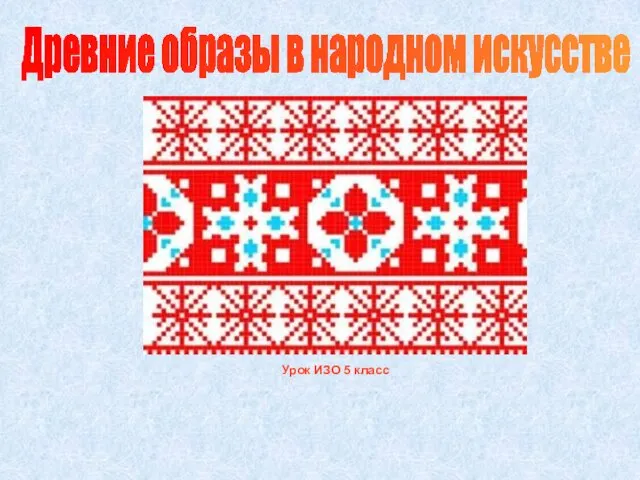 Древние образы в народном искусстве. 5 класс
 Сталинградская битва.
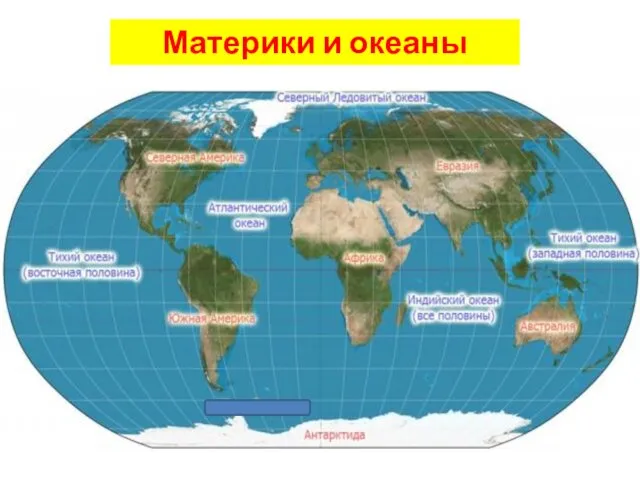 Материки и океаны
 Черная металлургия. Производство чугуна и стали. 9 класс
 Қатты отындарды газдендіру
 Выявлекние и устранение типовых неисправностей блоков питания
 Теория к заданию № 16 (ЕГЭ по русскому языку. Версия 2019 года)
 Самостоятельная двигательная активность детей на прогулке, руководство ею
 Презентация выступления на педсовете по теме Выявление трудных детей
 Родительское собрание Роль книги в развитии интеллектуальных умений ребёнка (Конспект с презентацией)
 Классный час Я и другие люди. Вежливость.
 класс
класс Развертка пирамиды
 Общие пути катаболизма. Энергетический обмен
 Презентация к уроку библиотечно-информационной грамотности по теме Структура книги
 Внеурочная деятельность (кружки)
 Деловая игра, как способ развития социальной компетентности у учащихся на уроках географии
 Артикуляционная гимнастика для малышей
 Раннее Новое время: от средневекового общества к обществу индустриальному
 Получение негативного изображения
 Пеларгония зональная красная
 Здоровьесберегающие технологии в начальной школе.
 Презентация Природные зоны Северной Америки
 Органы цветковых растений. Корень
 Система ЦТ SECAM