Financial Statements and Ratio Analysis Cash Flow and Financial Planning. Time Value of Money презентация
- Financial Statements and Ratio Analysis Cash Flow and Financial Planning. Time Value of Money

Содержание
- 2. Learning Goals Review the contents of the stockholders’ report and the procedures for consolidating international financial
- 3. The Stockholders’ Report generally accepted accounting principles (GAAP) The practice and procedure guidelines used to prepare
- 4. THE FOUR KEY FINANCIAL STATEMENTS income statement Provides a financial summary of the firm’s operating results
- 5. balance sheet Summary statement of the firm’s financial position at a given point in time. current
- 6. statement of retained earnings Reconciles the net income earned during a given year, and any cash
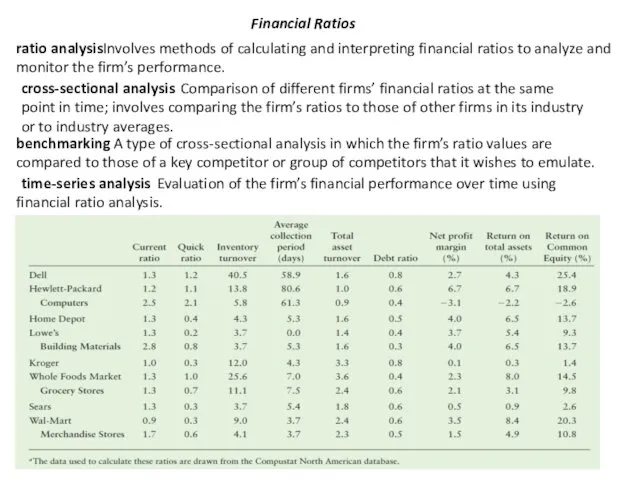
- 7. Financial Ratios ratio analysis Involves methods of calculating and interpreting financial ratios to analyze and monitor
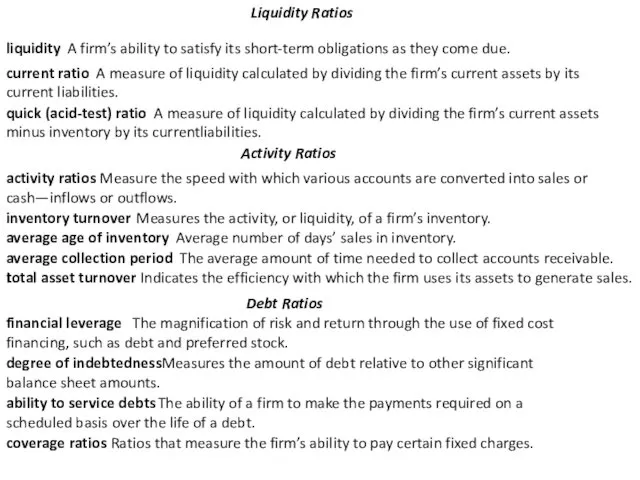
- 8. Liquidity Ratios liquidity A firm’s ability to satisfy its short-term obligations as they come due. current
- 9. debt ratio Measures the proportion of total assets financed by the firm’s creditors. times interest earned
- 10. Operating profit margin = Operating profits /Sales net profit margin Measures the percentage of each sales
- 12. Скачать презентацию
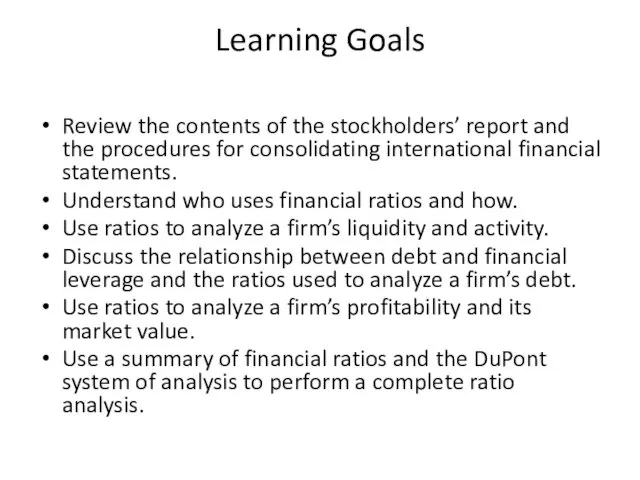
Learning Goals
Review the contents of the stockholders’ report and the procedures
Learning Goals
Review the contents of the stockholders’ report and the procedures
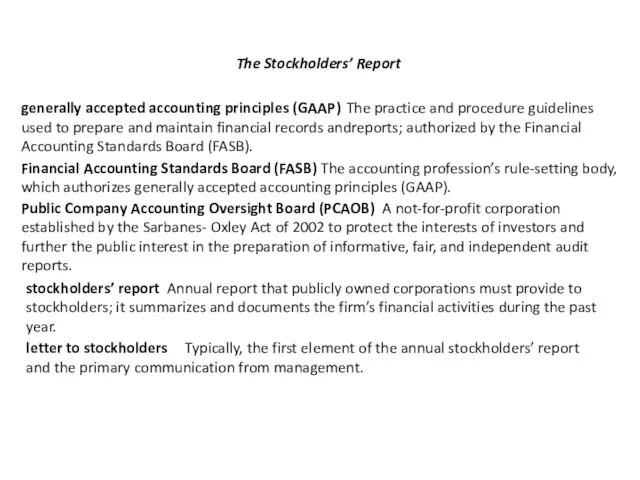
The Stockholders’ Report
generally accepted accounting principles (GAAP)
The practice and procedure
The Stockholders’ Report
generally accepted accounting principles (GAAP)
The practice and procedure
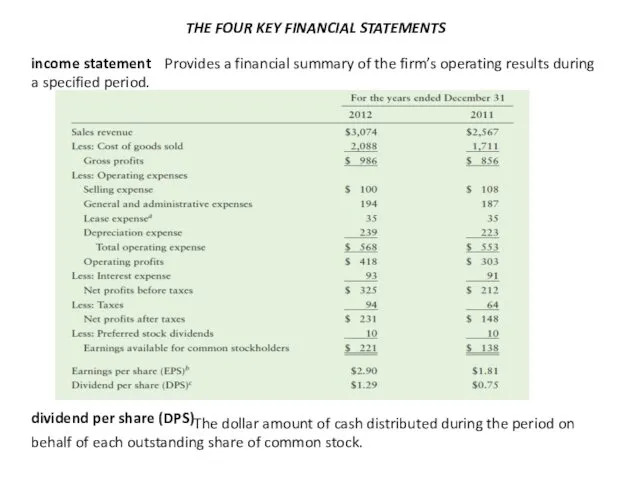
THE FOUR KEY FINANCIAL STATEMENTS
income statement
Provides a financial summary of
THE FOUR KEY FINANCIAL STATEMENTS
income statement
Provides a financial summary of
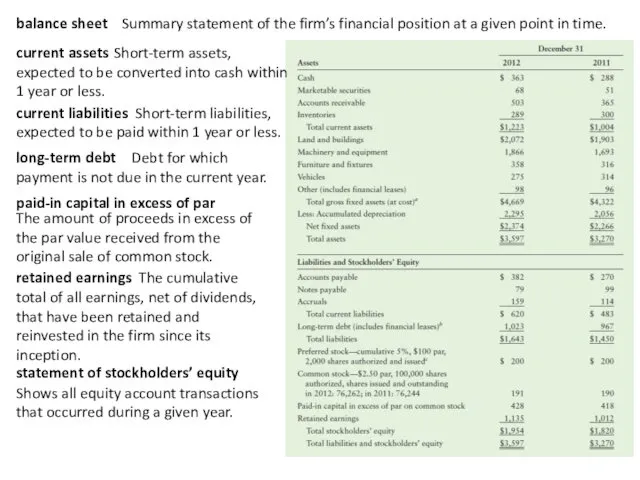
balance sheet
Summary statement of the firm’s financial position at a
balance sheet
Summary statement of the firm’s financial position at a
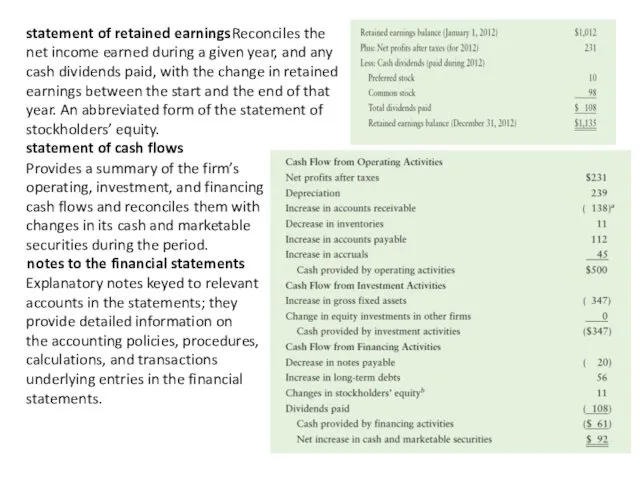
statement of retained earnings
Reconciles the net income earned during a
statement of retained earnings
Reconciles the net income earned during a
Financial Ratios
ratio analysis
Involves methods of calculating and interpreting financial ratios
Financial Ratios
ratio analysis
Involves methods of calculating and interpreting financial ratios
Liquidity Ratios
liquidity
A firm’s ability to satisfy its short-term obligations as
Liquidity Ratios
liquidity
A firm’s ability to satisfy its short-term obligations as
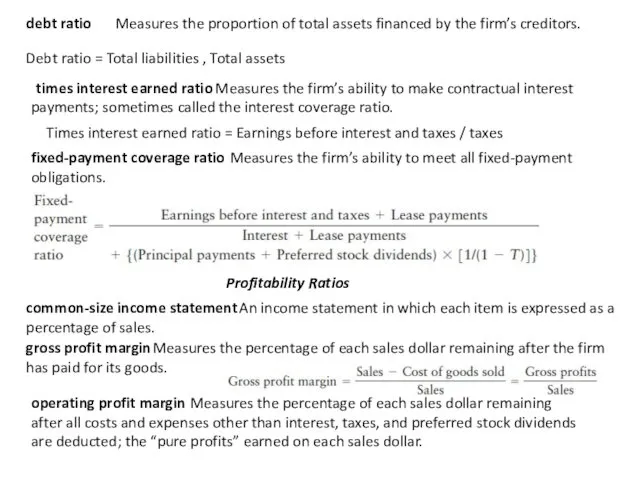
debt ratio
Measures the proportion of total assets financed by the
debt ratio
Measures the proportion of total assets financed by the
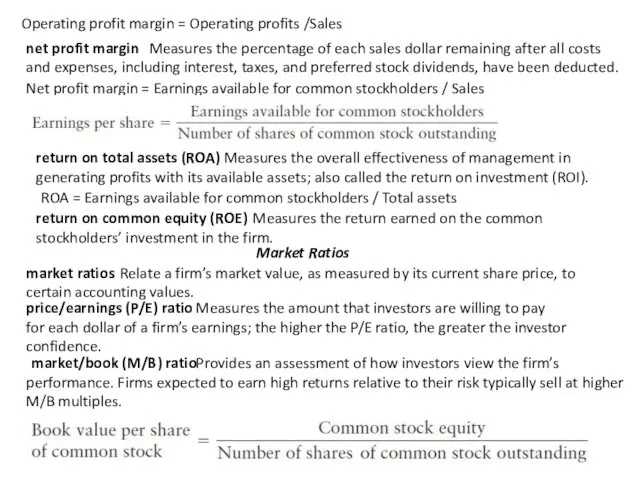
Operating profit margin = Operating profits /Sales
net profit margin
Measures the
Operating profit margin = Operating profits /Sales
net profit margin
Measures the
 Основные свойства функций
 Всестороннее развитие ребёнка дошкольного возраста родителями дома
 Презентация Мой любимый город
 Работа с возражениями клиентов компании Пивград
 Управление изменениями и жизненным циклом организации
 Вредоносные и антивирусные программы
 Древнейшая стадия в развитии человечества
 Презентация: Информационно-образовательный Портал Республики Хакасия. Вход для родителей. Диск
 Рак шийки матки
 Родина - слово большое, большое.
 Психолого-педагогическая диагностика развития детей
 Поговорим о дружбе
 Проблема создания космического комплекса для исследования короны солнца
 Песни с которыми мы победили
 Упаковочные оборудования для хлебобулочных изделий
 Профессии
 Трудовые и непосредственно связанные с ними правоотношения: их элементы, основания возникновения, изменения и прекращения
 психолог - детям
 Московское княжество в первой половине 15 в
 Психологические проблемы педагогического оценивания
 метапредметные результаты
 Инвагинация кишечника у детей
 Классификация и значение витаминов
 [Ю] авазы, Ю, ю хэрефлэре темасына презентация
 игра Космическое путешествие
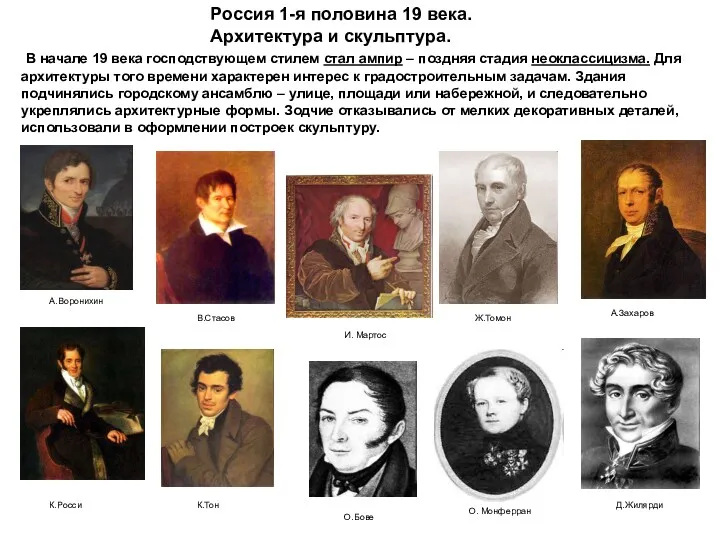 Архитектура и скульптура. Россия: 1-я половина 19 века
 Викторина для девочек к 8 марта Собираем букет
 Интелектуальная ига по математике для 8 класса.