- Hypothesis testing for proportions. Essential statistics

Содержание
- 2. In this section, you will learn how to test a population proportion, p. If np ≥
- 3. Assumptions Write hypotheses & define parameter Calculate the test statistic & p-value Write a statement in
- 4. The P-Value is the probability of obtaining a test statistic that is at least as extreme
- 5. Under Stat – Tests Select 1 Prop Z-test Input p, x, and n P is claim
- 6. Provides you with the z score P-Value Sample proportion Interpret the p-value based off of your
- 7. Draw & shade a curve & calculate the p-value: 1) right-tail test z = 1.6 2)
- 8. α Represents the remaining percentage of our confidence interval. 95% confidence interval has a 5% alpha.
- 9. A medical researcher claims that less than 20% of American adults are allergic to a medication.
- 10. The products np = 100(0.20)= 20 and nq = 100(0.80) = 80 are both greater than
- 11. Because the test is a left-tailed test and the level of significance is α = 0.01,
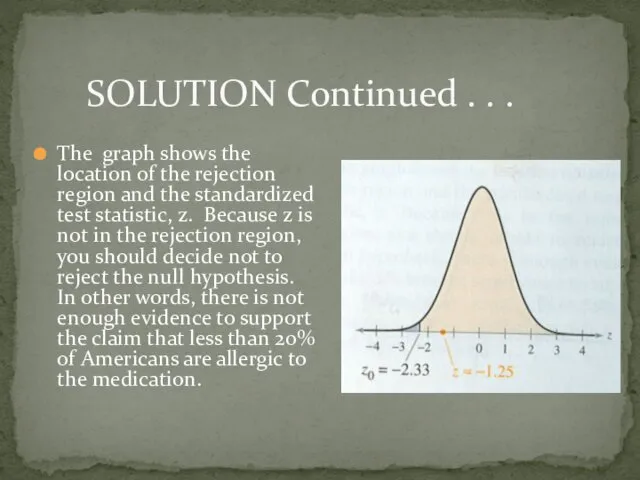
- 12. SOLUTION Continued . . . The graph shows the location of the rejection region and the
- 13. Solutions Continued……
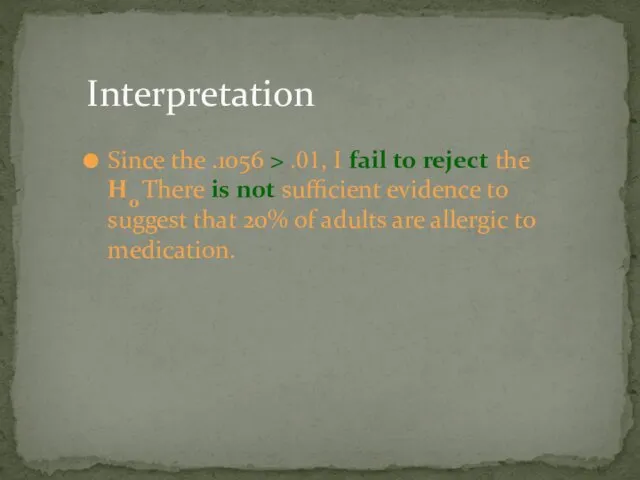
- 14. Interpretation Since the .1056 > .01, I fail to reject the H0 There is not sufficient
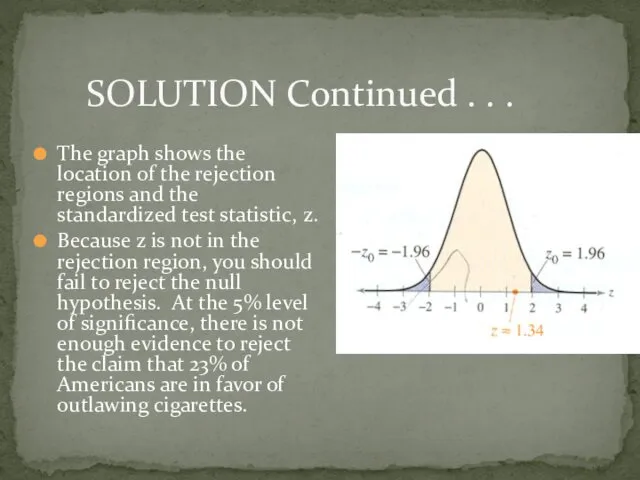
- 15. Harper’s Index claims that 23% of Americans are in favor of outlawing cigarettes. You decide to
- 16. The products np = 200(0.23) = 45 and nq = 200(0.77) = 154 are both greater
- 17. Because the test is a two-tailed test, and the level of significance is α = 0.05.
- 18. SOLUTION Continued . . . The graph shows the location of the rejection regions and the
- 19. The Pew Research Center claims that more than 55% of American adults regularly watch a network
- 20. The products np = 425(0.55) = 235 and nq = 425(0.45) = 191 are both greater
- 21. Because the test is a right-tailed test, and the level of significance is α = 0.05.
- 23. Скачать презентацию
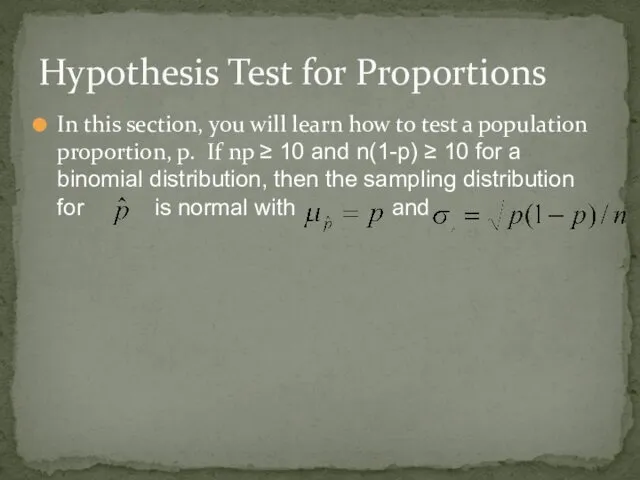
In this section, you will learn how to test a population
In this section, you will learn how to test a population
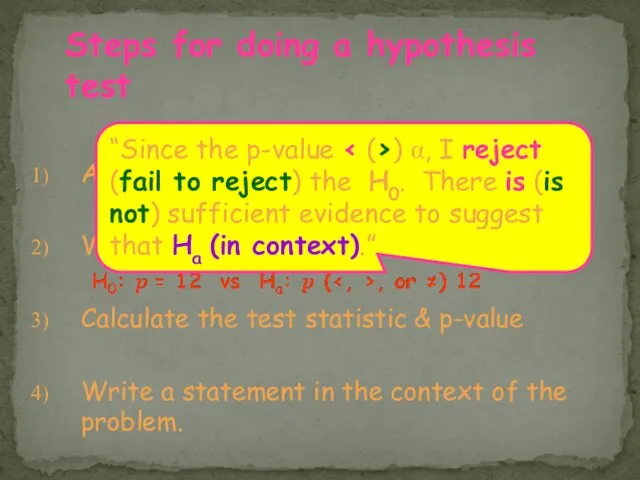
Assumptions
Write hypotheses & define parameter
Calculate the test statistic & p-value
Write a
Assumptions
Write hypotheses & define parameter
Calculate the test statistic & p-value
Write a
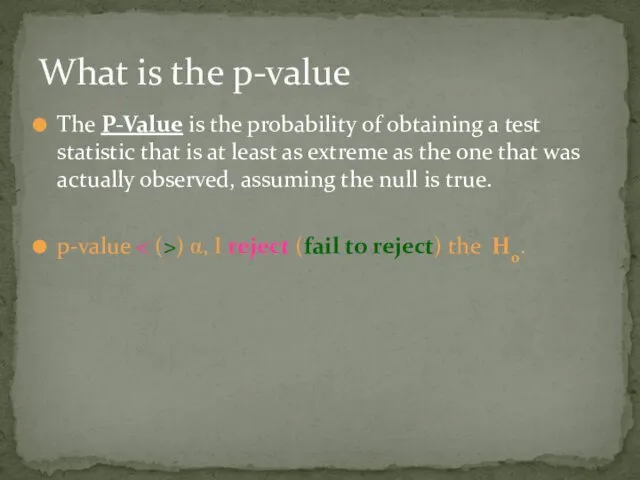
The P-Value is the probability of obtaining a test statistic that
The P-Value is the probability of obtaining a test statistic that
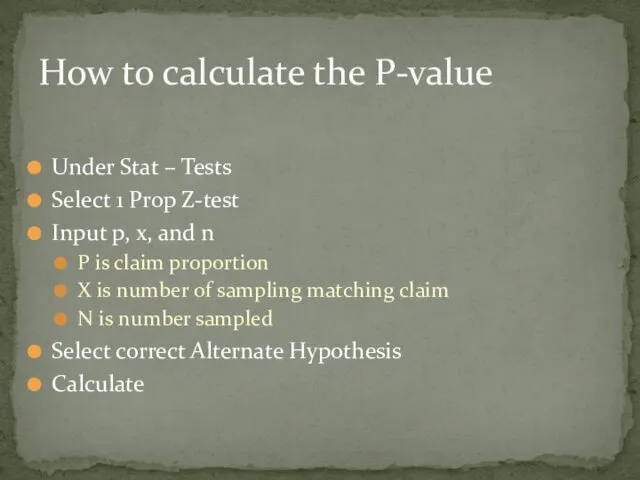
Under Stat – Tests
Select 1 Prop Z-test
Input p, x, and n
P
Under Stat – Tests
Select 1 Prop Z-test
Input p, x, and n
P
Provides you with the z score
P-Value
Sample proportion
Interpret the p-value based off
Provides you with the z score
P-Value
Sample proportion
Interpret the p-value based off
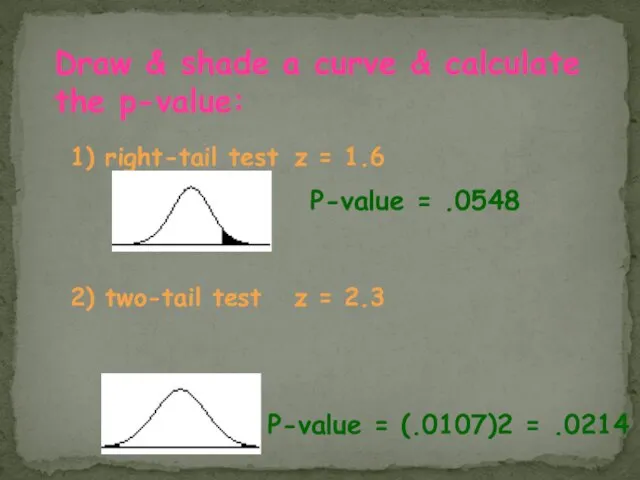
Draw & shade a curve & calculate the p-value:
1) right-tail test
Draw & shade a curve & calculate the p-value:
1) right-tail test
α Represents the remaining percentage of our confidence interval. 95% confidence
α Represents the remaining percentage of our confidence interval. 95% confidence
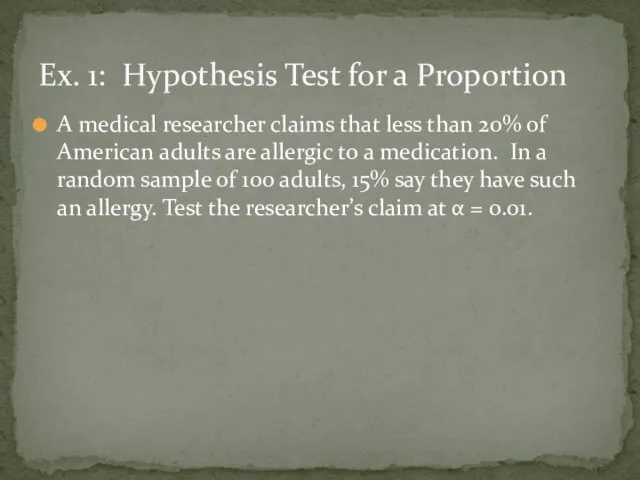
A medical researcher claims that less than 20% of American adults
A medical researcher claims that less than 20% of American adults
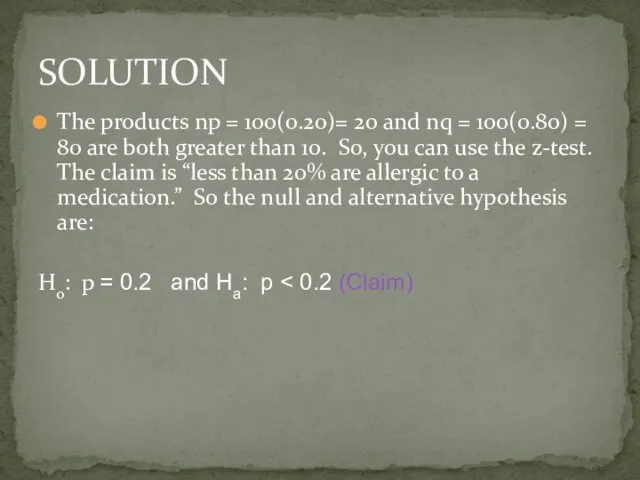
The products np = 100(0.20)= 20 and nq = 100(0.80) =
The products np = 100(0.20)= 20 and nq = 100(0.80) =
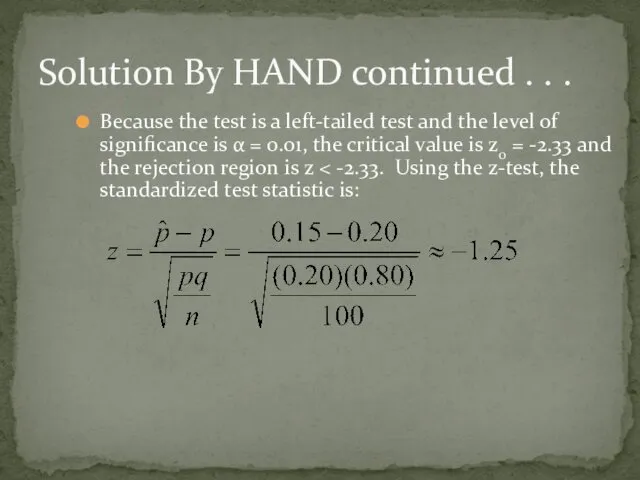
Because the test is a left-tailed test and the level of
Because the test is a left-tailed test and the level of
SOLUTION Continued . . .
The graph shows the location of
SOLUTION Continued . . .
The graph shows the location of
Solutions Continued……
Solutions Continued……
Interpretation
Since the .1056 > .01, I fail to reject the H0
Interpretation
Since the .1056 > .01, I fail to reject the H0
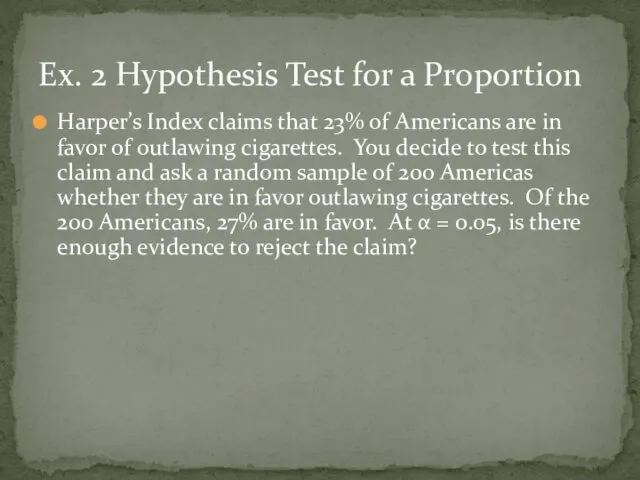
Harper’s Index claims that 23% of Americans are in favor of
Harper’s Index claims that 23% of Americans are in favor of
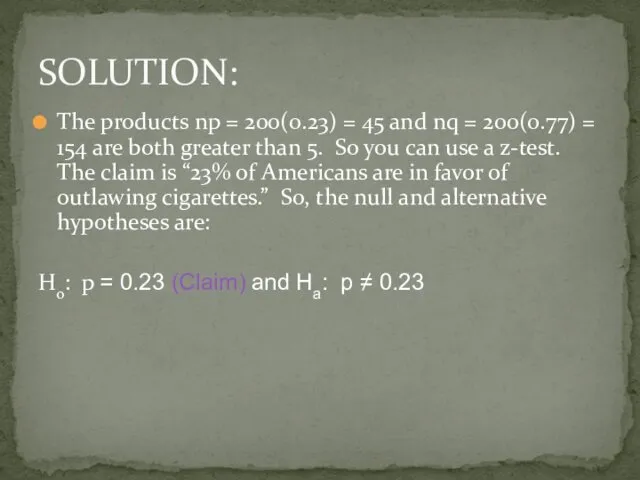
The products np = 200(0.23) = 45 and nq = 200(0.77)
The products np = 200(0.23) = 45 and nq = 200(0.77)
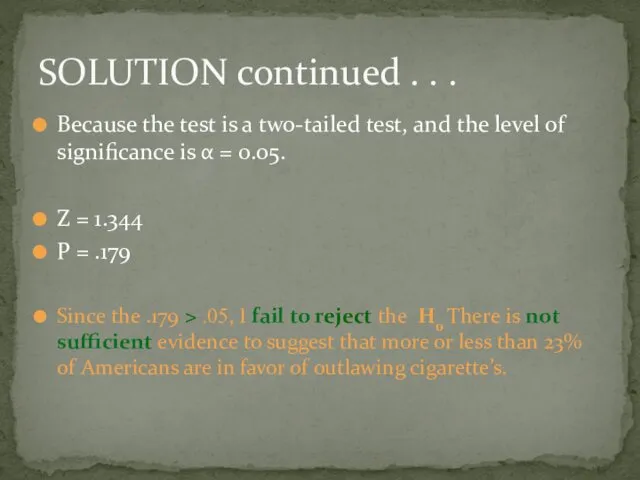
Because the test is a two-tailed test, and the level of
Because the test is a two-tailed test, and the level of
SOLUTION Continued . . .
The graph shows the location of
SOLUTION Continued . . .
The graph shows the location of
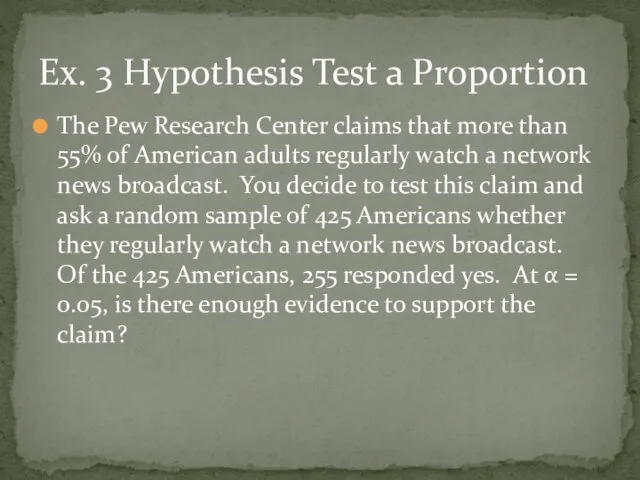
The Pew Research Center claims that more than 55% of American
The Pew Research Center claims that more than 55% of American
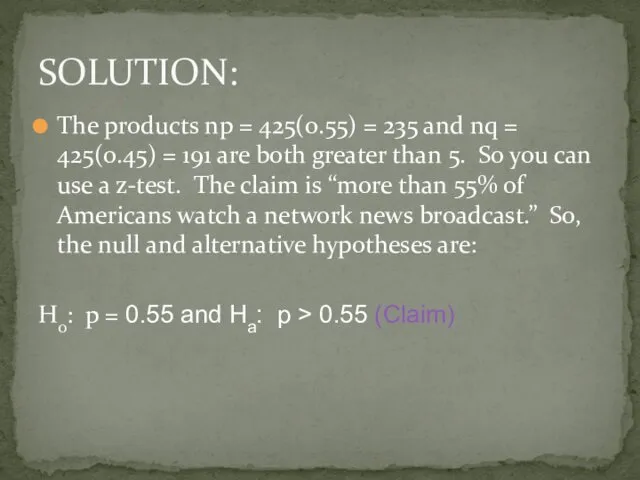
The products np = 425(0.55) = 235 and nq = 425(0.45)
The products np = 425(0.55) = 235 and nq = 425(0.45)
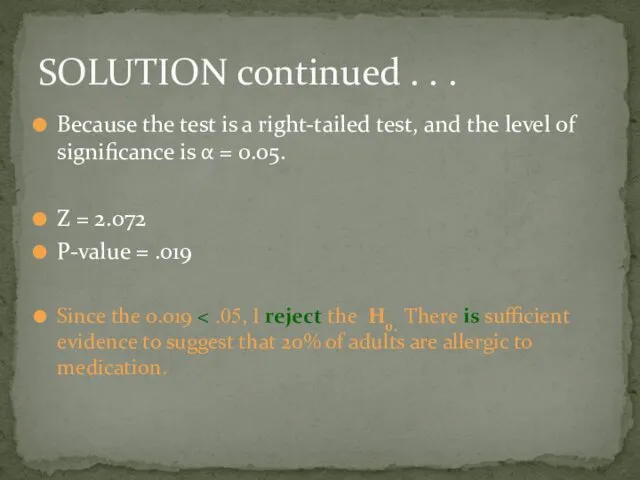
Because the test is a right-tailed test, and the level of
Because the test is a right-tailed test, and the level of
 Принципиальная схема неблочной ТЭЦ с поперечными связями. Лекция 6
 Классный час День матери
 Освящение храма в честь иконы Божией Матери Призри на смирение
 Театр будущего и будущее театра
 Кисты челюстно-лицевой областей у детей. Одонтогенные воспалительные кисты челюстей от временных зубов у детей
 Кижинга, долина субурганов
 Verb to be
 Автоматика Carel
 Сортировочные станции
 Проект Город детства. Преобразование развивающей предметно- пространственной среды групп в соответствии с ФГОС ДО.
 Самарская офтальмологическая клиника
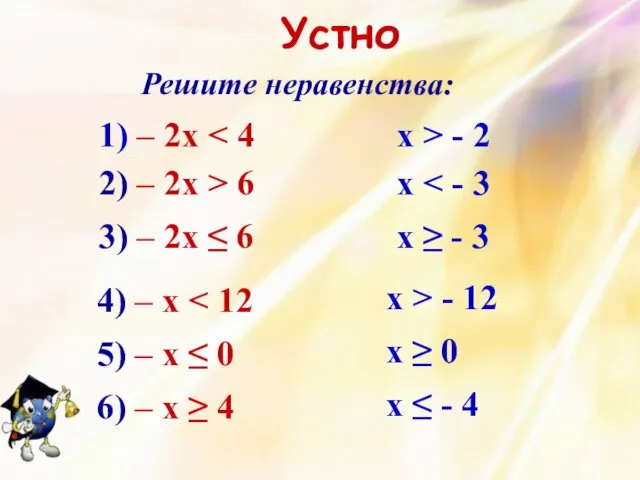 Решение систем линейных неравенств. 8 класс
 Таможенный менеджмент. Основные понятия и определения
 Родительское собрание в 1 классе 1 четверть
 История нашего города. Санкт-Петербург 1703 год
 Оснащение переезда
 Анализ конкурентов. Пошаговый метод с разъяснением
 Participle I, II. Причастия в английском языке
 A Time to Celebrate (Традиционные празднества)
 Европейский Север
 Управление проектами. Стандарты управления проектами
 Система взаимодействия власти и общества
 Профессия метеоролога
 Программа развития воспитательной системы Мастерская детского успеха
 Минеральные источники РФ и Республики Мордовия
 Программа деятельности классного руководителя коррекционной школы-интерната VIII вида Мастерская добрых дел
 Трехфазные и специальные трансформаторы
 крылатые выражения из романа Евгений Онегин