- Management Tools. Problem Solving

Содержание
- 2. The “Why Why” Tool… Why Why Why Why WHY
- 3. Why did the customer return the product? It had a faulty component Why did it have
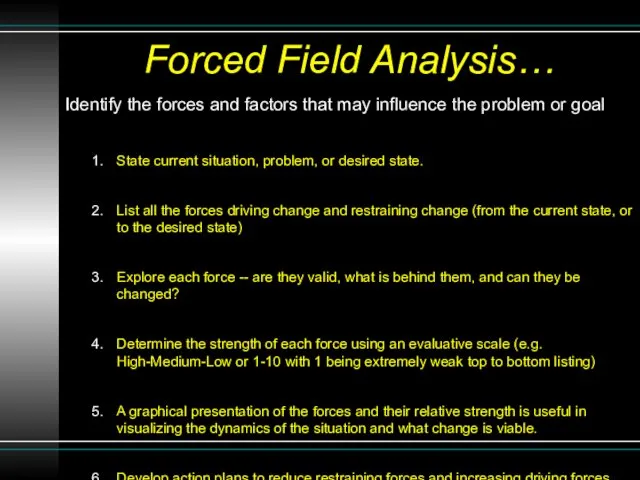
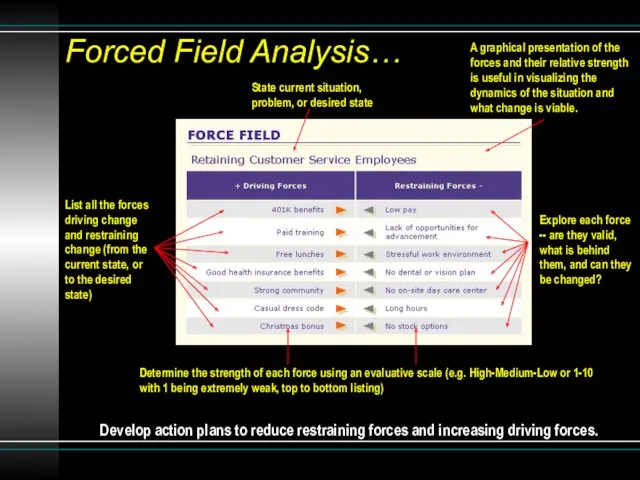
- 4. Forced Field Analysis… Identify the forces and factors that may influence the problem or goal State
- 5. Forced Field Analysis… State current situation, problem, or desired state List all the forces driving change
- 6. Nominal Group Technique… Everyone submits problem they think is most important Problems are listed Each member
- 7. --- REVIEW --- The canning factory that you are in management for is being faced with
- 8. Affinity Diagram… Conduct a brainstorming session on the topic under investigation. Clarify the list of ideas.
- 9. Affinity Diagram… Sample Layout Also see page 446 in your textbook Post-It notes or cards that
- 10. Interrelationship Digraph… Used to show cause-and-effect relationships between identified factors surrounding an issue Place the problem
- 11. Interrelationship Digraph… Sample Layout Also see pages 447-448 in your textbook
- 12. ?'s Questions So Far?
- 13. --- REVIEW --- and present Your company has to shut down a main production line. Create
- 14. BREAK Let’s Take a 10-15 Minute Break!
- 15. “7 Management and Planning Tools” Affinity Diagram Interrelationship Diagraph Tree Diagram Matrix Diagram Prioritization Methods Process
- 16. Breaks down or stratifies ideas in progressively greater detail. The objective is to partition a big
- 17. Helps you to identify and analyze the presence and strength of relationships between two sets of
- 18. Helps you rank problems or issues (usually generated through brainstorming) by a particular criterion that is
- 19. A method that graphically displays as many alternatives and contingencies that can be determined in advance
- 20. Helps you to work out the most efficient sequence of events needed to complete any project.
- 21. ?'s Questions?
- 22. --- APPLY IT --- The continuing conflict in the Middle East has raised commodity prices to
- 23. --- DISCUSS IT --- What tool did you use? Did you try a tool that didn’t
- 24. --- CONCLUSION --- 10 Tools Presented First 3 can be used in variety of situations Last
- 26. Скачать презентацию

The “Why Why” Tool…
Why
Why
Why
Why
WHY
The “Why Why” Tool…
Why
Why
Why
Why
WHY
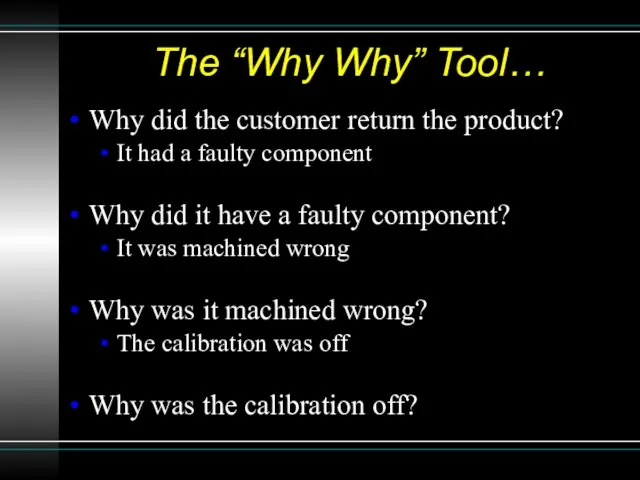
Why did the customer return the product?
It had a faulty component
Why
Why did the customer return the product?
It had a faulty component
Why
Forced Field Analysis…
Identify the forces and factors that may influence the
Forced Field Analysis…
Identify the forces and factors that may influence the
Forced Field Analysis…
State current situation, problem, or desired state
List all the
Forced Field Analysis…
State current situation, problem, or desired state
List all the
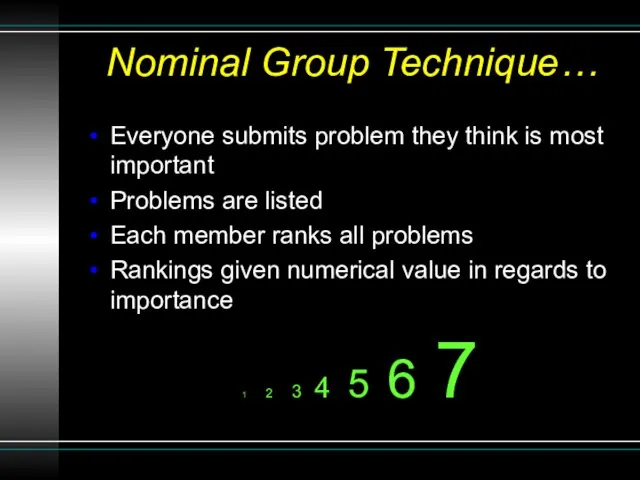
Nominal Group Technique…
Everyone submits problem they think is most important
Problems are
Nominal Group Technique…
Everyone submits problem they think is most important
Problems are
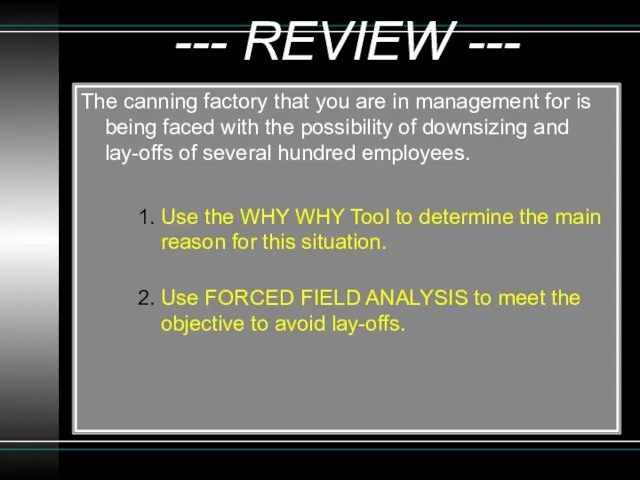
--- REVIEW ---
The canning factory that you are in management for
--- REVIEW ---
The canning factory that you are in management for
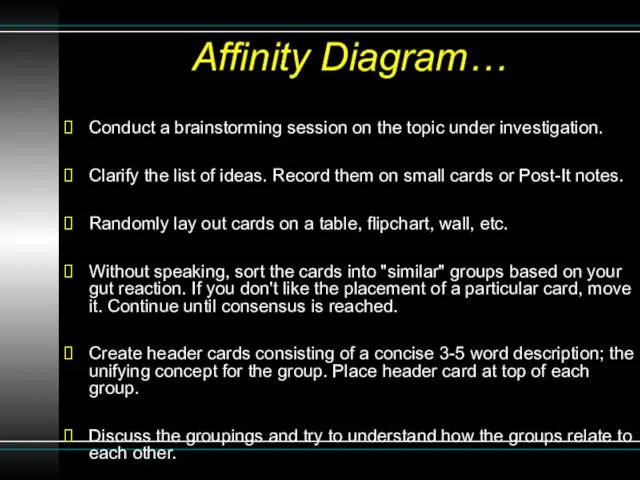
Affinity Diagram…
Conduct a brainstorming session on the topic under investigation.
Clarify
Affinity Diagram…
Conduct a brainstorming session on the topic under investigation.
Clarify
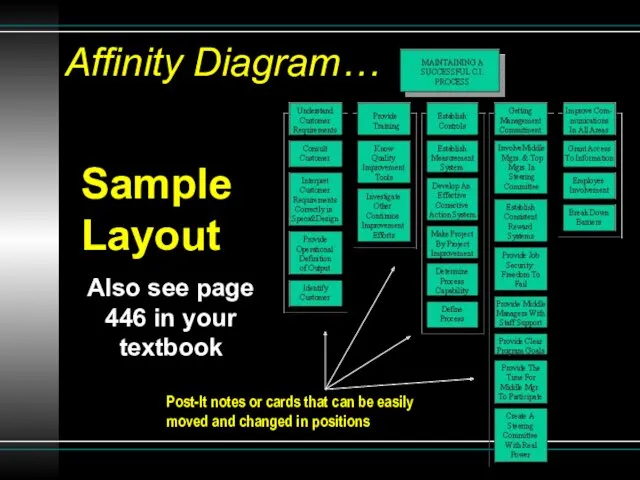
Affinity Diagram…
Sample Layout
Also see page 446 in your textbook
Post-It notes or
Affinity Diagram…
Sample Layout
Also see page 446 in your textbook
Post-It notes or
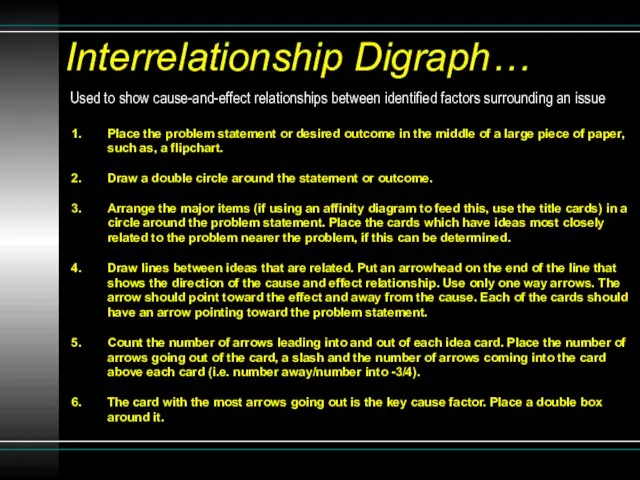
Interrelationship Digraph…
Used to show cause-and-effect relationships between identified factors surrounding an
Interrelationship Digraph…
Used to show cause-and-effect relationships between identified factors surrounding an
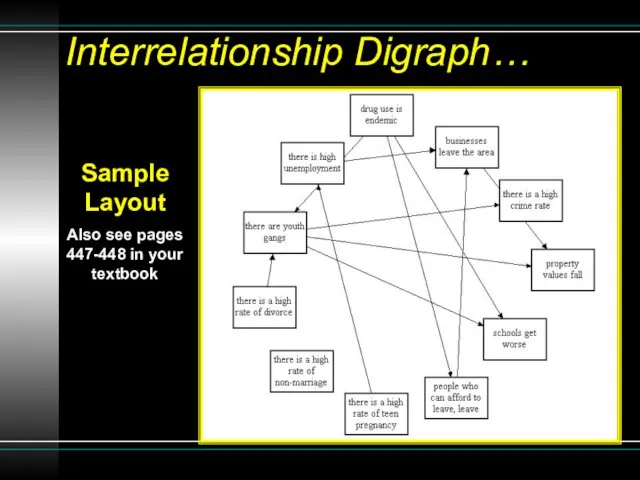
Interrelationship Digraph…
Sample Layout
Also see pages 447-448 in your textbook
Interrelationship Digraph…
Sample Layout
Also see pages 447-448 in your textbook
?'s
Questions So Far?
?'s
Questions So Far?
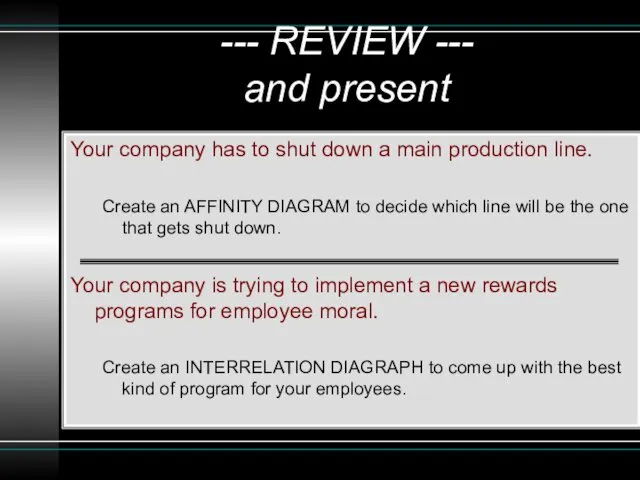
--- REVIEW ---
and present
Your company has to shut down a main
--- REVIEW ---
and present
Your company has to shut down a main
BREAK
Let’s Take a 10-15 Minute Break!
BREAK
Let’s Take a 10-15 Minute Break!
“7 Management and
Planning Tools”
Affinity Diagram
Interrelationship Diagraph
Tree Diagram
Matrix Diagram
Prioritization Methods
Process Decision
“7 Management and
Planning Tools”
Affinity Diagram
Interrelationship Diagraph
Tree Diagram
Matrix Diagram
Prioritization Methods
Process Decision
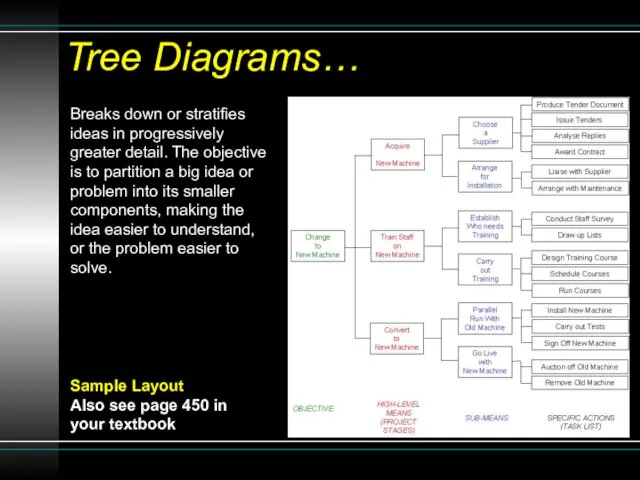
Breaks down or stratifies ideas in progressively greater detail. The objective
Breaks down or stratifies ideas in progressively greater detail. The objective
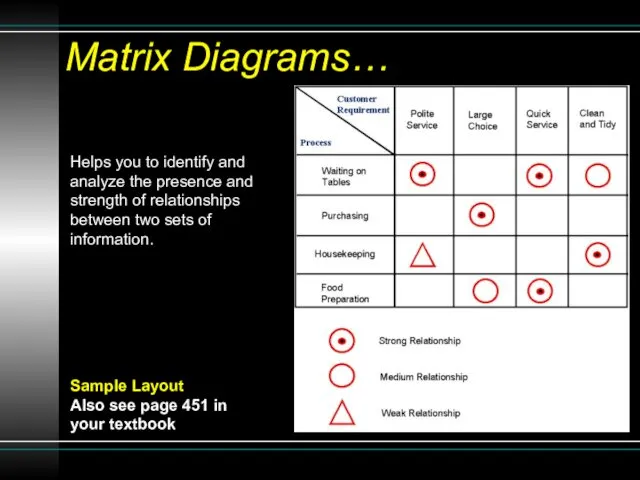
Helps you to identify and analyze the presence and strength of
Helps you to identify and analyze the presence and strength of
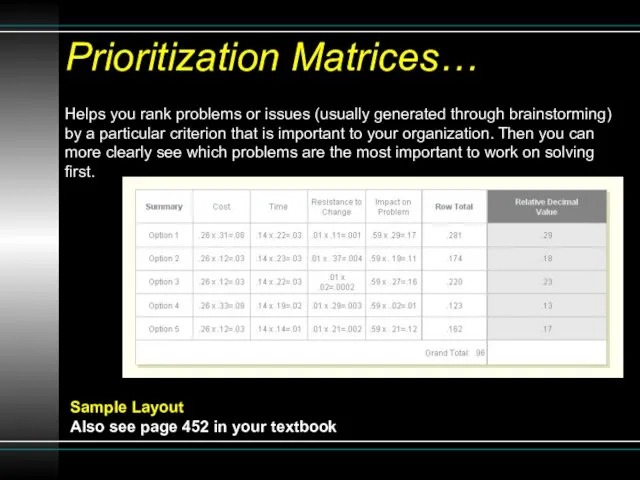
Helps you rank problems or issues (usually generated through brainstorming) by
Helps you rank problems or issues (usually generated through brainstorming) by
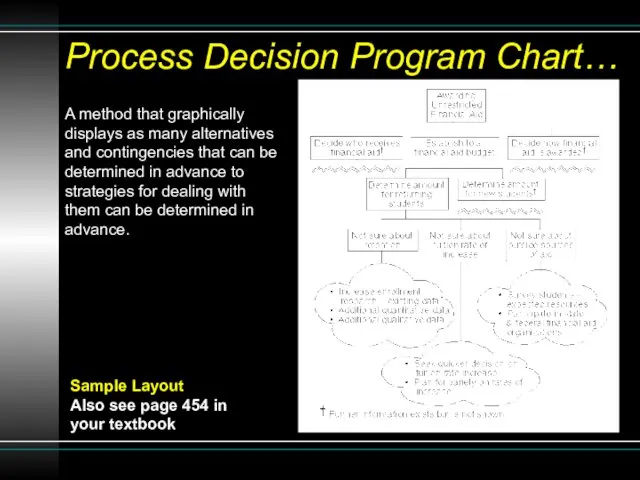
A method that graphically displays as many alternatives and contingencies that
A method that graphically displays as many alternatives and contingencies that
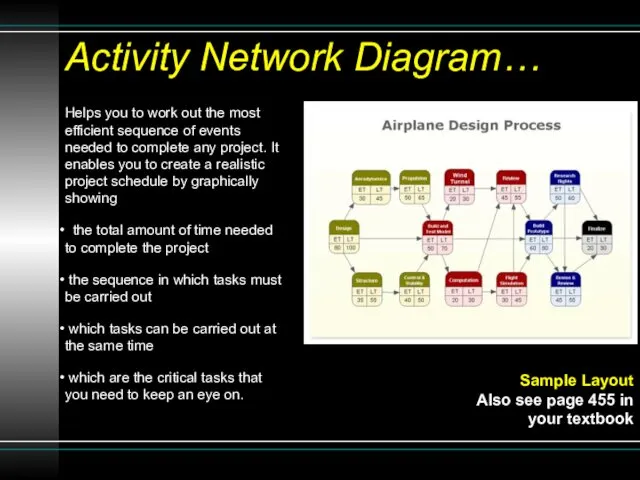
Helps you to work out the most efficient sequence of events
Helps you to work out the most efficient sequence of events
?'s
Questions?
?'s
Questions?
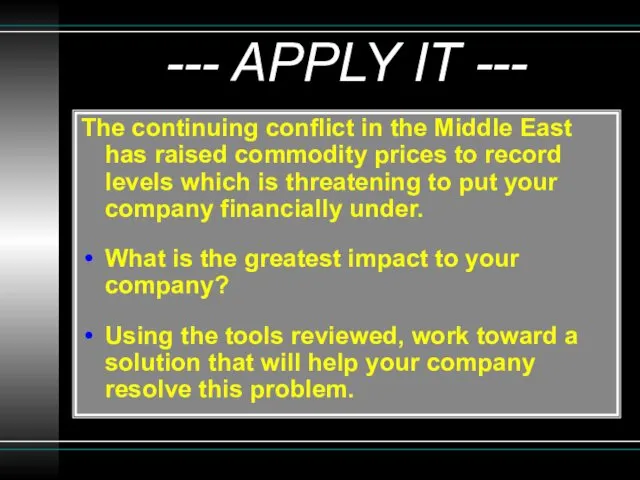
--- APPLY IT ---
The continuing conflict in the Middle East has
--- APPLY IT ---
The continuing conflict in the Middle East has
--- DISCUSS IT ---
What tool did you use?
Did you try a
--- DISCUSS IT ---
What tool did you use?
Did you try a
--- CONCLUSION ---
10 Tools Presented
First 3 can be used in variety
--- CONCLUSION ---
10 Tools Presented
First 3 can be used in variety
 Древесина. Материалы на основе древесины
 ГПА-16М-09 Урал
 ОГЭ. Геометрия на клетчатой бумаге. Площадь
 Monitorizarea calitatii. Energiei electrice
 Христианство. Основные идеи
 Презентация IT чемпион
 Правила поведения в школе для первоклассников
 Социальная структура Древней Индии
 Конструкция и сравнительный анализ основных опор шасси самолетов А-320, RRJ-95
 Дом мечты из бумаги
 битва под Москвой презентация
 Проблема общественного прогресса
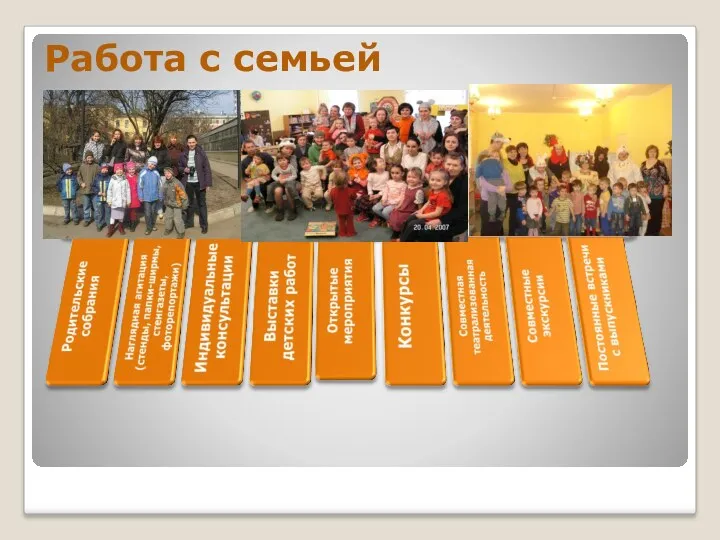 ДОКЛАД О ДЕЯТЕЛЬНОСТИ ГДОУ №35. Часть3
 Презентация Воспитание культуры общения старшеклассников во внеурочное время
 Релігія та культура Давньої Індії
 Экономическая политика и экономика России в конце XIX в
 Артикуляционная гимнастика в стихах. Свистящие звуки
 Внеклассное чтение 10 - 12 лет
 Диагностическое обследование детей по теме Народное декоративно-прикладное искусство (компьютерные тесты для детей)
 Техническое обслуживание и ремонт на участке по ремонту тормозной системы автомобилей ГАЗ-3307 на автотранспортном предприятии
 Презентация Герои мифов в скульптуре
 Акция Добрые дела осенью
 Оформление территории Сказка на участке
 Джонатан Свифт Путешествие Гулливера
 Духовно-нравственное воспитание младших школьников в рамках школьной программы внеурочной деятельности
 Особенности психологической подготовки учащихся к ЕГЭ
 Очиститель воздуха
 Бизнес-план. Организация переработки молока