- Process diagram and instrument sketching

Содержание
- 2. Introduction to the Process Diagrams The three most likely drawing that a process technician uses are
- 3. Block flow diagram (BFD)
- 4. Process flow diagram (PFD)
- 5. Piping and instrumentation diagram (PID)
- 6. All PFDs and P&IDs should have an associated legend. A legend is an explanation of what
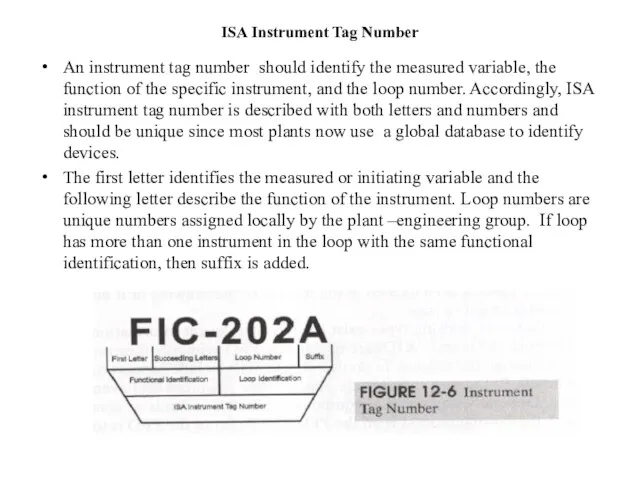
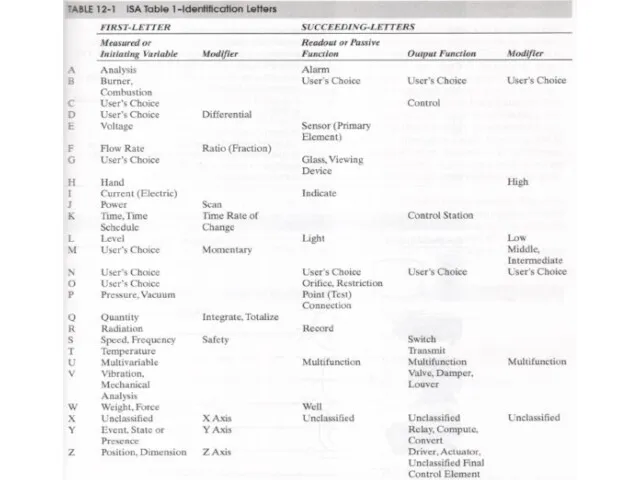
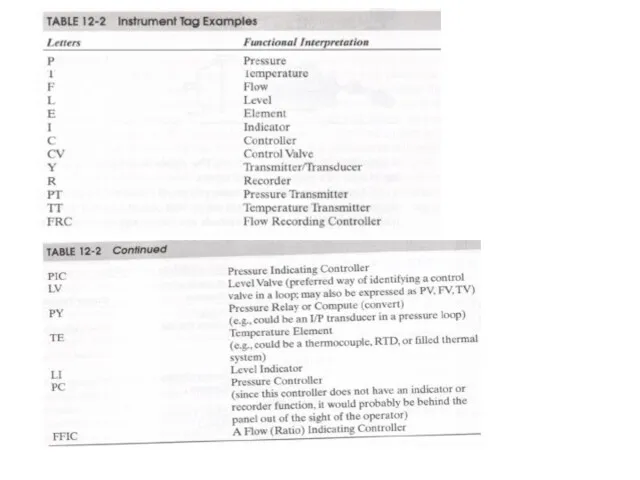
- 7. ISA Instrument Tag Number An instrument tag number should identify the measured variable, the function of
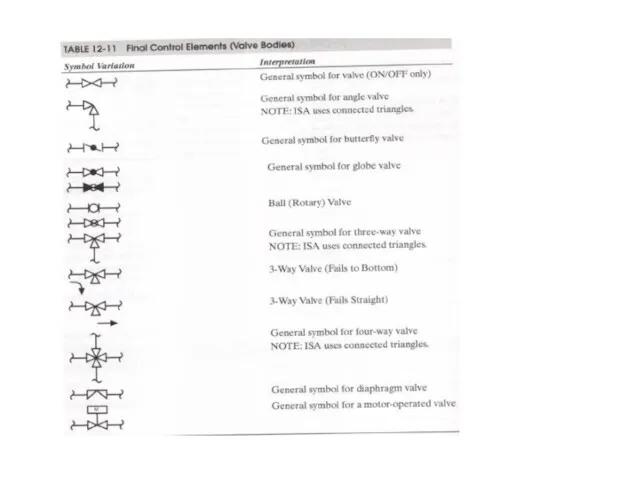
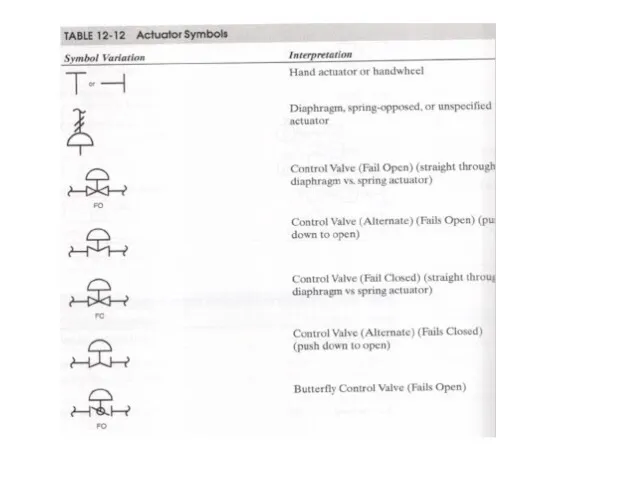
- 10. Basic equipment symbols
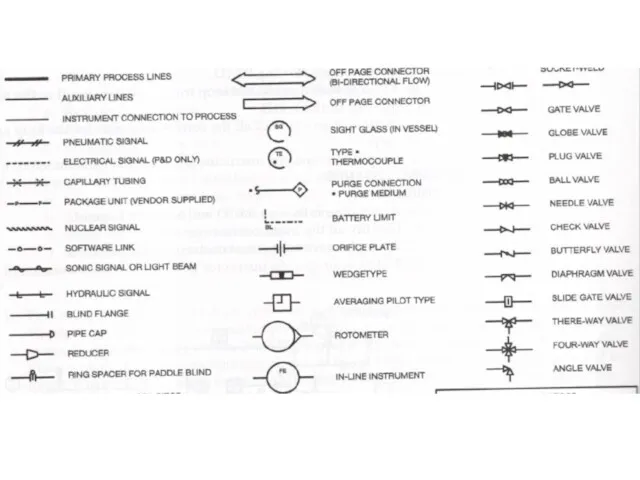
- 11. Standard Line symbols
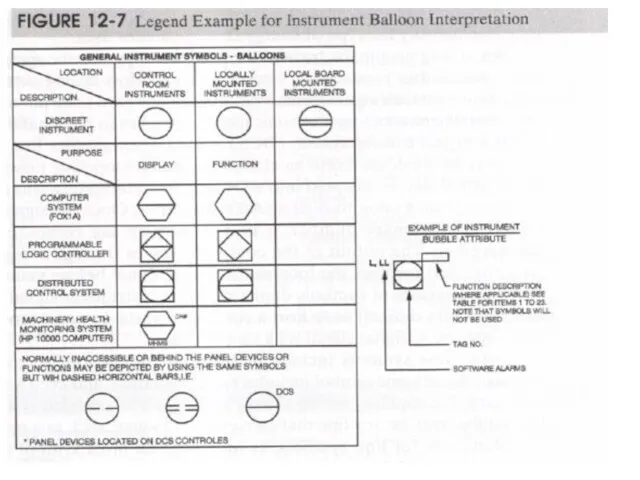
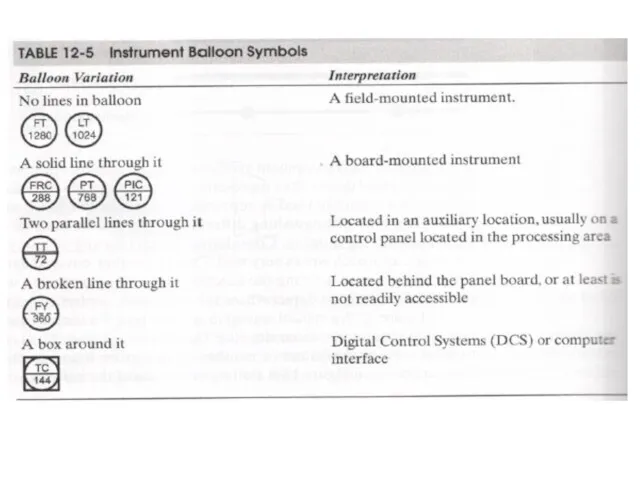
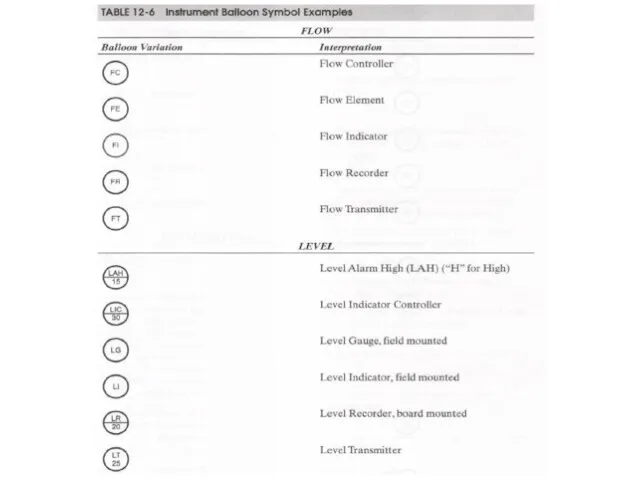
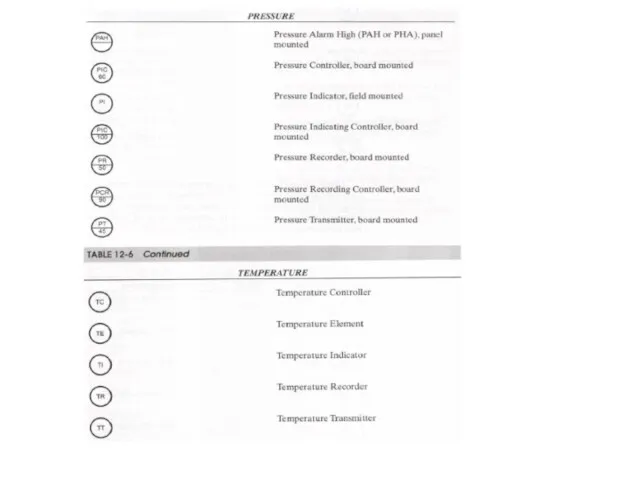
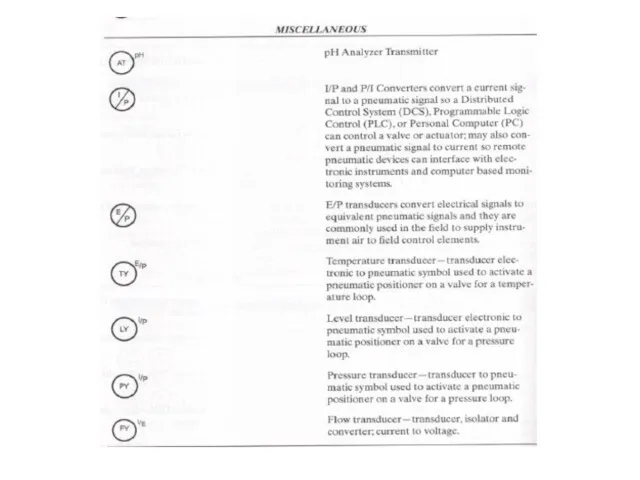
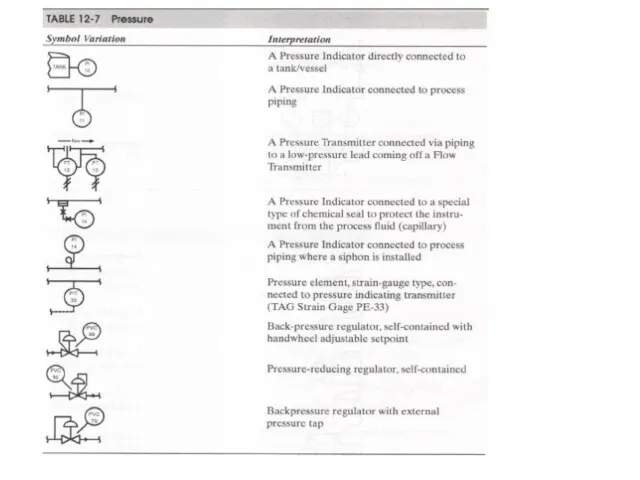
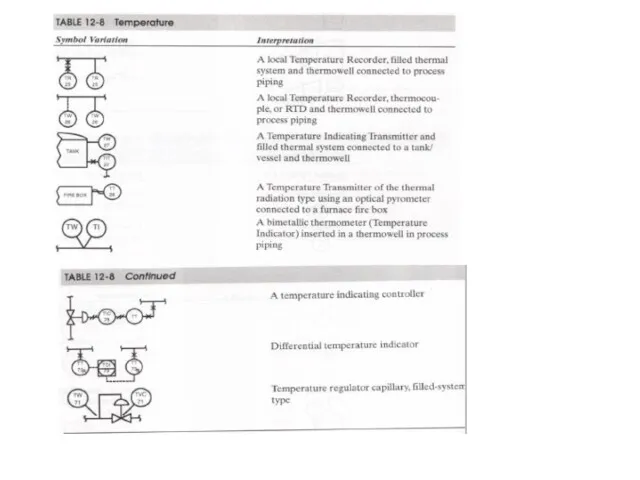
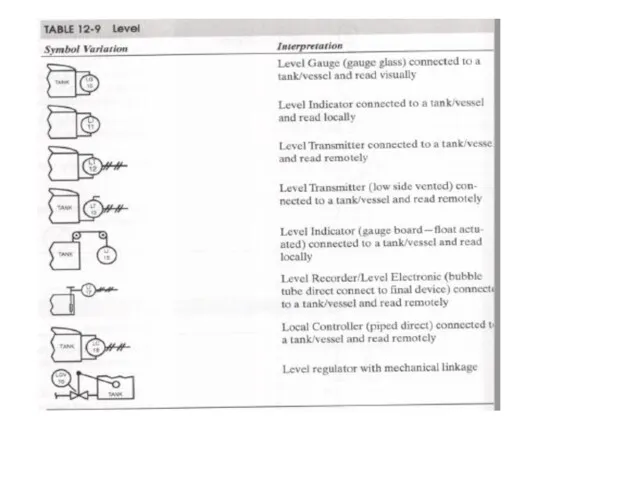
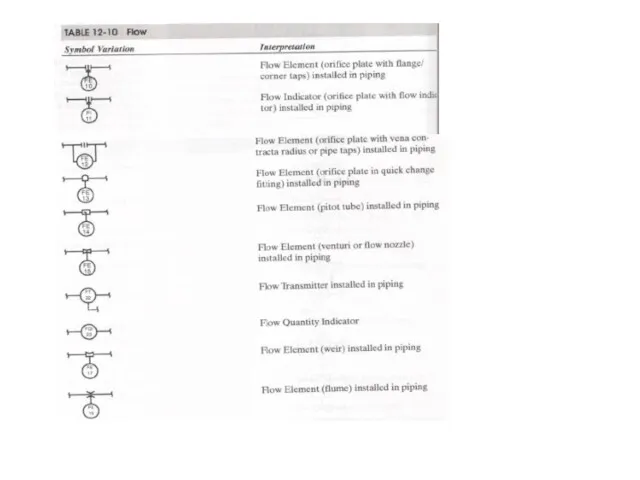
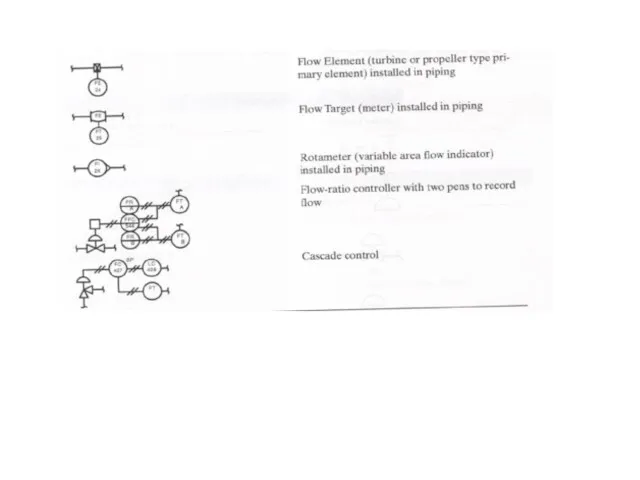
- 12. SYMBOLS In a P&ID, a circle represents individual measurement instruments, such as transmitters, sensors, and detectors
- 13. A hexagon represents computer functions, such as those carried out by a controller A square with
- 29. Скачать презентацию
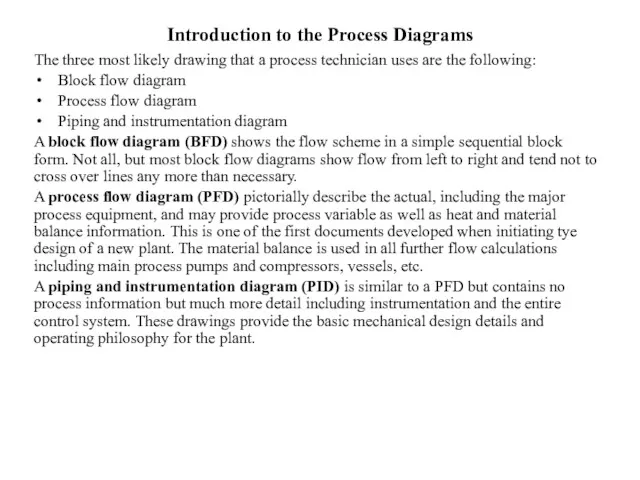
Introduction to the Process Diagrams
The three most likely drawing that a
Introduction to the Process Diagrams
The three most likely drawing that a
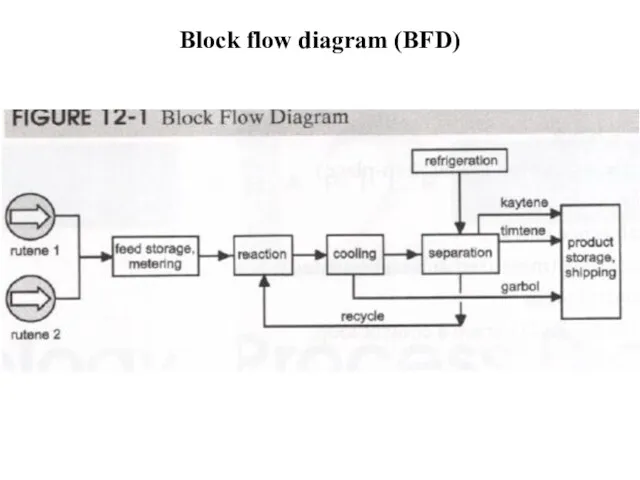
Block flow diagram (BFD)
Block flow diagram (BFD)
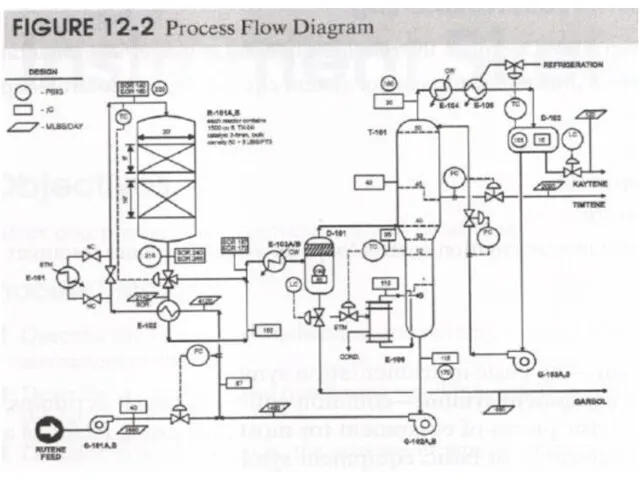
Process flow diagram (PFD)
Process flow diagram (PFD)
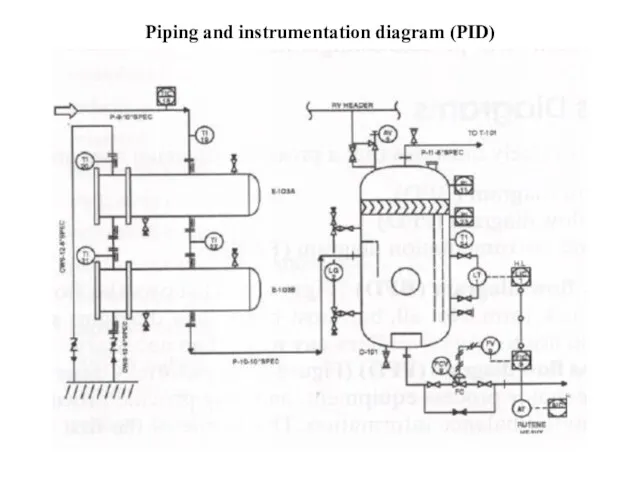
Piping and instrumentation diagram (PID)
Piping and instrumentation diagram (PID)
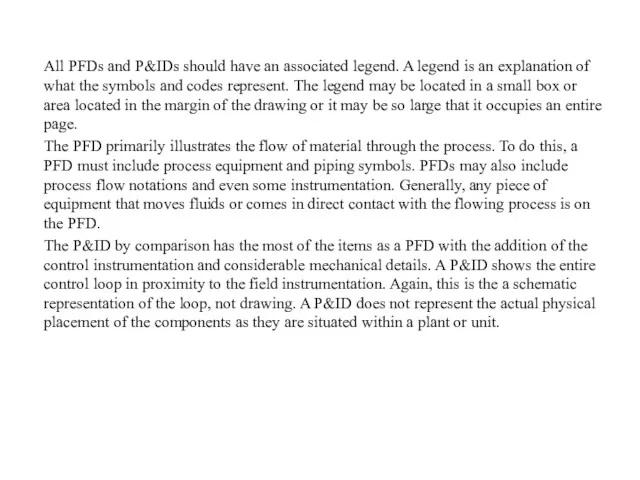
All PFDs and P&IDs should have an associated legend. A legend
All PFDs and P&IDs should have an associated legend. A legend
ISA Instrument Tag Number
An instrument tag number should identify the measured
ISA Instrument Tag Number
An instrument tag number should identify the measured
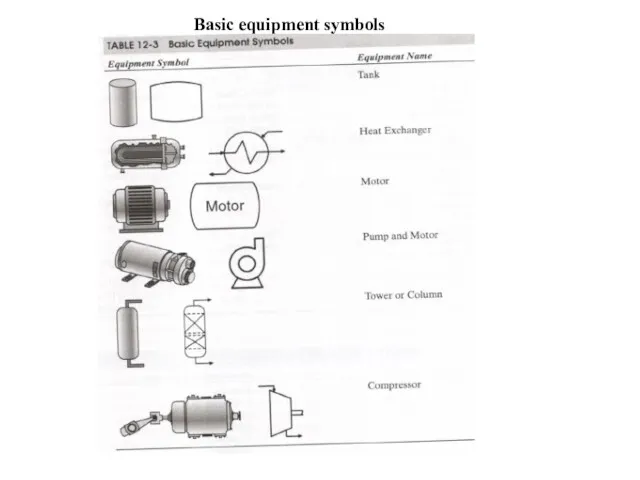
Basic equipment symbols
Basic equipment symbols
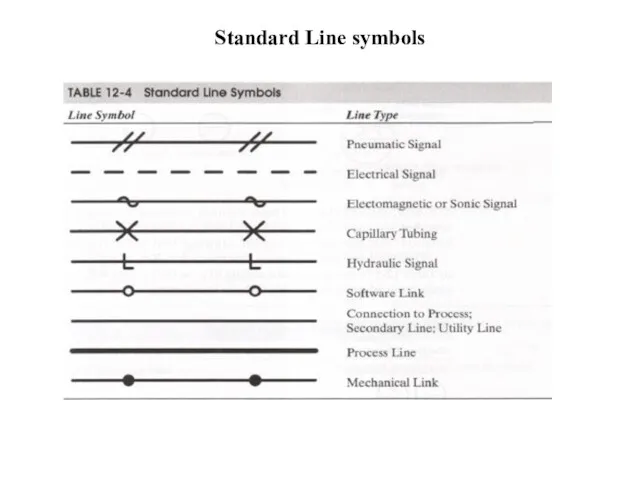
Standard Line symbols
Standard Line symbols
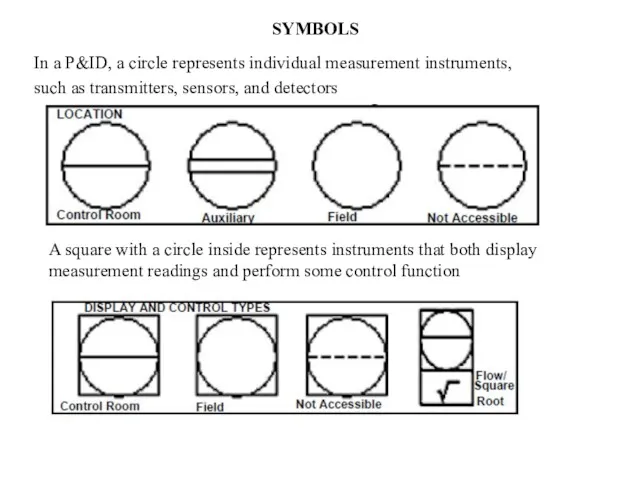
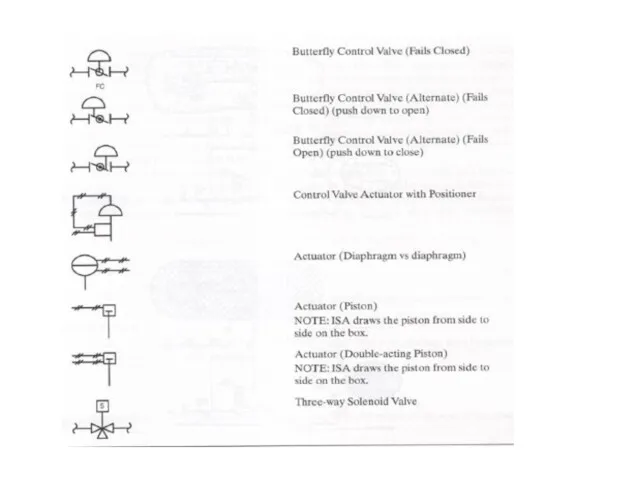
SYMBOLS
In a P&ID, a circle represents individual measurement instruments,
such as transmitters,
SYMBOLS
In a P&ID, a circle represents individual measurement instruments,
such as transmitters,
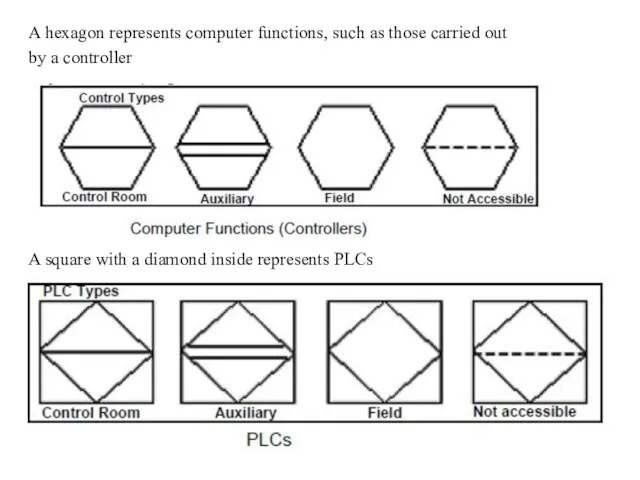
A hexagon represents computer functions, such as those carried out
by a
A hexagon represents computer functions, such as those carried out
by a
 Контрольная работа по истории Средних веков. (6 класс)
 История развития бытовой техники
 Интерактивная игра по безопасности
 Современные автоматические анализаторы мочи
 Использование информационных компьютерных технологий на уроках биологии
 Гражданская война 1918 и интервенция 1918-1921
 Портфолио учителя
 Технология сохранения и стимуляция здоровья в подвижных играх в жизни дошкольников
 Обмен калия в организме человека
 Молодежный клуб Суворовская гостиная
 Презентация Великая Отечественная война
 Социализация дошкольника. Игра как форма социализации дошкольника
 День памяти жертв политических репрессий 30 октября отмечается в России
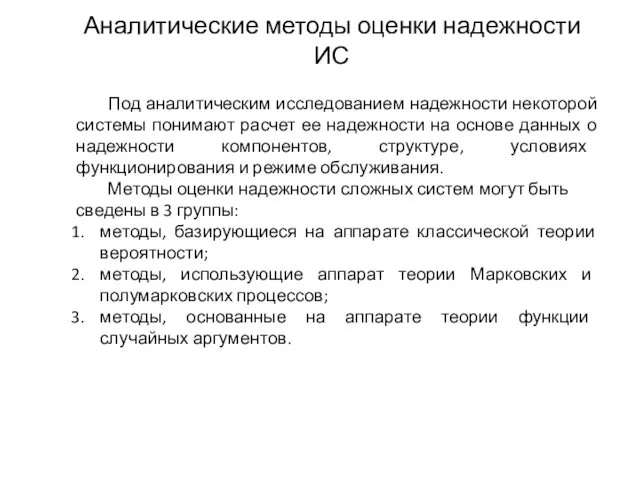 Аналитические методы оценки надежности ИС
 О модернизации системы социальной помощи
 Бесполое размножение организмов
 Китайcкая Народная Республика
 Дошкольное образование
 Поговорим о воспитании
 Государство Индонезия
 Формирование интереса к систематическим занятиям физическими упражнениями у детей дошкольного возраста
 Электроизмерительные приборы и их применение
 Острая сердечная недостаточность (ОСН)
 Непрерывная холодильная цепь
 Всё ж для счастья мало надо: мир в семье, любовь и дети...
 Презентация педагогического проекта Формирование элементарных математических представлений как средство развития мыслительной деятельности у дошкольников с задержкой психического развития
 Семейный бюджет. Доходная и расходная части бюджета
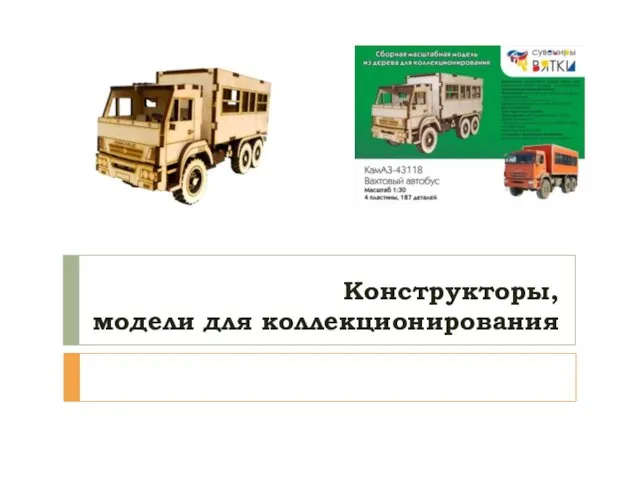 Конструкторы, модели для коллекционирования