- Radar and Satellite Remote Sensing

Содержание
- 2. Outline Background – ice sheet characterization Radar overview Radar basics Radar depth-sounding of ice sheets Example
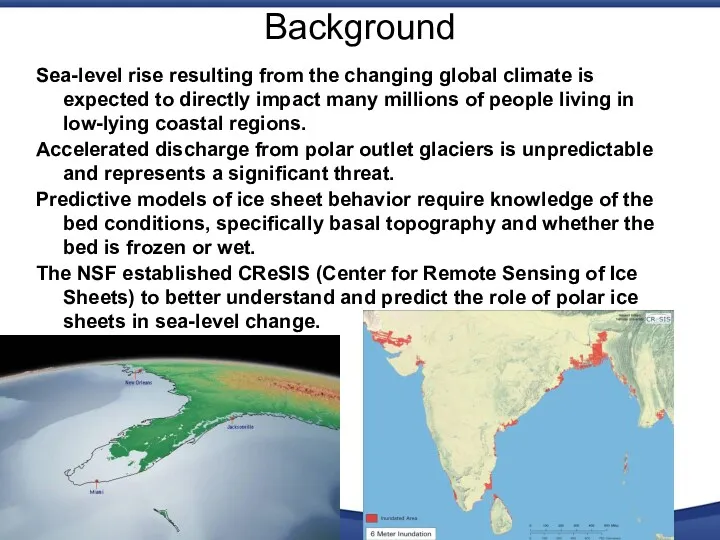
- 3. Background Sea-level rise resulting from the changing global climate is expected to directly impact many millions
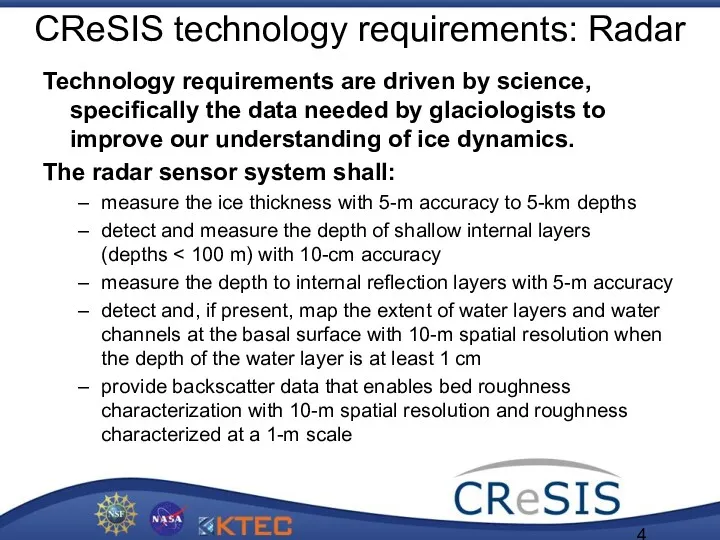
- 4. CReSIS technology requirements: Radar Technology requirements are driven by science, specifically the data needed by glaciologists
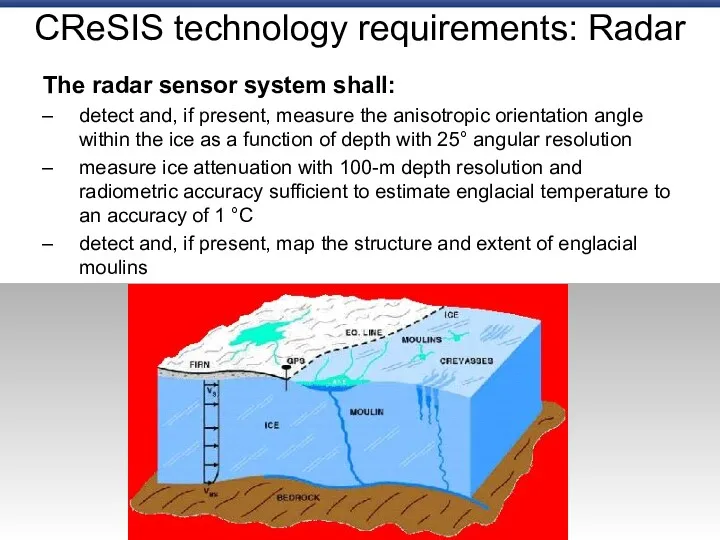
- 5. CReSIS technology requirements: Radar The radar sensor system shall: detect and, if present, measure the anisotropic
- 6. A brief overview of radar Radar – radio detection and ranging Developed in the early 1900s
- 7. Uses electromagnetic (EM) waves Frequencies in the MHz, GHz, THz Shares spectrum with FM, TV, GPS,
- 8. Active sensor Provides its own illumination Operates in day and night Largely immune to smoke, haze,
- 9. Various classes of operation Pulsed vs. continuous wave (CW) Coherent vs. incoherent Measurement capabilities Detection, Ranging
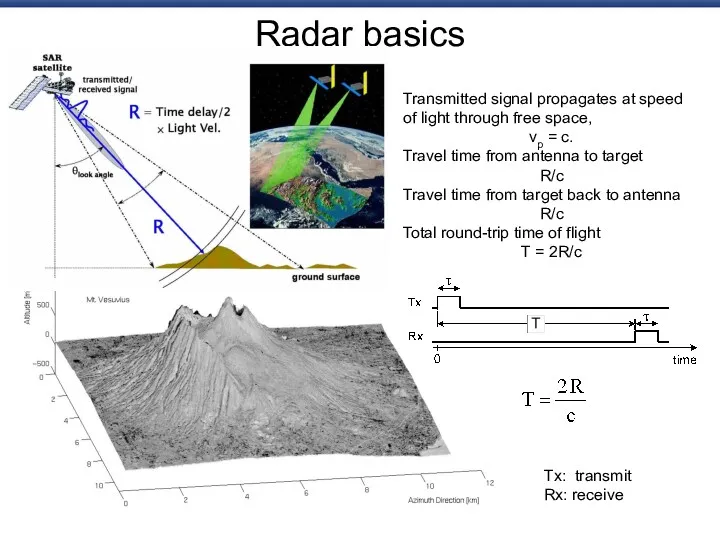
- 10. Radar basics Transmitted signal propagates at speed of light through free space, vp = c. Travel
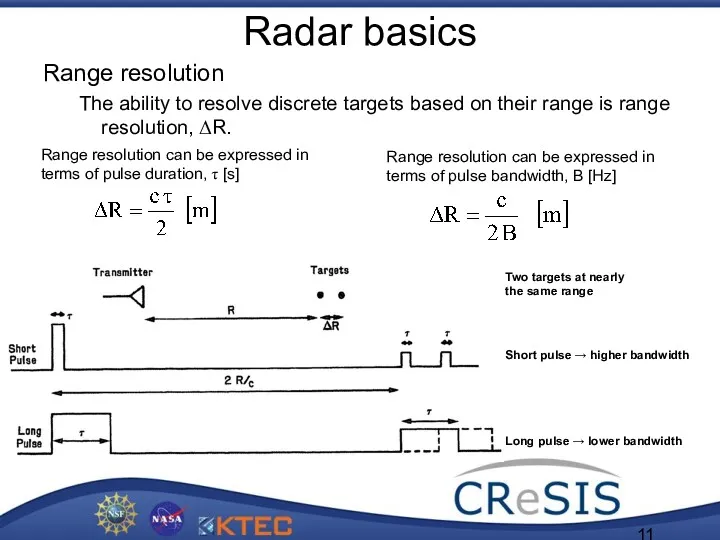
- 11. Radar basics Range resolution The ability to resolve discrete targets based on their range is range
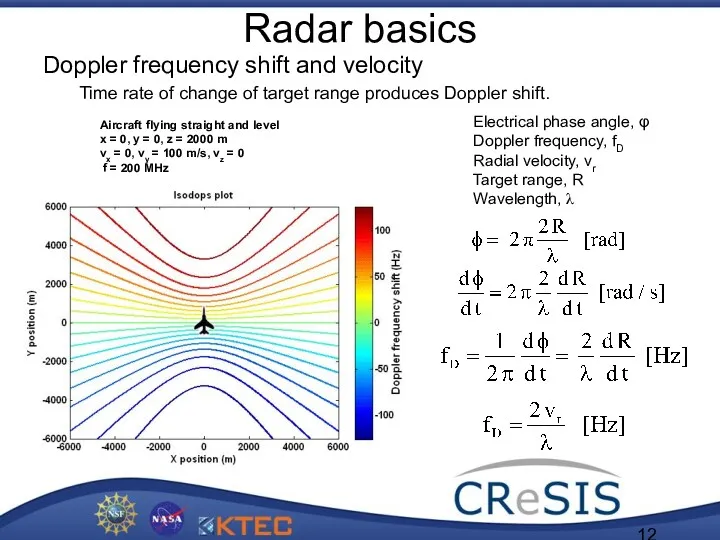
- 12. Radar basics Doppler frequency shift and velocity Time rate of change of target range produces Doppler
- 13. Radar basics
- 14. Synthetic-aperture radar (SAR) concept
- 15. f: 35 GHz Ka-band, 4″ resolution Helicopter and plane static display
- 16. SAR image perception
- 17. Continuous improvements on depthsounder system. Annual measurement campaigns of Greenland ice sheet. More advanced and compact
- 18. Recent field campaigns: Greenland 2007 Seismic Testing Ground-Based Radar Survey Airborne Radar Survey
- 19. Illustration of the airborne depth-sounding radar operation
- 20. Surface clutter Radar height (H); ice surface height (h); Depth of the basal layer (D); topographic
- 21. Wide bandwidth depthsounder Radar echogram collected at Summit, Greenland in July 2004 Compact PCI module (9”
- 22. Accumulation radar system Comparison between airborne radar measurements and ice core records. Simulated and measured radar
- 23. Radar depth sounding of polar ice Multi-Channel Radar Depth Sounder (MCRDS) Platforms: P-3 Orion Twin Otter
- 24. Multichannel SAR To provide wide-area coverage, a ground-based side-looking synthetic-aperture radar (SAR) was developed to image
- 25. Depthsounder data The slower platform speed of a ground-based radar, its increased antenna array size, and
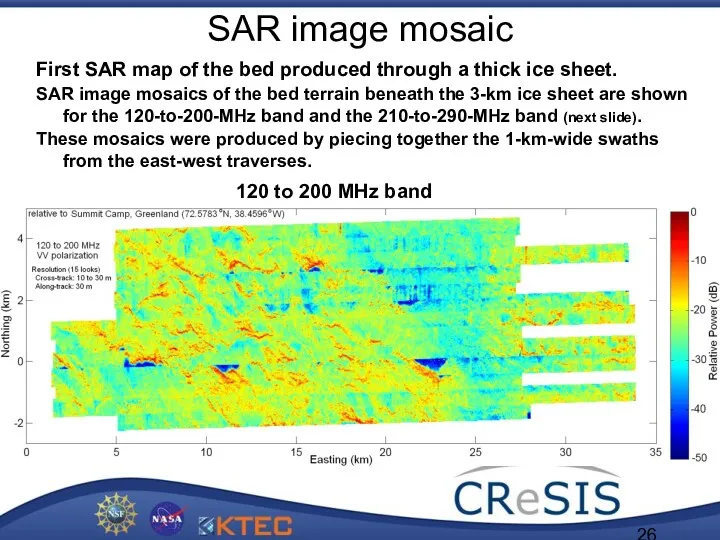
- 26. SAR image mosaic First SAR map of the bed produced through a thick ice sheet. SAR
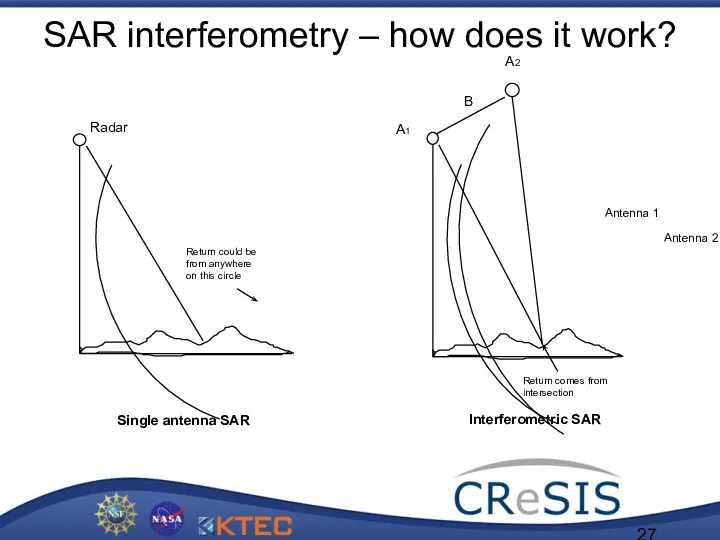
- 27. SAR interferometry – how does it work? Single antenna SAR Interferometric SAR
- 29. InSAR coherent change detection
- 30. Satellite sensing
- 31. ERS-1 Synthetic Aperture Radar f: 5.3 GHz PTX: 4.8 kW ant: 10 m x 1 m
- 32. SAR imagery of Venus Magellan SAR parameters Frequency: 2.385 GHz, Bandwidth: 2.26 MHz Pulse duration: 26.5
- 33. Synthetic Aperture Radar Overview Radarsat-1
- 34. SAR imaging characteristics Range Res ~ pulse width Azimuth = L / 2 ( 25 m
- 35. Single-pass interferometry Single-pass interferometry. Two antennas offset by known baseline.
- 36. Topographic map of North America Shuttle Radar Topography Mission (SRTM) STS-99 Shuttle Endeavour Feb 11 to
- 37. Multipass interferometric SAR (InSAR) Same or similar SAR systems image common region at different times. Differences
- 38. Earthquake displacements Multipass ENVISAT SAR data sets from June 11, 2003, December 3, 2003 and January
- 39. Digital elevation mapping with InSAR Image covers 18.1 km in azimuth, 26.8 km in range. The
- 40. Surface velocity mapping with InSAR Multipass InSAR mapping of horizontal displacement provides surface velocities. Filchner Ice
- 41. Future directions System refinements Eight-channel digitizer (no more time-multiplexing) (6 dB improvement) Reduced bandwidth from 180
- 42. Greenland 2008 Jakobshavn Isbrae and its inland drainage area Extensive airborne campaign and surface-based effort vicinity
- 44. Скачать презентацию
Outline
Background – ice sheet characterization
Radar overview
Radar basics
Radar depth-sounding of ice sheets
Example
Outline
Background – ice sheet characterization
Radar overview
Radar basics
Radar depth-sounding of ice sheets
Example
Background
Sea-level rise resulting from the changing global climate is expected to
Background
Sea-level rise resulting from the changing global climate is expected to
CReSIS technology requirements: Radar
Technology requirements are driven by science, specifically the
CReSIS technology requirements: Radar
Technology requirements are driven by science, specifically the
CReSIS technology requirements: Radar
The radar sensor system shall:
detect and, if present,
CReSIS technology requirements: Radar
The radar sensor system shall:
detect and, if present,
A brief overview of radar
Radar – radio detection and ranging
Developed in
A brief overview of radar
Radar – radio detection and ranging
Developed in
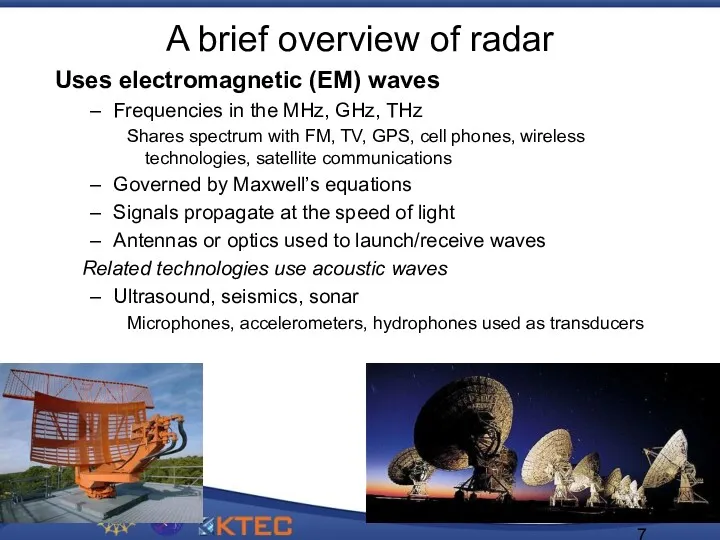
Uses electromagnetic (EM) waves
Frequencies in the MHz, GHz, THz
Shares spectrum with
Uses electromagnetic (EM) waves
Frequencies in the MHz, GHz, THz
Shares spectrum with
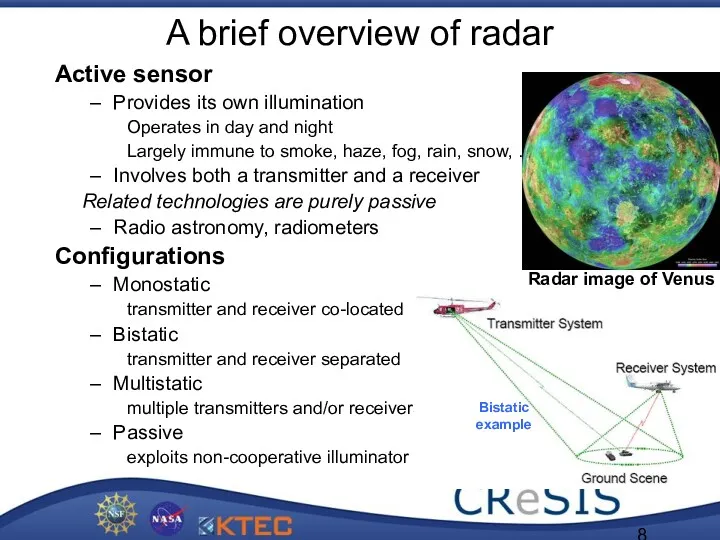
Active sensor
Provides its own illumination
Operates in day and night
Largely immune to
Active sensor
Provides its own illumination
Operates in day and night
Largely immune to
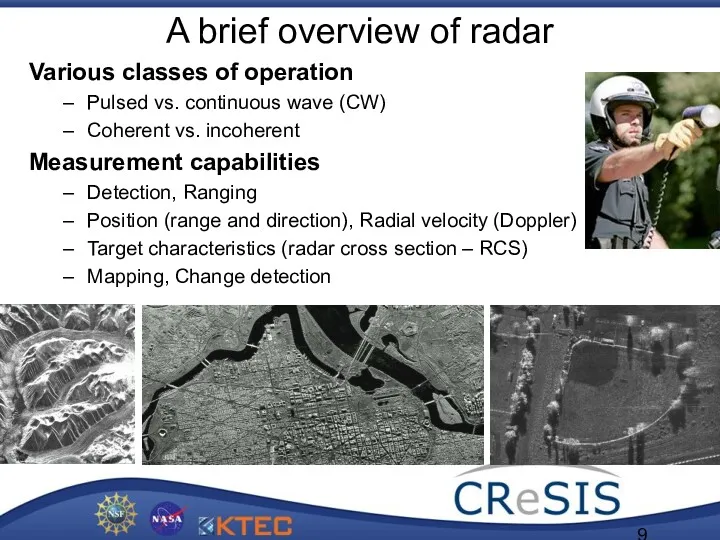
Various classes of operation
Pulsed vs. continuous wave (CW)
Coherent vs. incoherent
Measurement capabilities
Detection,
Various classes of operation
Pulsed vs. continuous wave (CW)
Coherent vs. incoherent
Measurement capabilities
Detection,
Radar basics
Transmitted signal propagates at speed of light through free space,
vp
Radar basics
Transmitted signal propagates at speed of light through free space,
vp
Radar basics
Range resolution
The ability to resolve discrete targets based on their
Radar basics
Range resolution
The ability to resolve discrete targets based on their
Radar basics
Doppler frequency shift and velocity
Time rate of change of target
Radar basics
Doppler frequency shift and velocity
Time rate of change of target
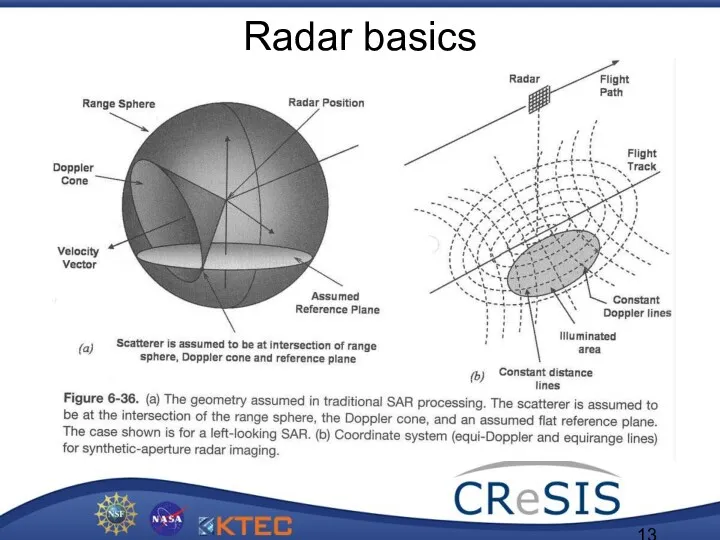
Radar basics
Radar basics
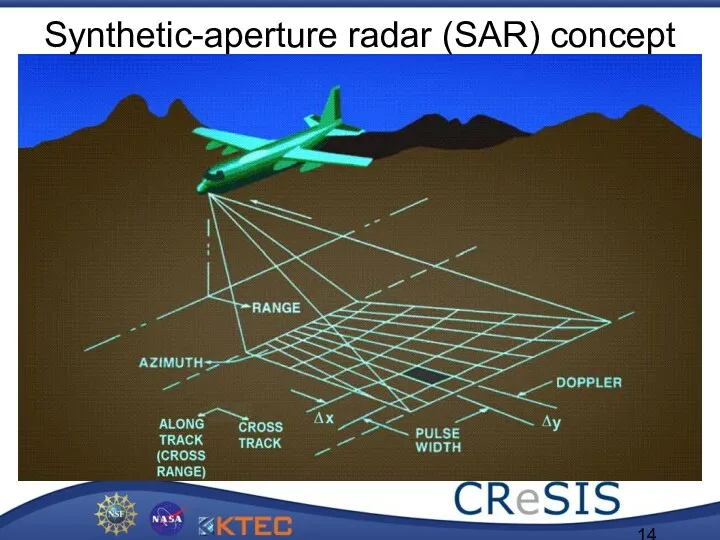
Synthetic-aperture radar (SAR) concept
Synthetic-aperture radar (SAR) concept
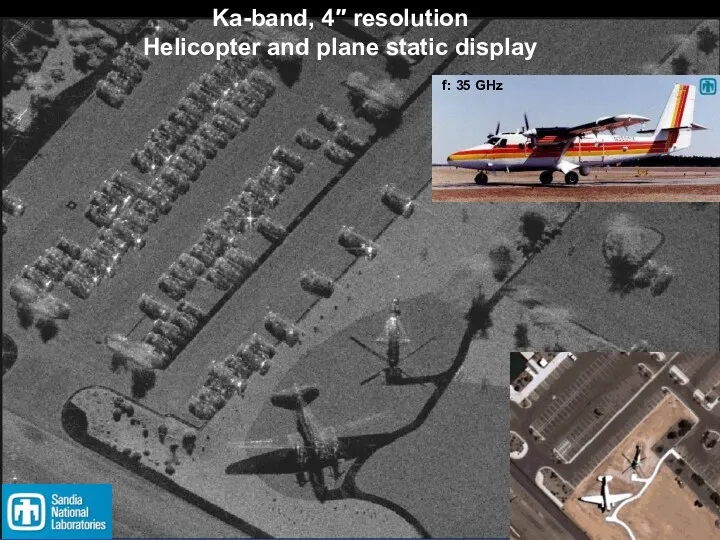
f: 35 GHz
Ka-band, 4″ resolution
Helicopter and plane static display
f: 35 GHz
Ka-band, 4″ resolution
Helicopter and plane static display
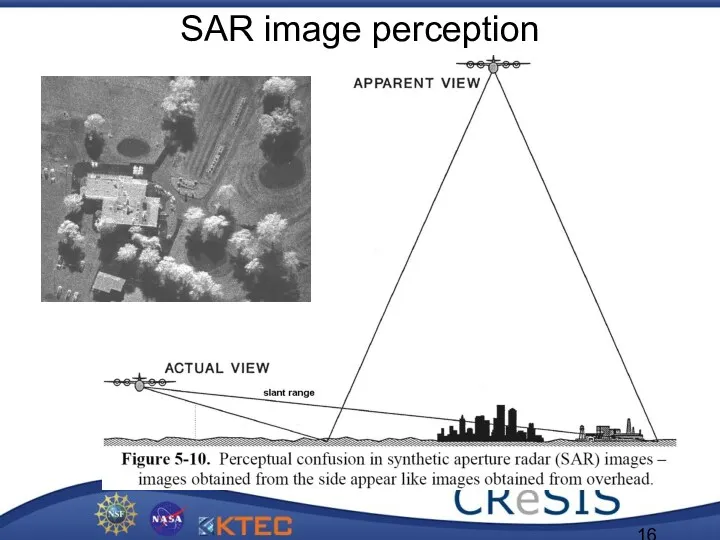
SAR image perception
SAR image perception
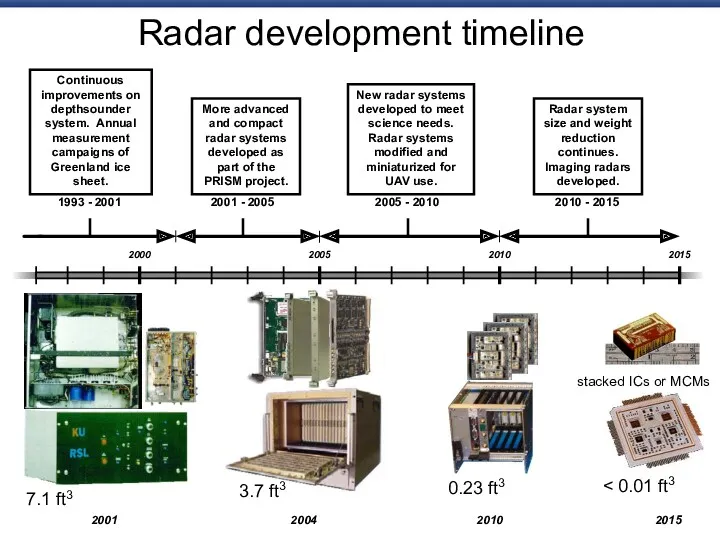
Continuous improvements on depthsounder system. Annual measurement campaigns of Greenland ice
Continuous improvements on depthsounder system. Annual measurement campaigns of Greenland ice
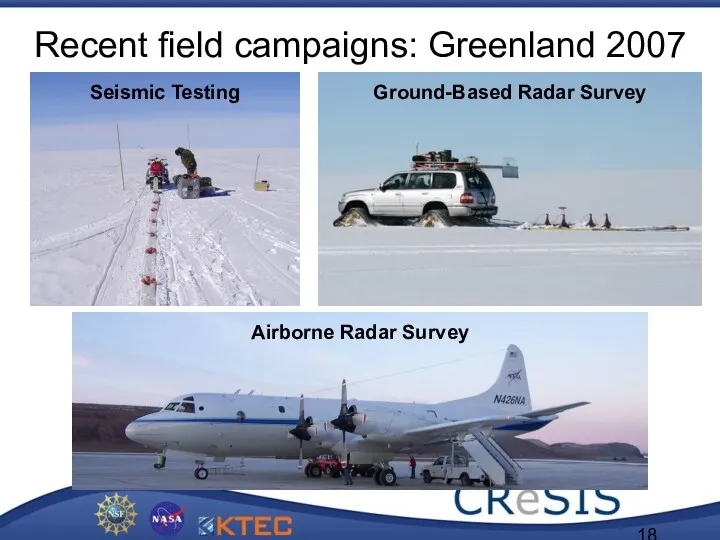
Recent field campaigns: Greenland 2007
Seismic Testing
Ground-Based Radar Survey
Airborne Radar Survey
Recent field campaigns: Greenland 2007
Seismic Testing
Ground-Based Radar Survey
Airborne Radar Survey
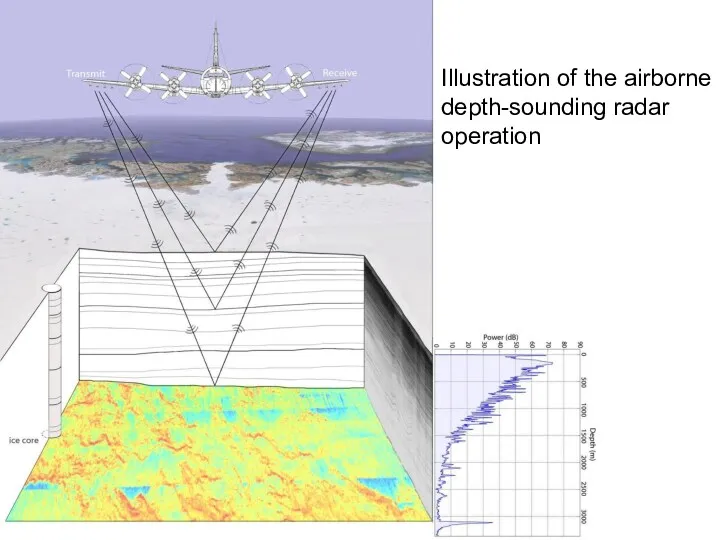
Illustration of the airborne depth-sounding radar operation
Illustration of the airborne depth-sounding radar operation
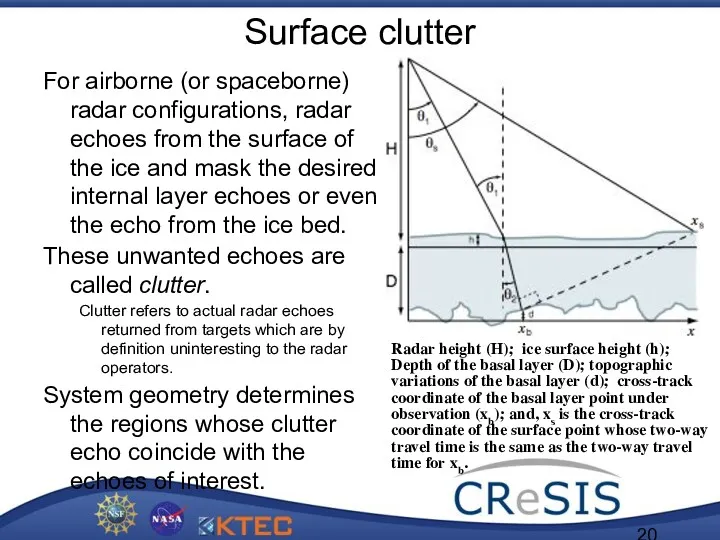
Surface clutter
Radar height (H); ice surface height (h); Depth of the
Surface clutter
Radar height (H); ice surface height (h); Depth of the
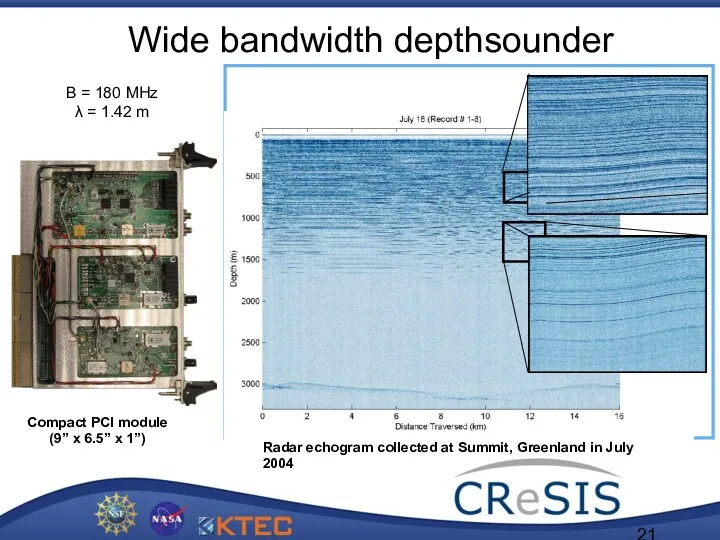
Wide bandwidth depthsounder
Radar echogram collected at Summit, Greenland in July 2004
Compact
Wide bandwidth depthsounder
Radar echogram collected at Summit, Greenland in July 2004
Compact
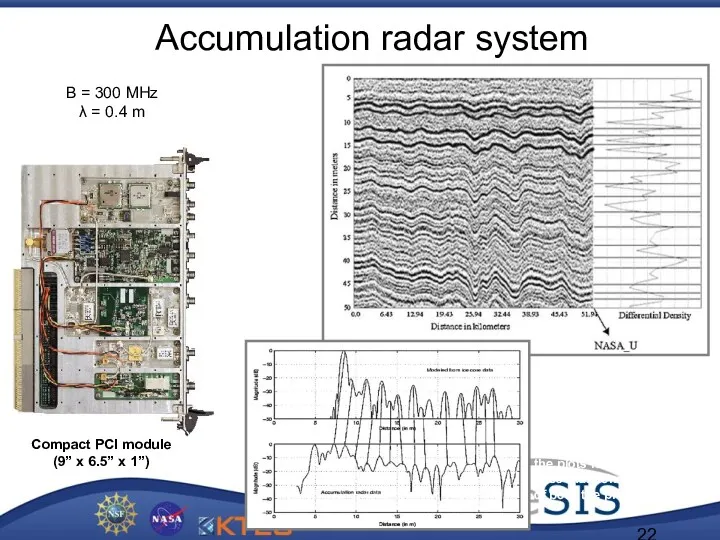
Accumulation radar system
Comparison between airborne radar measurements and ice core records.
Simulated
Accumulation radar system
Comparison between airborne radar measurements and ice core records.
Simulated
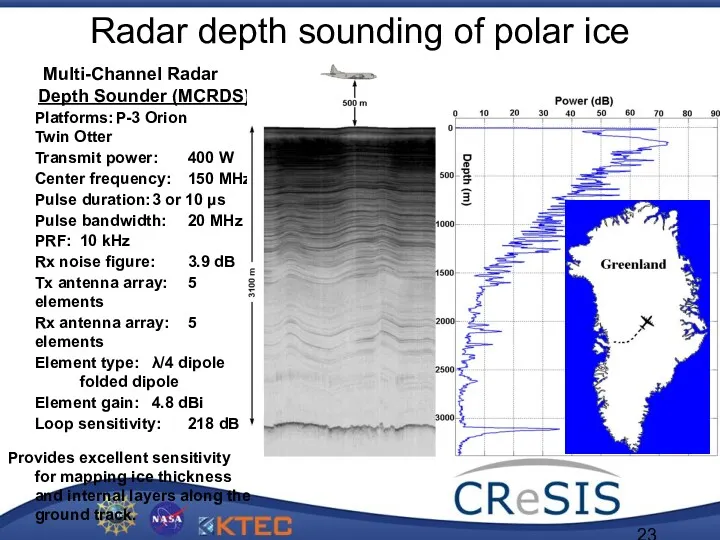
Radar depth sounding of polar ice
Multi-Channel Radar
Depth Sounder (MCRDS)
Platforms: P-3 Orion Twin
Radar depth sounding of polar ice
Multi-Channel Radar
Depth Sounder (MCRDS)
Platforms: P-3 Orion Twin
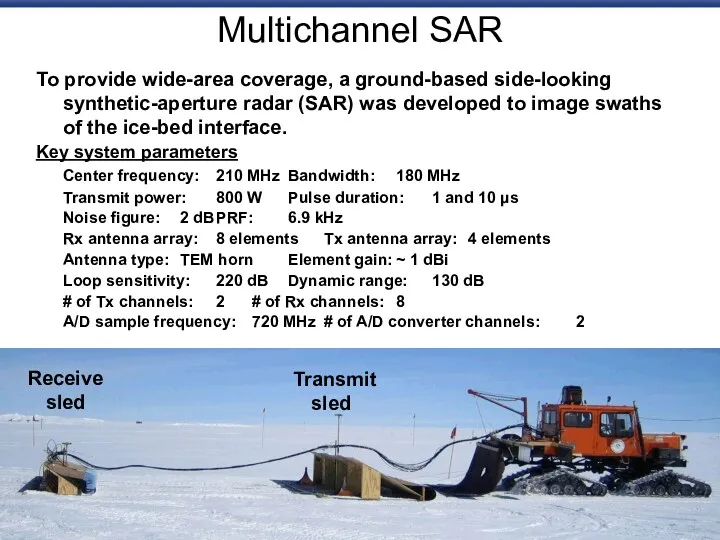
Multichannel SAR
To provide wide-area coverage, a ground-based side-looking synthetic-aperture radar (SAR)
Multichannel SAR
To provide wide-area coverage, a ground-based side-looking synthetic-aperture radar (SAR)
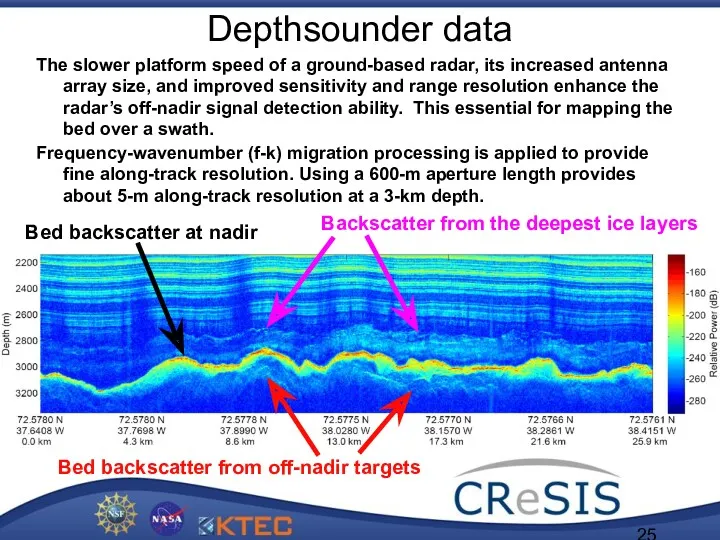
Depthsounder data
The slower platform speed of a ground-based radar, its increased
Depthsounder data
The slower platform speed of a ground-based radar, its increased
SAR image mosaic
First SAR map of the bed produced through a
SAR image mosaic
First SAR map of the bed produced through a
SAR interferometry – how does it work?
Single antenna SAR
Interferometric SAR
SAR interferometry – how does it work?
Single antenna SAR
Interferometric SAR
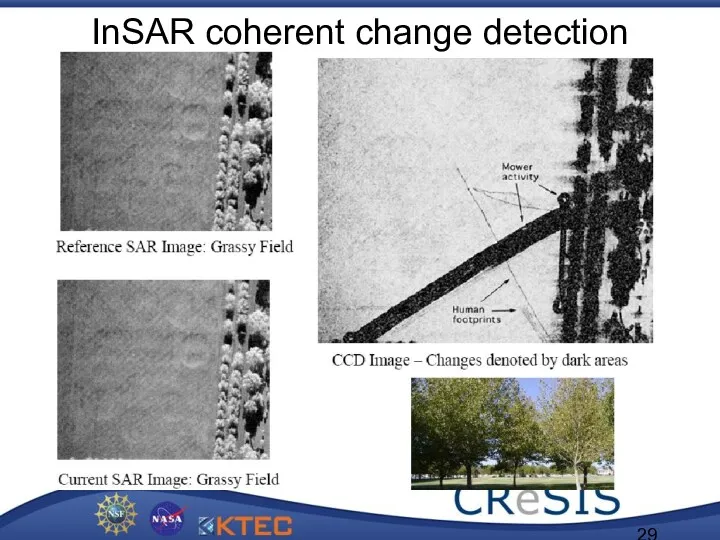
InSAR coherent change detection
InSAR coherent change detection
Satellite sensing
Satellite sensing
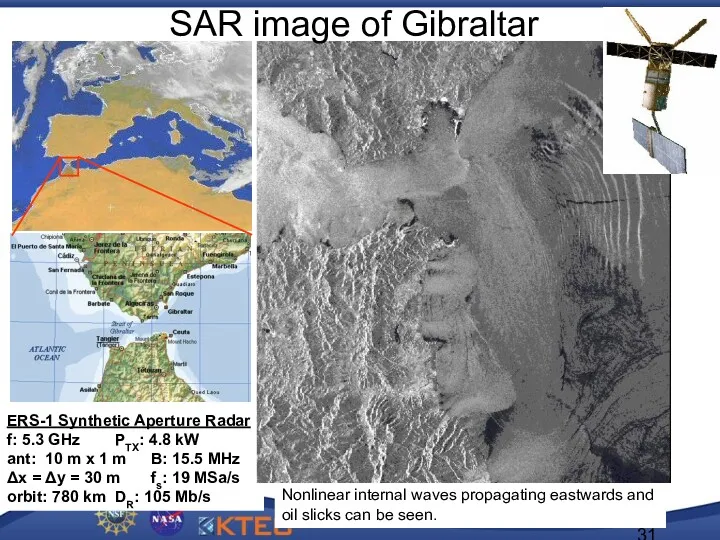
ERS-1 Synthetic Aperture Radar
f: 5.3 GHz PTX: 4.8 kW
ant: 10 m
ERS-1 Synthetic Aperture Radar f: 5.3 GHz PTX: 4.8 kW ant: 10 m
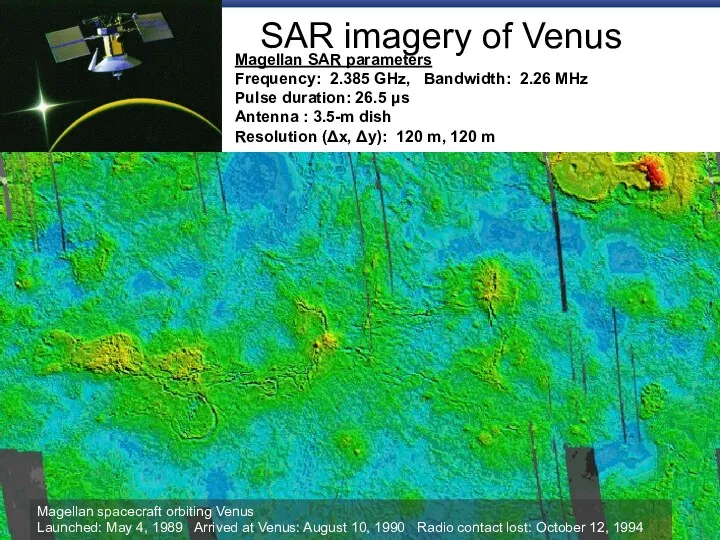
SAR imagery of Venus
Magellan SAR parameters
Frequency: 2.385 GHz, Bandwidth: 2.26 MHz
Pulse
SAR imagery of Venus
Magellan SAR parameters
Frequency: 2.385 GHz, Bandwidth: 2.26 MHz
Pulse
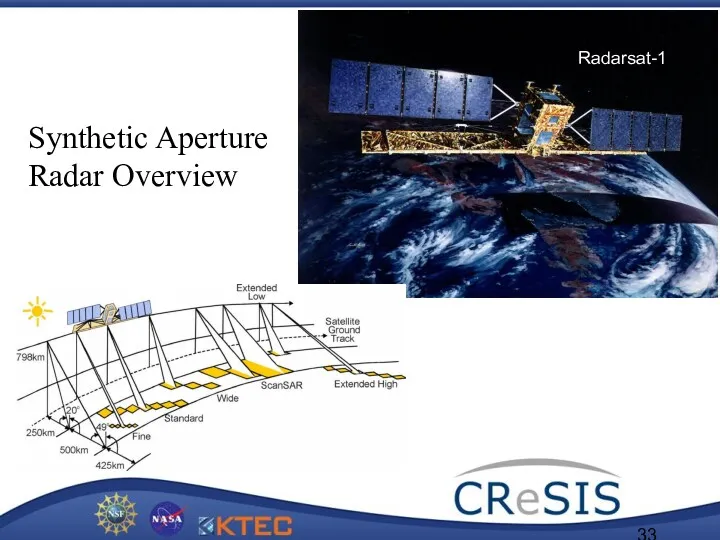
Synthetic Aperture Radar Overview
Radarsat-1
Synthetic Aperture Radar Overview
Radarsat-1
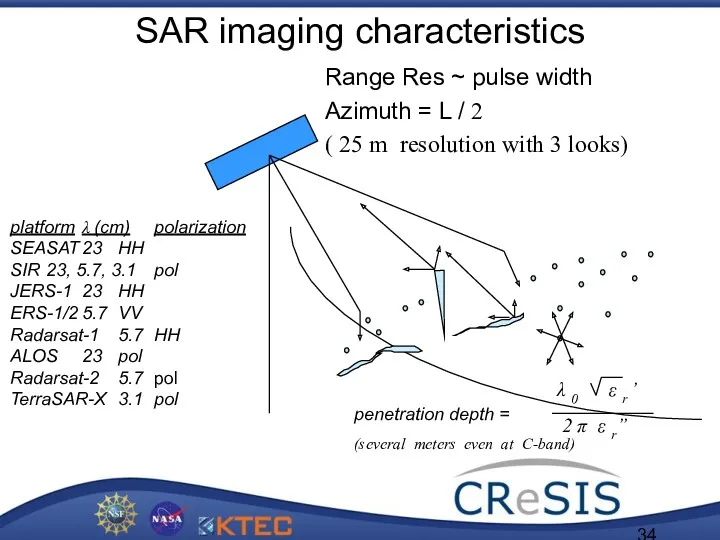
SAR imaging characteristics
Range Res ~ pulse width
Azimuth = L / 2
SAR imaging characteristics
Range Res ~ pulse width
Azimuth = L / 2
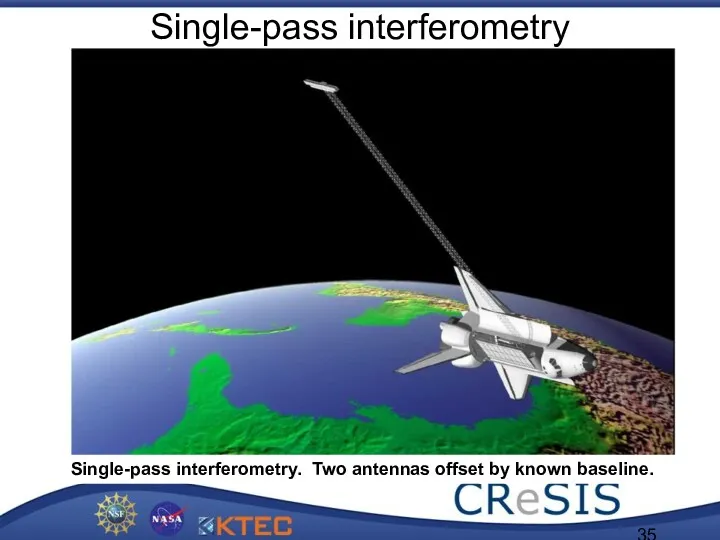
Single-pass interferometry
Single-pass interferometry. Two antennas offset by known baseline.
Single-pass interferometry
Single-pass interferometry. Two antennas offset by known baseline.
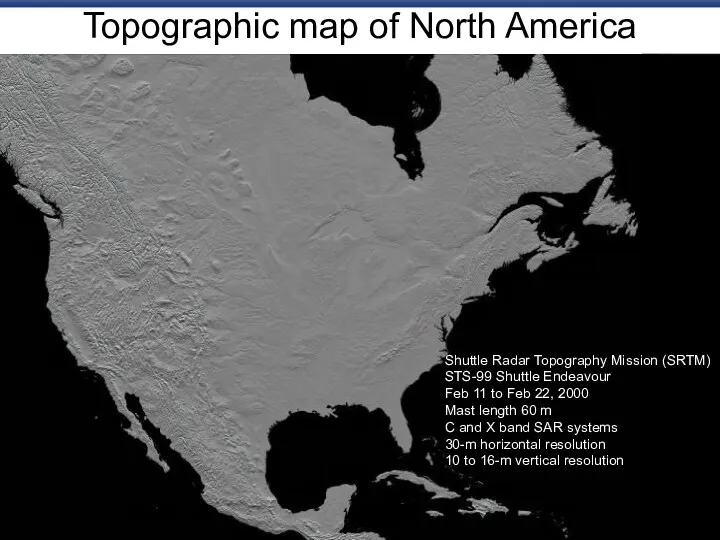
Topographic map of North America
Shuttle Radar Topography Mission (SRTM)
STS-99 Shuttle Endeavour
Feb
Topographic map of North America
Shuttle Radar Topography Mission (SRTM)
STS-99 Shuttle Endeavour
Feb
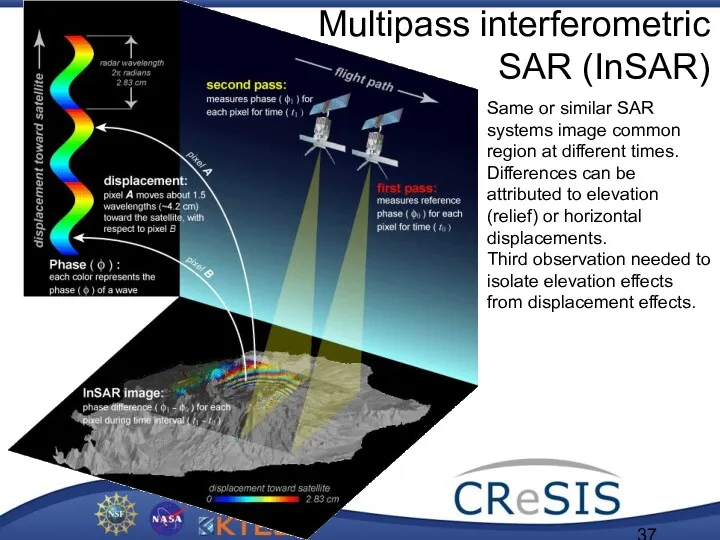
Multipass interferometric
SAR (InSAR)
Same or similar SAR systems image common region
Multipass interferometric
SAR (InSAR)
Same or similar SAR systems image common region
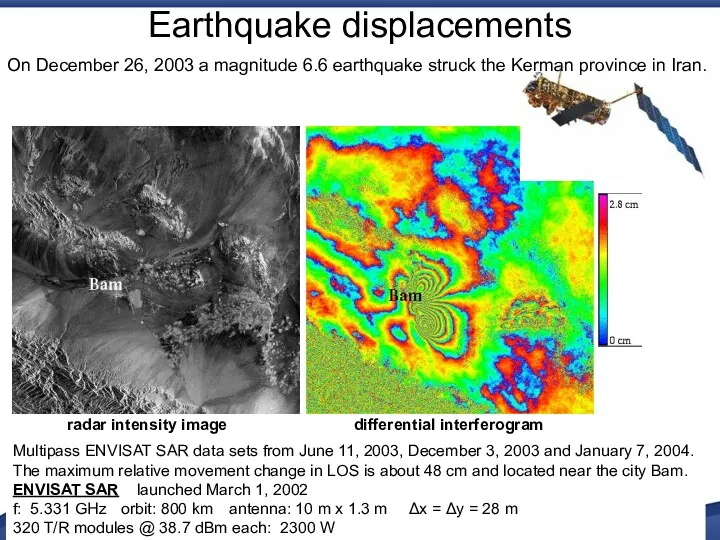
Earthquake displacements
Multipass ENVISAT SAR data sets from June 11, 2003, December
Earthquake displacements
Multipass ENVISAT SAR data sets from June 11, 2003, December
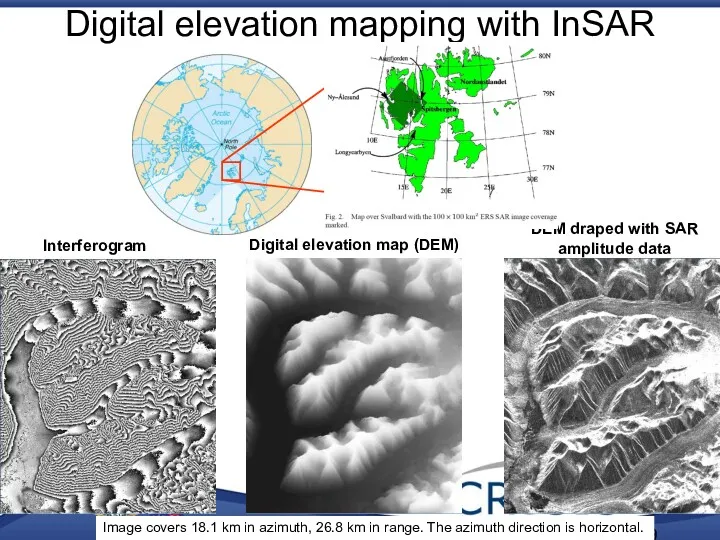
Digital elevation mapping with InSAR
Image covers 18.1 km in azimuth, 26.8
Digital elevation mapping with InSAR
Image covers 18.1 km in azimuth, 26.8
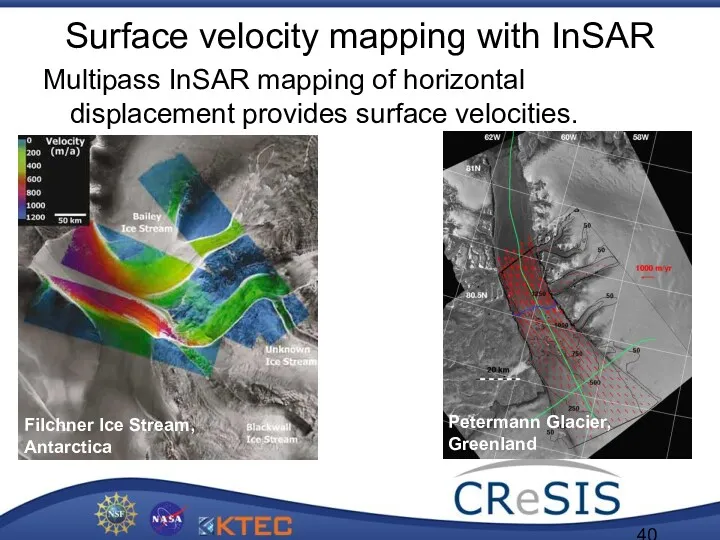
Surface velocity mapping with InSAR
Multipass InSAR mapping of horizontal displacement provides
Surface velocity mapping with InSAR
Multipass InSAR mapping of horizontal displacement provides
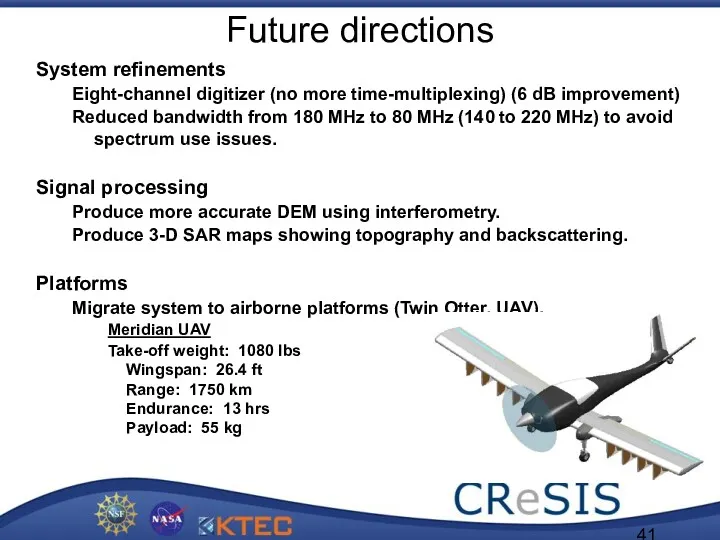
Future directions
System refinements
Eight-channel digitizer (no more time-multiplexing) (6 dB improvement)
Reduced bandwidth
Future directions
System refinements
Eight-channel digitizer (no more time-multiplexing) (6 dB improvement)
Reduced bandwidth
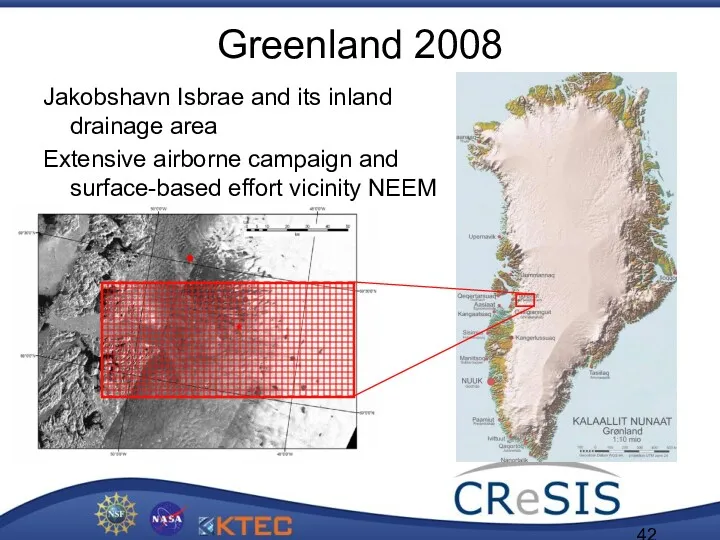
Greenland 2008
Jakobshavn Isbrae and its inland drainage area
Extensive airborne campaign and
Greenland 2008
Jakobshavn Isbrae and its inland drainage area
Extensive airborne campaign and
 РУССКИЙ ДЕЕПРИЧАСТИЕ
 Food idioms
 Bino va inshootlar zilzilabardoshligi
 Учимся создавать электронное портфолио
 Гальванические покрытия
 Сети связи с подвижными объектами
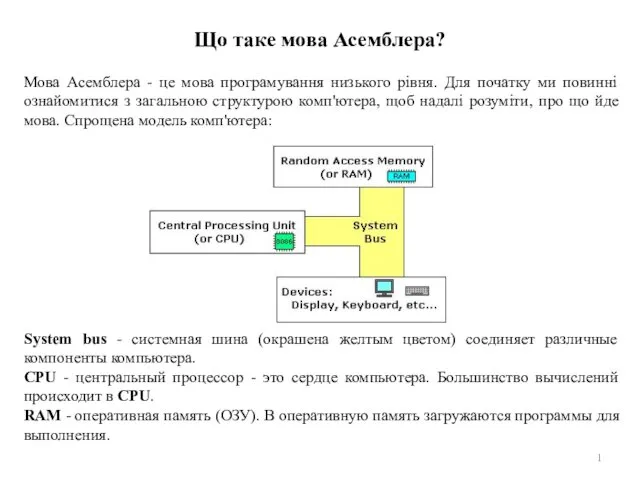 Цифрові технології. Мова Асемблера. (Тема 6-7)
 Проектная деятельность в начальной школе
 Транзисторы. (Лекция 6)
 Комплексные методы управления качеством
 Итальянский костюм Возрождения
 Контрольная уборка и выпуск шасси
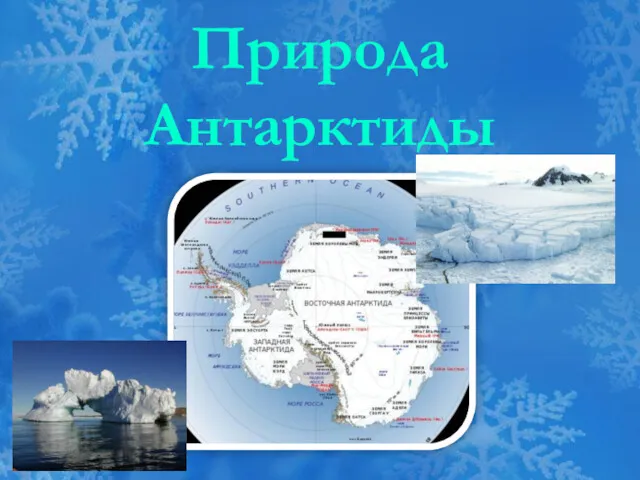 Антарктида.2
 Презентация Серная кислота
 Объекты Range и Selection
 Игры в Европе и как их готовить
 Я то, что я ем
 Способы очистки газов от пыли
 Обобщение опыта воспитательной работы
 Организации как субъекты административного права
 Роль игры в развитие ребенка
 День Святого Валентина
 Совет молодежи АО ТЯЖМАШ. Отчет о результатах работы за 2018 год
 Волшебство из бисера
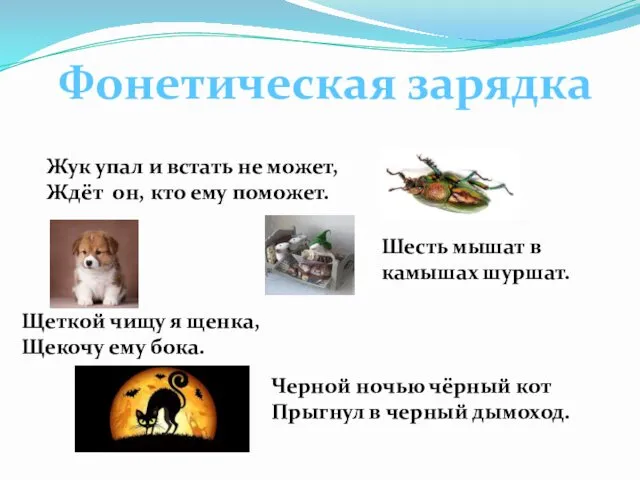 Лексико-грамматические разряды существительных
 Различение звуков П-Т.
 Атлант-Ю. Бюджетные комплекты техники Tessa
 Природные зоны Республики Татарстан (часть 2)