- Simulation modeling

Содержание
- 2. Guidelines for solution: Simulation modeling is a tool that allows to build the models describing processes
- 3. The probability of the event is determined by the formula pi – the probability of the
- 4. Iinear interpolation Experts of Department of the threats analysis examined 6 companies and got the following
- 5. Interpolation is a method of finding intermediate values of number according to the available discrete set
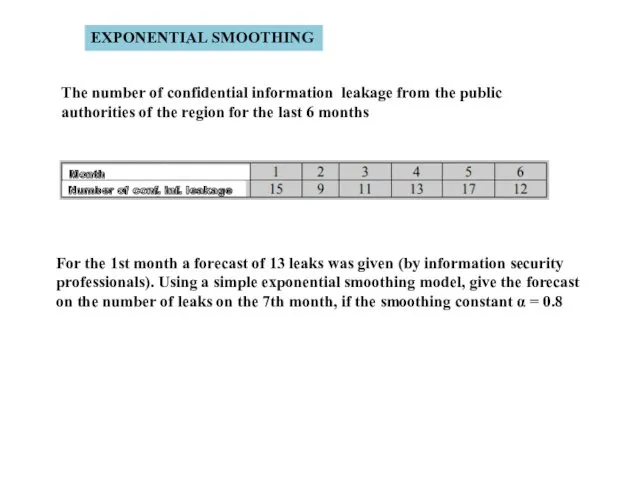
- 6. EXPONENTIAL SMOOTHING The number of confidential information leakage from the public authorities of the region for
- 7. Exponential smoothing is a method of quickly getting the forecast for 1 period ahead, which automatically
- 8. The greater α, the less the influence of the previous years. If the value of α
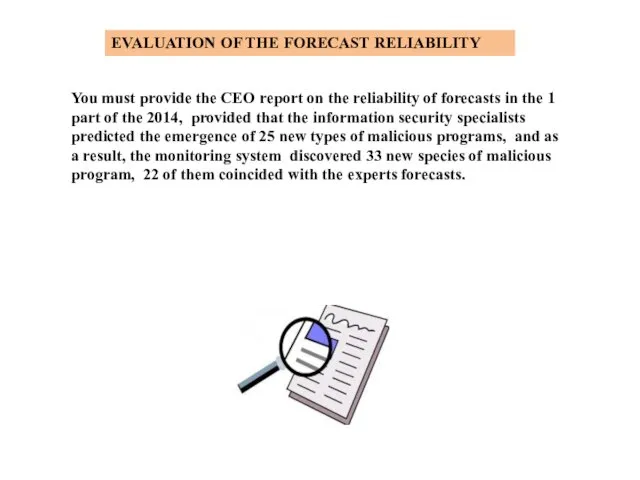
- 9. EVALUATION OF THE FORECAST RELIABILITY You must provide the CEO report on the reliability of forecasts
- 10. With the help of Euler circles depict schematically the conditions of the problem Nпр = 25,
- 11. 1. The degree of reliability of the forecast is characterized by credibility /reliability and accuracy, as
- 12. Forecast accuracy Nнаст – the number of occurred events If the event was predicted but did
- 14. Скачать презентацию
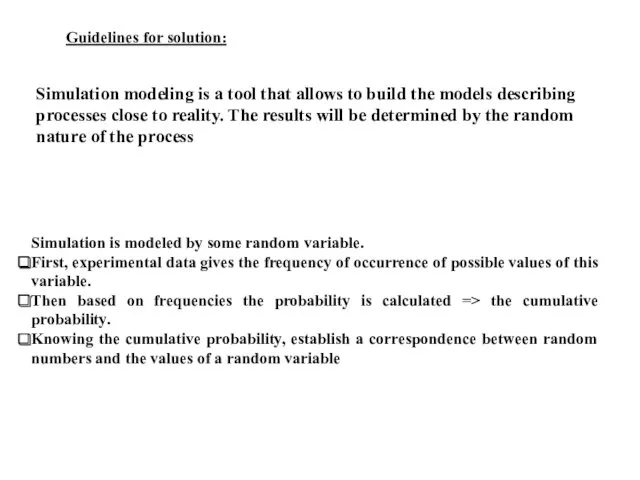
Guidelines for solution:
Simulation modeling is a tool that allows to build
Guidelines for solution:
Simulation modeling is a tool that allows to build
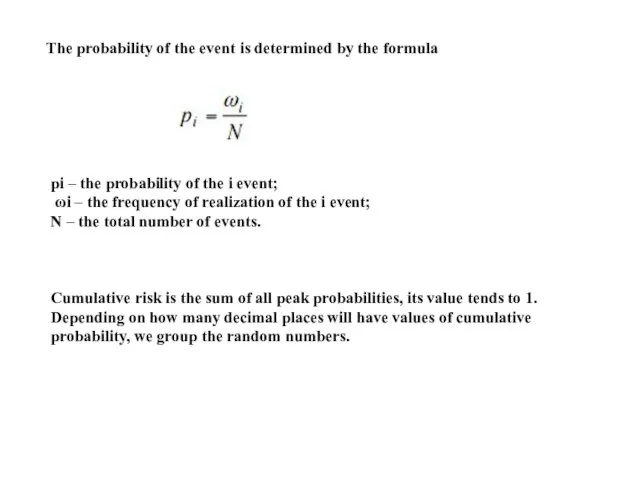
The probability of the event is determined by the formula
pi –
The probability of the event is determined by the formula
pi –
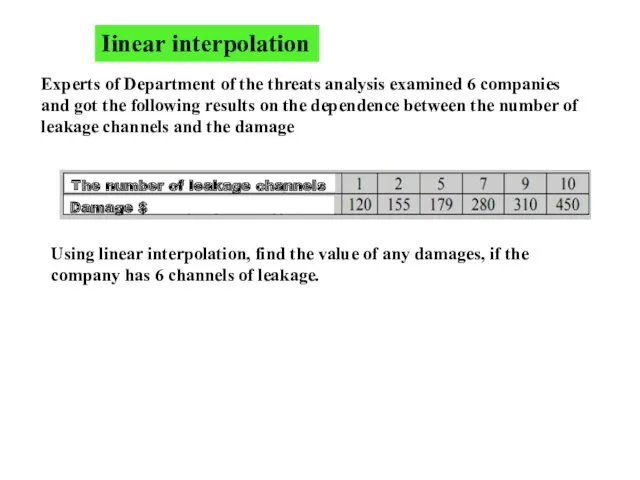
Iinear interpolation
Experts of Department of the threats analysis examined 6 companies
Iinear interpolation
Experts of Department of the threats analysis examined 6 companies
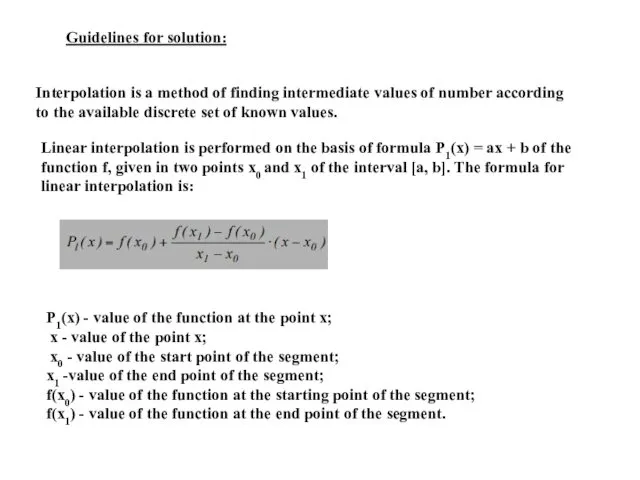
Interpolation is a method of finding intermediate values of number according
Interpolation is a method of finding intermediate values of number according
EXPONENTIAL SMOOTHING
The number of confidential information leakage from the public authorities
EXPONENTIAL SMOOTHING
The number of confidential information leakage from the public authorities
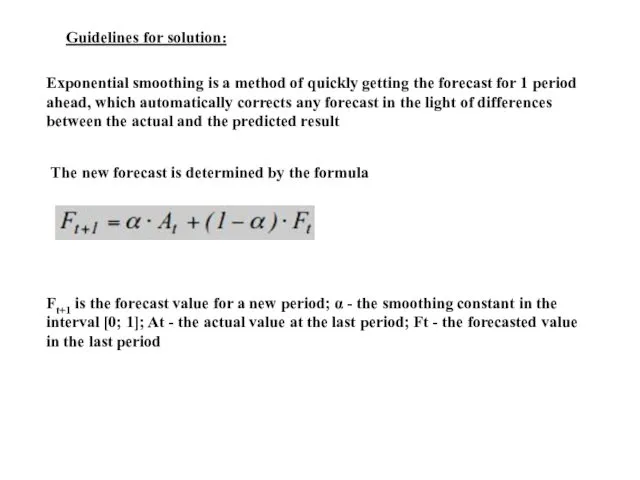
Exponential smoothing is a method of quickly getting the forecast for
Exponential smoothing is a method of quickly getting the forecast for
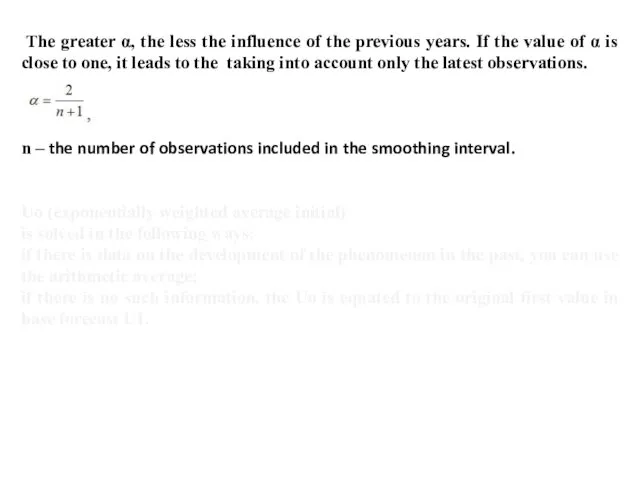
The greater α, the less the influence of the previous
The greater α, the less the influence of the previous
EVALUATION OF THE FORECAST RELIABILITY
You must provide the CEO report on
EVALUATION OF THE FORECAST RELIABILITY
You must provide the CEO report on
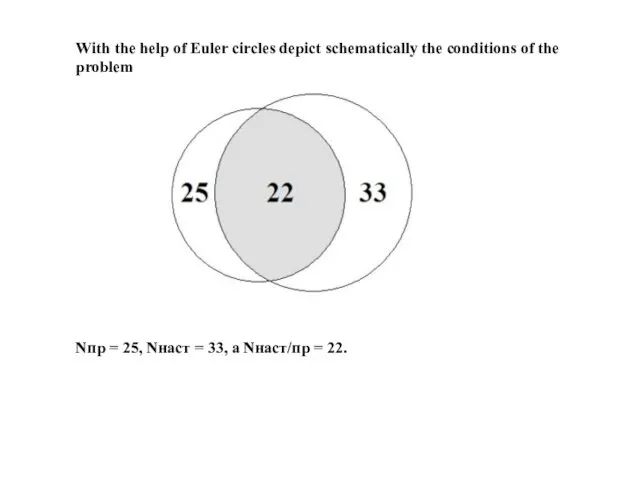
With the help of Euler circles depict schematically the conditions of
With the help of Euler circles depict schematically the conditions of
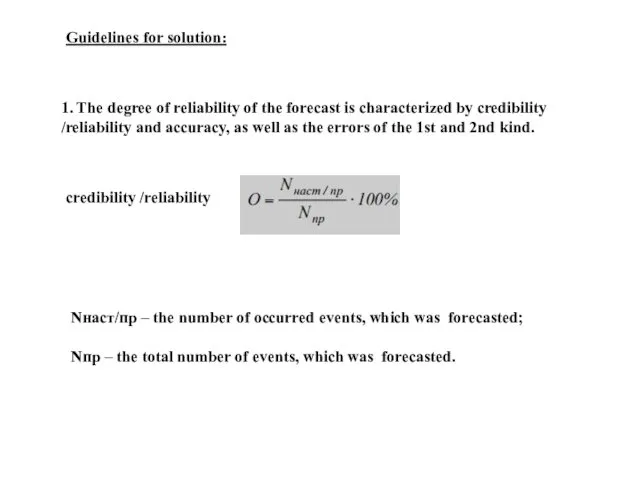
1. The degree of reliability of the forecast is characterized by
1. The degree of reliability of the forecast is characterized by
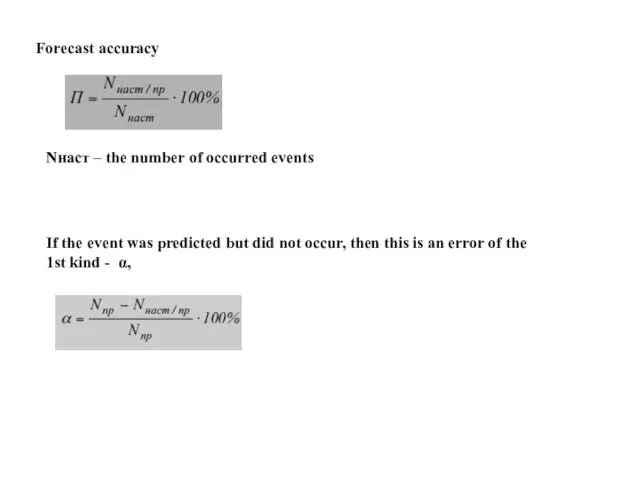
Forecast accuracy
Nнаст – the number of occurred events
If the event was
Forecast accuracy
Nнаст – the number of occurred events
If the event was
 Современные средства поражения
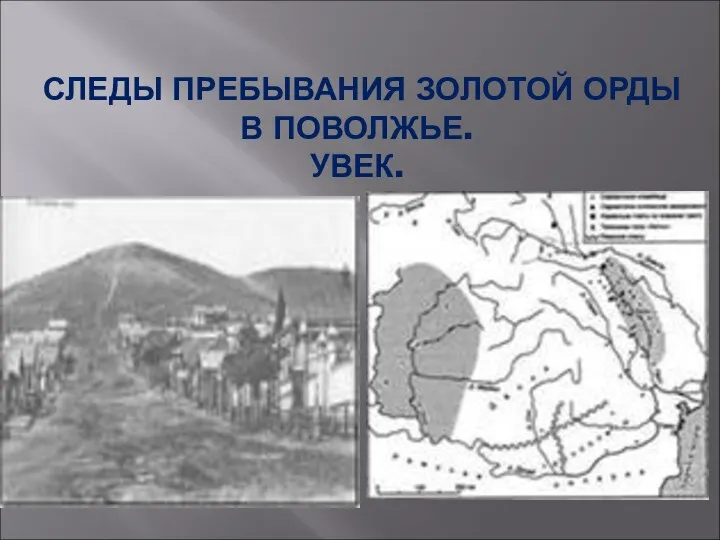 Золотая Орда В Поволжье .Увек.
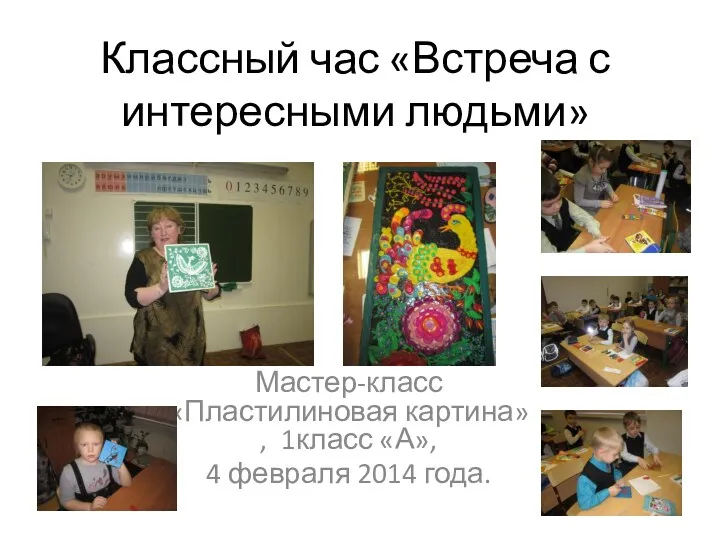 Встреча с интересными людьми.
 Unicorn sight word match. Graphics by prettygrafik design
 Роль страховой медицинской организации в повышении доступности медицинской помощи
 Мы живём среди друзей
 Развитие детского аутизма и аутистические черты личности
 Этапы компьютерного моделирования
 группа раннего развития
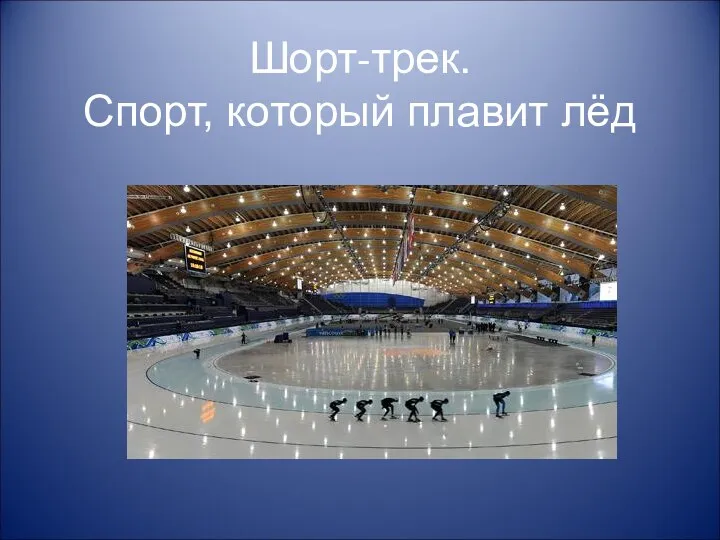 Презентации по зимним видам спорта
 Классный час Научите свое сердце добру
 Презентация Теоретические основы работы с детьми с задержкой психического развития
 Учение о биосфере. (Лекция 2)
 МОЙ ЛУЧШИЙ ДРУГ - ПАПА
 Бабушкин сундук ( Әбиемнең сандыгы)
 Жаңадан шыққан техникалар
 Скакалочка. Игра
 Чтение №104. Сказки А. С. Пушкина
 Методические рекомендации по организации выполнения и защиты, оформлению выпускной квалификационной работы
 Классный час Мое Приморье
 Устная часть ЕГЭ по английскому языку
 Праздники народов россии
 Профилактика инфекционных болезней и эпидемий. Карантинные инфекции и особо опасные инфекции
 Лямблиоз у детей
 Работа с ритмом на уроке сольфеджио
 Развитие мелкой моторики через различные виды деятельности
 Дослідження та удосконалення САК температурним режимом зерносушарки на хлібокомбінаті
 Пожарная безопасность для дошкольников 5-7 лет