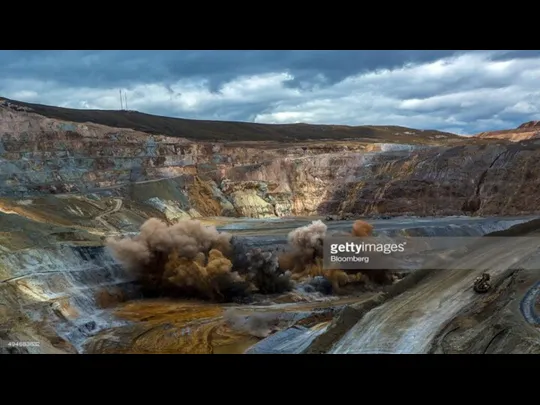
- Utilization of seismic and infrasound signals for characterizing mining explosions

Содержание
- 3. Microseismic System Sensors: Uniaxial and triaxial accelerometers and/or geophones. Junction Box - (JB): A NEMA-4 enclosure
- 4. Figure 1: Peak Pg amplitudes observed at array element 03 of PDAR (360 km range) from
- 5. Figure 2: Peak P and Rg amplitudes observed at EYMN (Ely, Minnesota) from taconite fragmentation explosions
- 6. Figure 3: Peak amplitudes of in-mine recordings at Morenci are compared to total amount of explosives
- 7. Figure 4: The three components of the equivalent mining explosion source model are represented pictorially. They
- 8. Figure 5: Spall mass (per hole) for the taconite hard rock explosions (open diamonds) and a
- 9. Figure 6: The mining explosion source model was used to produce synthetics for a distance and
- 10. Figure 7: The mining explosion source model was also used to compute synthetics for the large-scale
- 11. Figure 8: Mining explosions from the hard rock copper mines in southeastern Arizona generate infrasound signals
- 12. Figure 9: Infrasound (channels 1,2, 3) and seismic data (channel 4) from a seismo-acoustic station installed
- 13. Figure 10: The details of the infrasound (channels 1-3) and seismic (channel 4) signals from the
- 15. Скачать презентацию
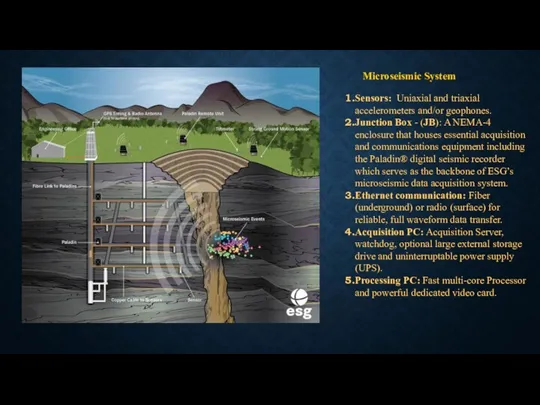
Microseismic System
Sensors: Uniaxial and triaxial accelerometers and/or geophones.
Junction Box - (JB): A
Microseismic System
Sensors: Uniaxial and triaxial accelerometers and/or geophones.
Junction Box - (JB): A
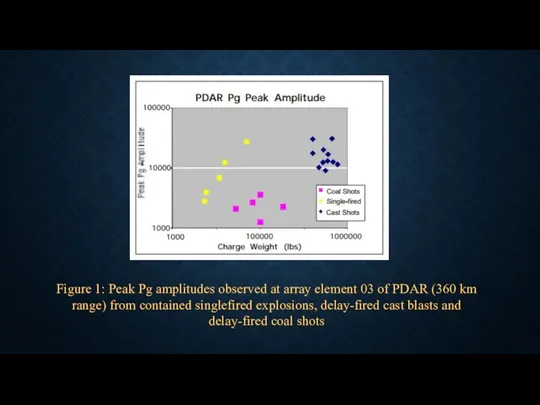
Figure 1: Peak Pg amplitudes observed at array element 03 of
Figure 1: Peak Pg amplitudes observed at array element 03 of
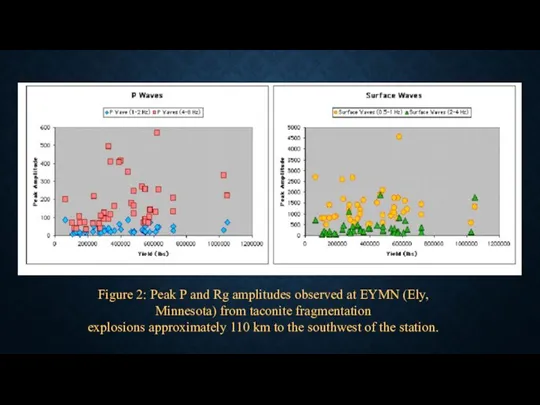
Figure 2: Peak P and Rg amplitudes observed at EYMN (Ely,
Figure 2: Peak P and Rg amplitudes observed at EYMN (Ely,
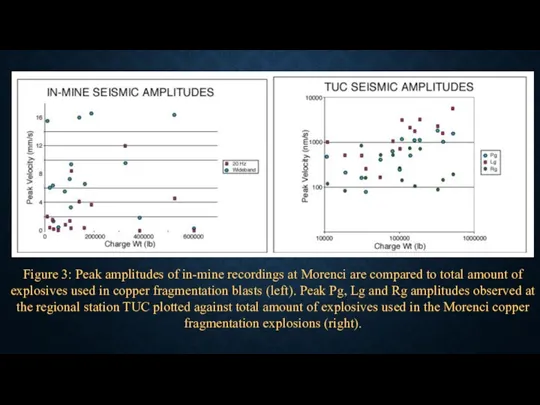
Figure 3: Peak amplitudes of in-mine recordings at Morenci are compared
Figure 3: Peak amplitudes of in-mine recordings at Morenci are compared
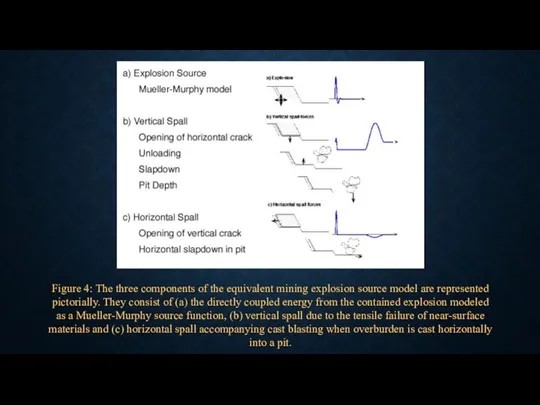
Figure 4: The three components of the equivalent mining explosion source
Figure 4: The three components of the equivalent mining explosion source
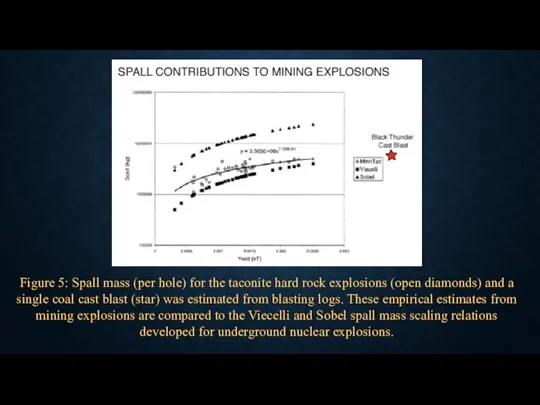
Figure 5: Spall mass (per hole) for the taconite hard rock
Figure 5: Spall mass (per hole) for the taconite hard rock
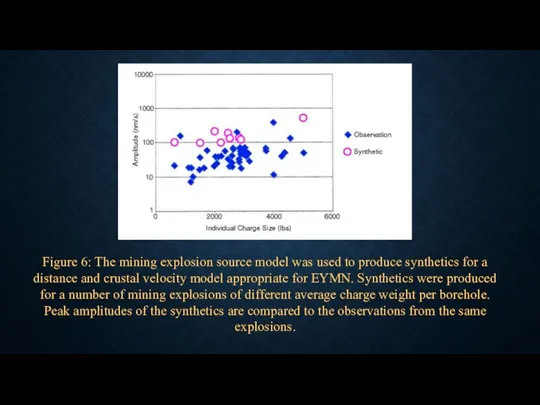
Figure 6: The mining explosion source model was used to produce
Figure 6: The mining explosion source model was used to produce
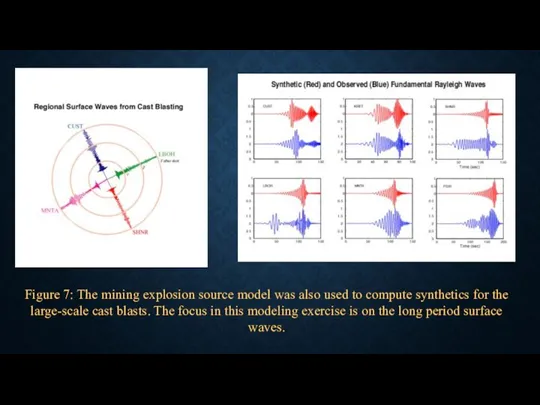
Figure 7: The mining explosion source model was also used to
Figure 7: The mining explosion source model was also used to
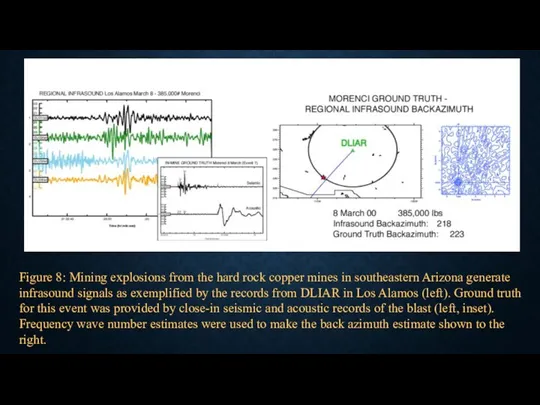
Figure 8: Mining explosions from the hard rock copper mines in
Figure 8: Mining explosions from the hard rock copper mines in
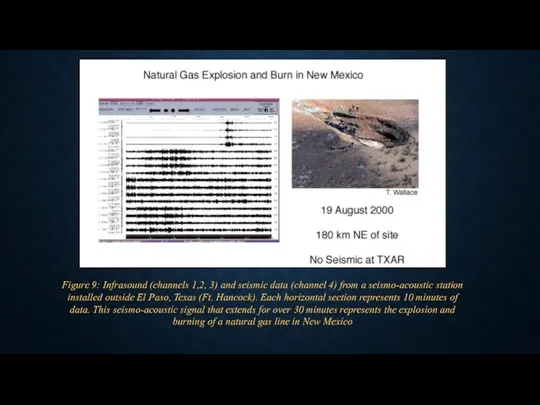
Figure 9: Infrasound (channels 1,2, 3) and seismic data (channel 4)
Figure 9: Infrasound (channels 1,2, 3) and seismic data (channel 4)
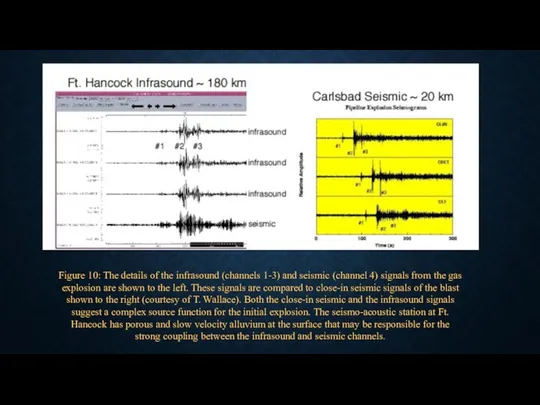
Figure 10: The details of the infrasound (channels 1-3) and seismic
Figure 10: The details of the infrasound (channels 1-3) and seismic
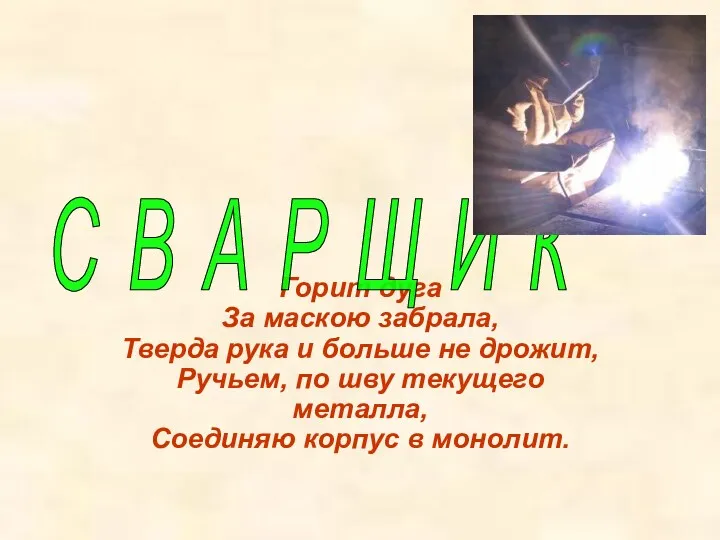 Занятие производственного обучения по профессии Сварщик
 Занятие в кружке Волшебный фарфор
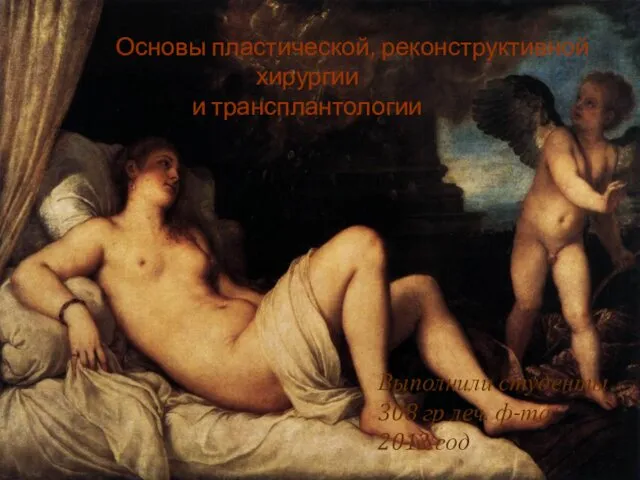 Пластическая хирургия
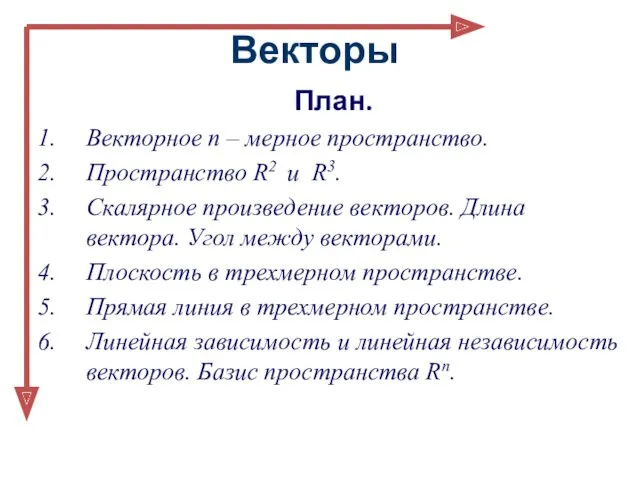 Векторы в пространстве
 Задание эссе
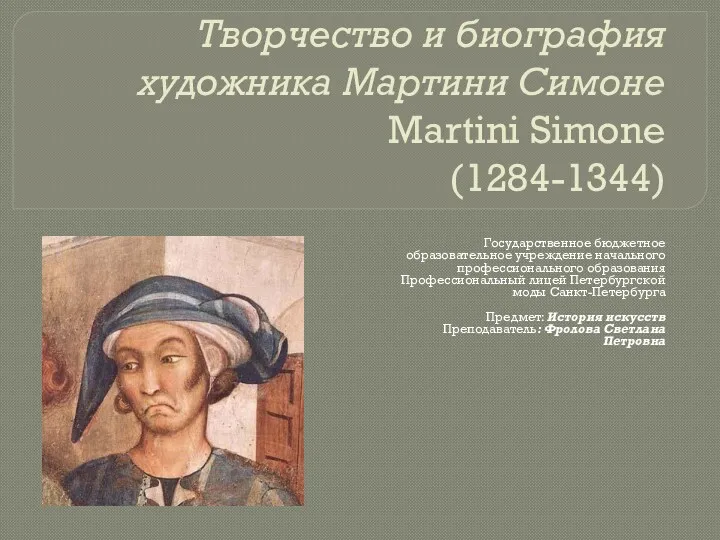 Творчество и биография художника Мартини Симоне Martini Simone (1284-1344)
 День света 15 декабря
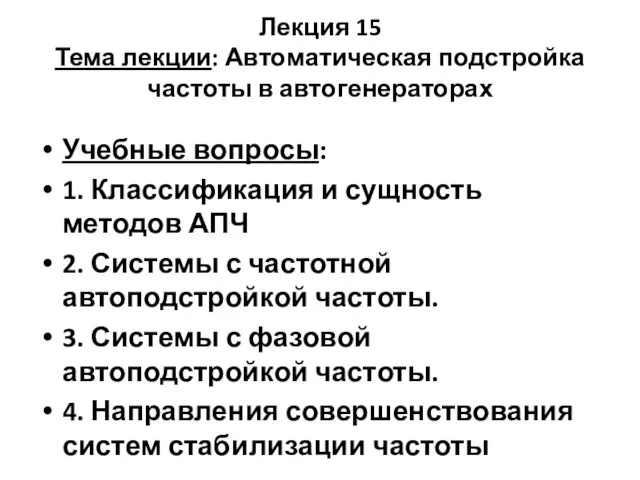 Автоматическая подстройка частоты в автогенераторах. Лекция 15
 ПРОТИВ курения
 Стратегии диверсификации
 Миры роботов. Тема 2. Виды роботов и будущее человечества
 Урок по химии в 9 классе Неметаллы
 Областные мероприятия для работающей молодежи
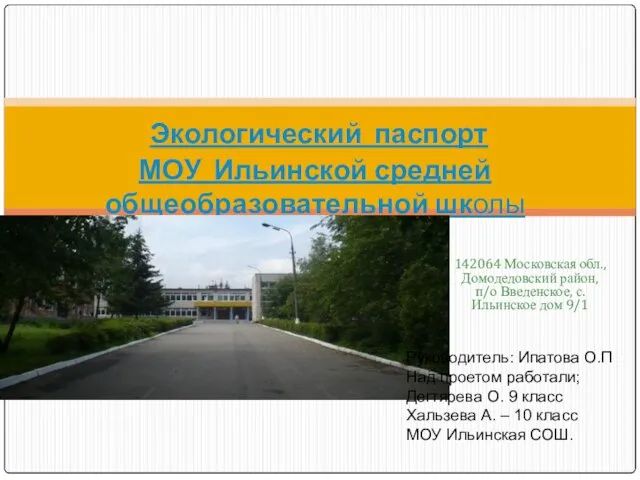 Экологический паспорт МОУ Ильинской средней общеобразовательной школы
 Астраханский государственный биосферный заповедник
 Федор Михайлович Достоевский Преступление и наказание. Основные причины преступления Родиона Раскольникова
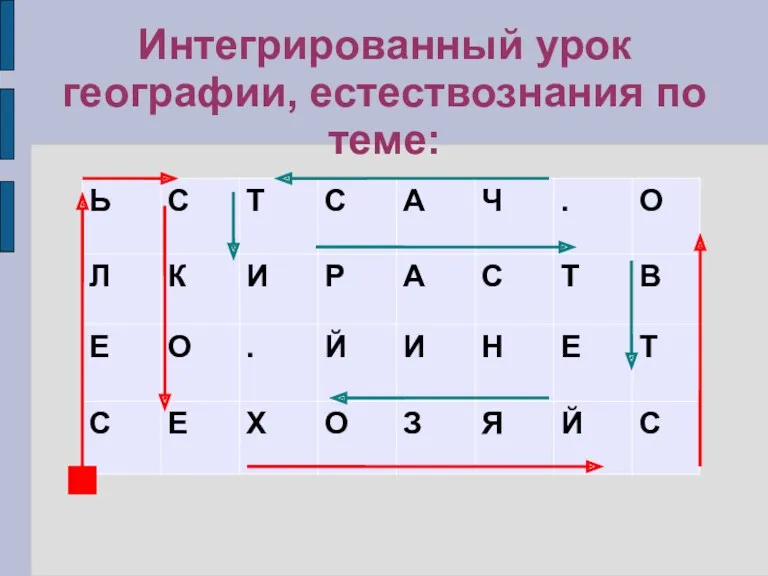 Интегрированный урок географии, естествознания
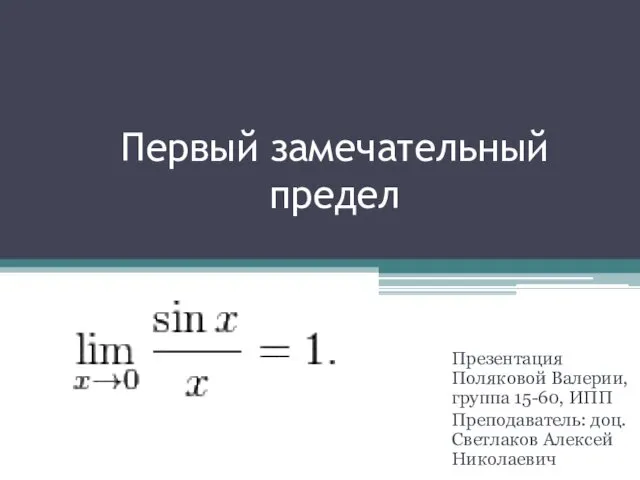 Первый замечательный предел
 Презентация кружка дополнительного образования Цветные ладошки.
 Строительная физика
 Современные методы утепления стен
 Анатомия и физиология сердца
 Определение кислотности почвы учебно-опытного участка Токаревской СОШ № 2
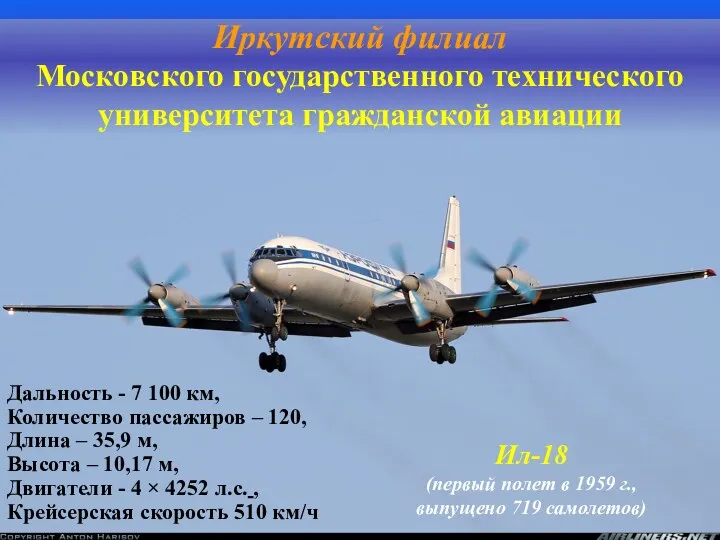 Авиационные двигатели и их системы управления. Основы устройства силовых установок и их конструкция
 Сплавы. 9 класс
 Прайс-лист. Только 100% натуральные ткани проверенных производителей
 Мөлдір күн панельдері
 Родительское собрание. Итоговое собеседование по русскому языку. 9 кл