- Визуальное моделирование и UML в Rose. (Тема 1)

Содержание
- 2. Where Are We? What is visual modeling? What is the UML? UML diagrams Extending UML notation
- 3. What Is Visual Modeling?
- 4. Visual Modeling Captures Business Processes Use-case analysis is a technique to capture business processes from a
- 5. Visual Modeling Is a Communication Tool
- 6. Visual Modeling Manages Complexity
- 7. Visual Modeling Promotes Reuse
- 8. Where Are We? What is visual modeling? What is the UML? UML diagrams Extending UML notation
- 9. What Is the Unified Modeling Language? The UML is the standard language for visualizing, specifying, constructing,
- 10. History of the UML
- 11. UML Concepts The UML may be used to visually model The interaction of your application with
- 12. Where Are We? What is visual modeling? What is the UML? UML diagrams Extending UML notation
- 13. Use-Case Diagram A use-case diagram is created to visualize the interaction of your system with the
- 14. An activity diagram shows the flow of events within our system. Activity Diagram Create curriculum [
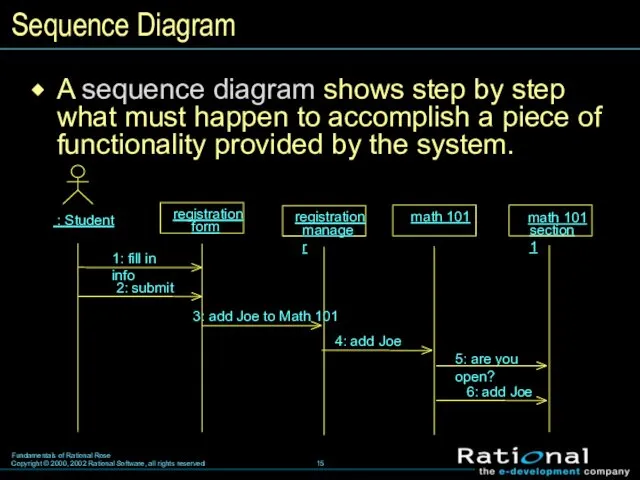
- 15. Sequence Diagram : Student A sequence diagram shows step by step what must happen to accomplish
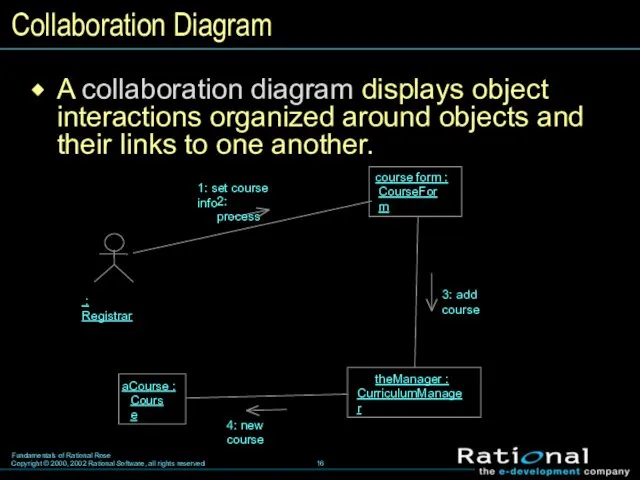
- 16. Collaboration Diagram A collaboration diagram displays object interactions organized around objects and their links to one
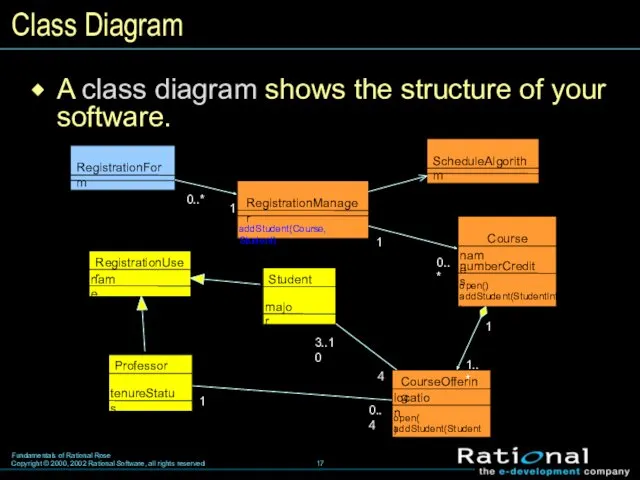
- 17. Class Diagram A class diagram shows the structure of your software.
- 18. Statechart Diagram A statechart diagram shows the lifecycle of a single class.
- 19. Component Diagram A component diagram illustrates the organization and dependencies among software components.
- 20. Deployment Diagram A deployment diagram visualizes the distribution of components across the enterprise.
- 21. Where Are We? What is visual modeling? What is the UML? UML diagrams Extending UML notation
- 22. Extending the UML Stereotypes can be used to extend the UML notational elements. Stereotypes may be
- 24. Скачать презентацию
Where Are We?
What is visual modeling?
What is the UML?
UML diagrams
Extending UML
Where Are We?
What is visual modeling?
What is the UML?
UML diagrams
Extending UML
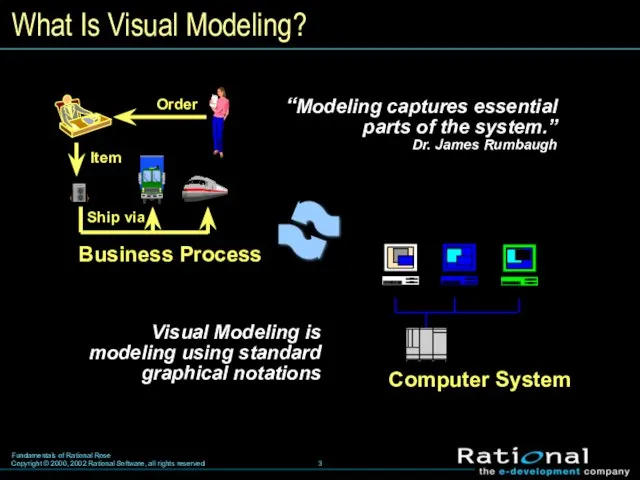
What Is Visual Modeling?
What Is Visual Modeling?
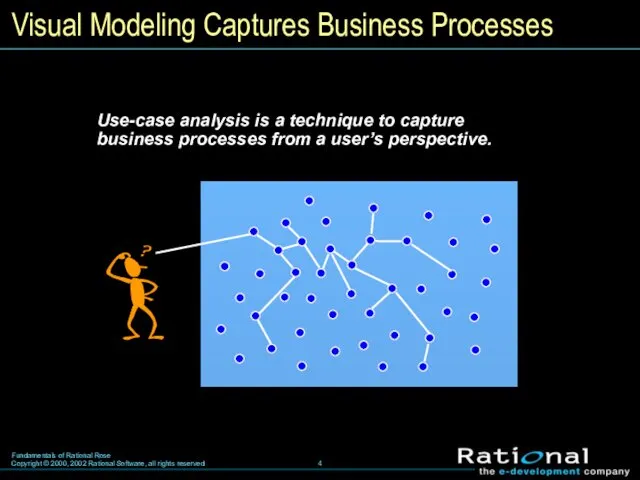
Visual Modeling Captures Business Processes
Use-case analysis is a technique to capture
Visual Modeling Captures Business Processes
Use-case analysis is a technique to capture
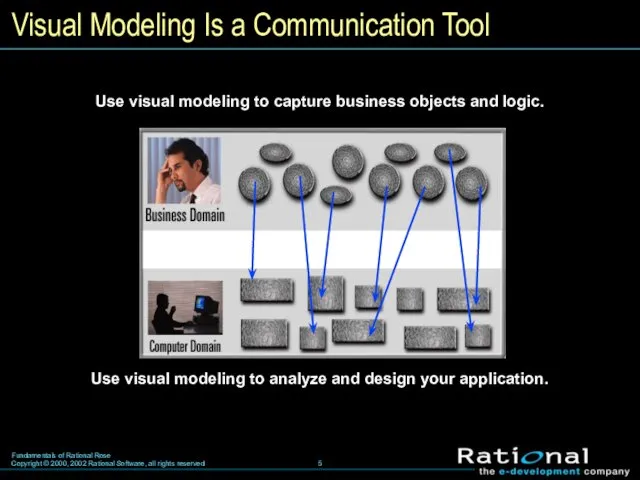
Visual Modeling Is a Communication Tool
Visual Modeling Is a Communication Tool
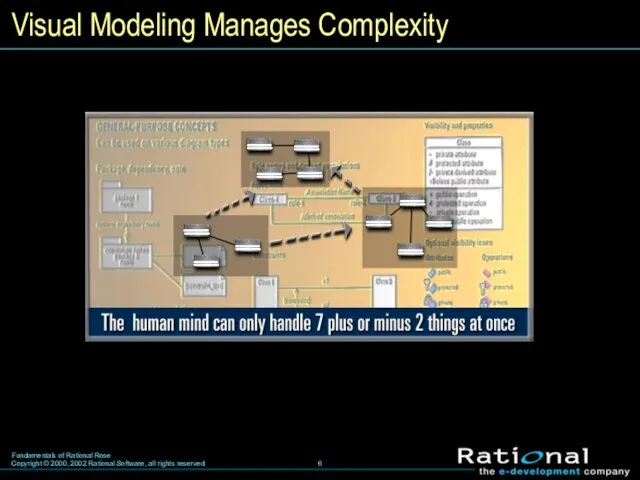
Visual Modeling Manages Complexity
Visual Modeling Manages Complexity
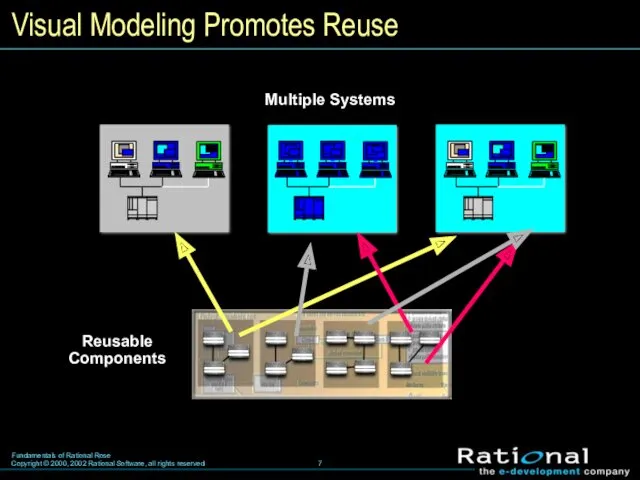
Visual Modeling Promotes Reuse
Visual Modeling Promotes Reuse
Where Are We?
What is visual modeling?
What is the UML?
UML diagrams
Extending UML
Where Are We?
What is visual modeling?
What is the UML?
UML diagrams
Extending UML
What Is the Unified Modeling Language?
The UML is the standard language
What Is the Unified Modeling Language?
The UML is the standard language
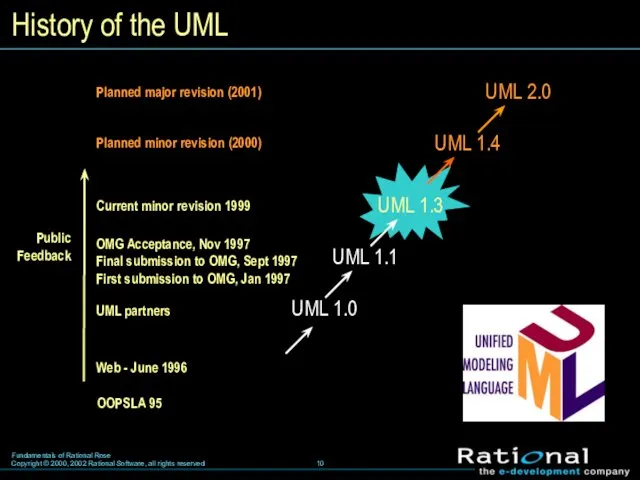
History of the UML
History of the UML
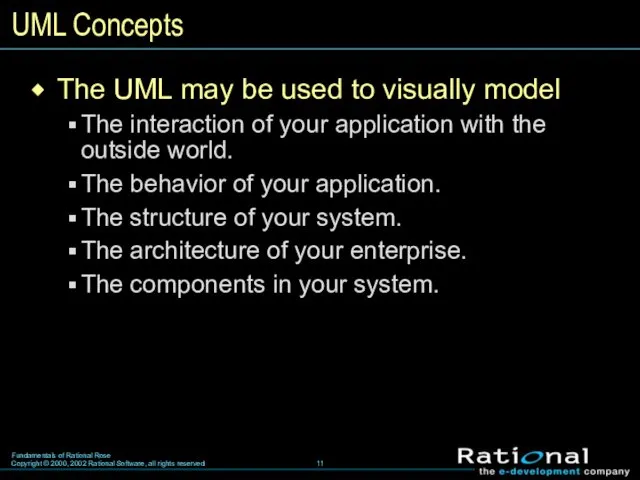
UML Concepts
The UML may be used to visually model
The interaction of
UML Concepts
The UML may be used to visually model
The interaction of
Where Are We?
What is visual modeling?
What is the UML?
UML diagrams
Extending UML
Where Are We?
What is visual modeling?
What is the UML?
UML diagrams
Extending UML
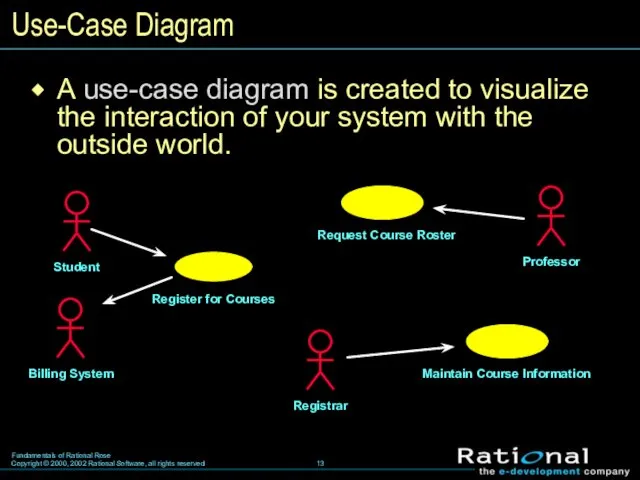
Use-Case Diagram
A use-case diagram is created to visualize the interaction of
Use-Case Diagram
A use-case diagram is created to visualize the interaction of
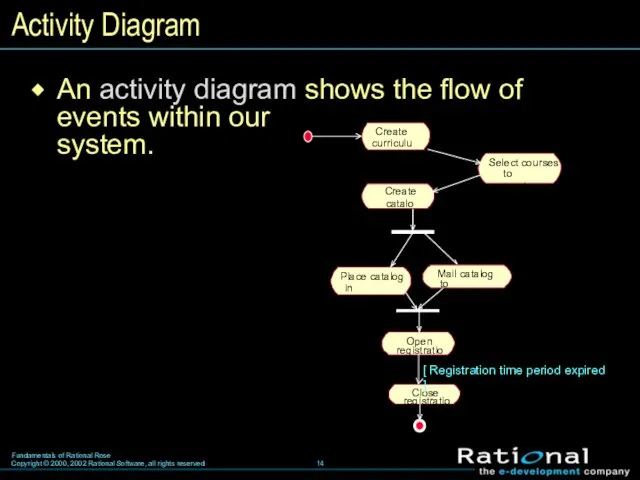
An activity diagram shows the flow of
events within our
system.
Activity
An activity diagram shows the flow of
events within our
system.
Activity
Sequence Diagram
: Student
A sequence diagram shows step by step what
Sequence Diagram
: Student
A sequence diagram shows step by step what
Collaboration Diagram
A collaboration diagram displays object interactions organized around objects and
Collaboration Diagram
A collaboration diagram displays object interactions organized around objects and
Class Diagram
A class diagram shows the structure of your software.
Class Diagram
A class diagram shows the structure of your software.
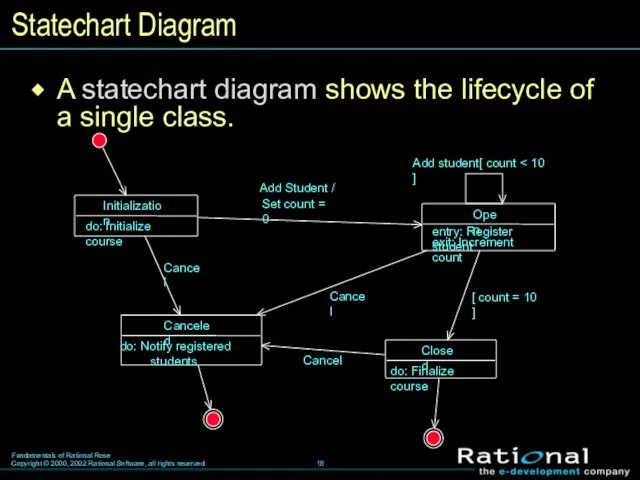
Statechart Diagram
A statechart diagram shows the lifecycle of a single class.
Statechart Diagram
A statechart diagram shows the lifecycle of a single class.
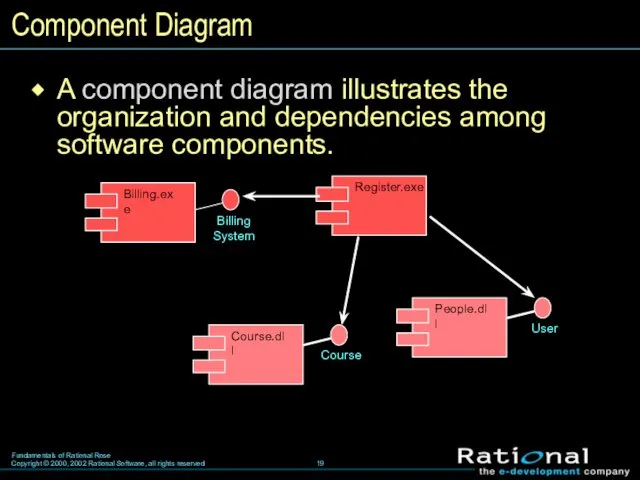
Component Diagram
A component diagram illustrates the organization and dependencies among software
Component Diagram
A component diagram illustrates the organization and dependencies among software
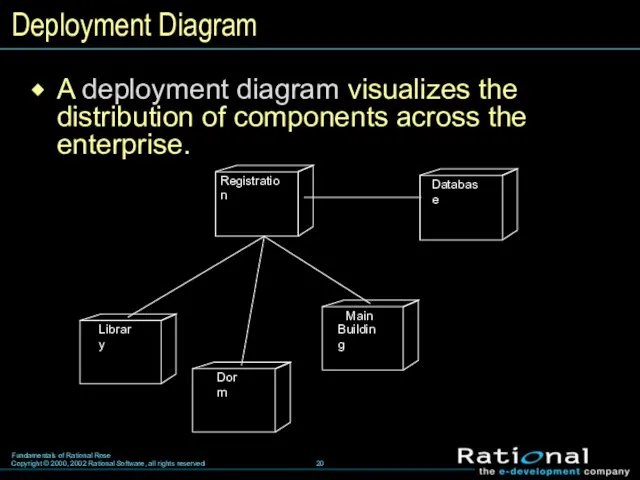
Deployment Diagram
A deployment diagram visualizes the distribution of components across the
Deployment Diagram
A deployment diagram visualizes the distribution of components across the
Where Are We?
What is visual modeling?
What is the UML?
UML diagrams
Extending UML
Where Are We?
What is visual modeling?
What is the UML?
UML diagrams
Extending UML
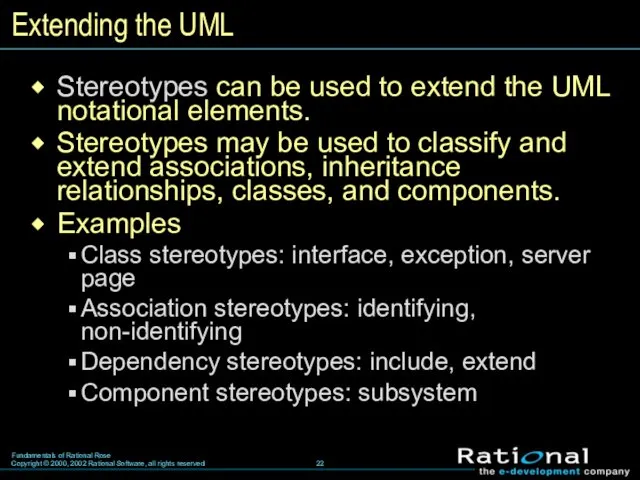
Extending the UML
Stereotypes can be used to extend the UML notational
Extending the UML
Stereotypes can be used to extend the UML notational
 Николай Семёнович Лесков
 презентация Речевые игры как средство развития творческого потенциала младших школьников с нарушениями речи
 Лоскутное шитьё Декоративно-прикладное искусство
 Место дидактических игр в познавательно-речевом развитии дошкольников
 Основы JavaScript. Объекты, функции. Рекурсия
 Елочка из сена
 Плевриты. Легочная гипертензия
 Аппликация из опилок
 Презентация Притча о маме
 Качество заканчивания скважин
 l-i-kuzmin
 Медико-тактическая характеристика зон радиоактивного заражения при авариях на радиационно опасных объектах
 Класифікація кормів. Зелені, грубі та концентровані корми
 Аттестация педагогических работников организаций, осуществляющих образовательную деятельность
 Использование игровых технологий
 Введение в предмет “Религиоведение”
 Сухие строительные смеси ГЕРКУЛЕС. Штукатурки
 Алгоритм построения чертежа детали, представленного двумя видами
 Презентация Химические средства гигиены и косметики
 Изменения в правовом регулировании деятельности учреждений
 Города воинской славы!
 Слюсарна справа
 Отряд ЮИД в ДОУ
 The integrative management complex for formation of the model of a modern specialist
 Презентация Географическое положение Северной Америки
 Презентация Мышление и его роль в профессиональном самоопределении личности
 Дидактическое пособие по воспитанию сенсорной культуры детей дошкольного возраста Кукла Маруся
 Викторина по математике:Виват, математика!