- Well logging

Содержание
- 2. What is well logging? Well logging, also known as borehole logging is the practice of making
- 3. How is well logging done? Wireline logging is performed by lowering a 'logging tool' - or
- 5. History of Well Logging Conrad and Marcel Schlumberger, who founded Schlumberger Limited in 1926, are considered
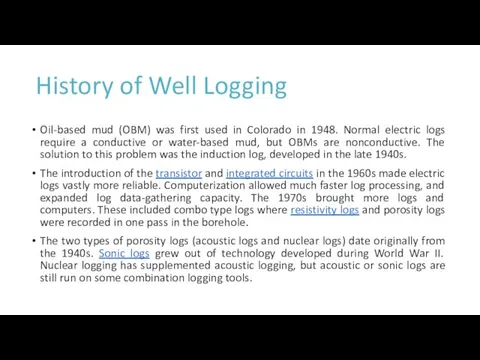
- 6. History of Well Logging Oil-based mud (OBM) was first used in Colorado in 1948. Normal electric
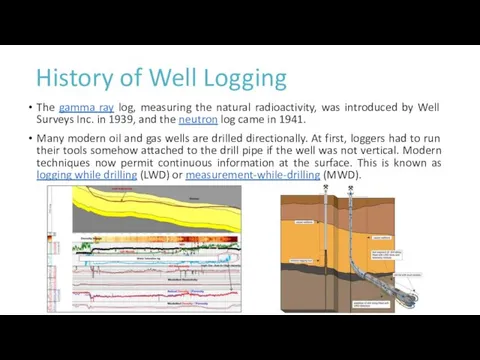
- 7. History of Well Logging The gamma ray log, measuring the natural radioactivity, was introduced by Well
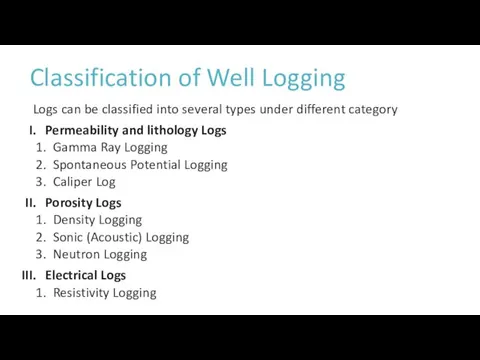
- 8. Classification of Well Logging Logs can be classified into several types under different category Permeability and
- 9. Permeability and Lithology Logs
- 10. Gamma Ray Logging (GR) Gamma Rays are high-energy electromagnetic waves which are emitted by atomic nuclei
- 11. Spontaneous Potential Logging The spontaneous potential (SP) curve records the naturally occurring electrical potential (voltage) produced
- 12. Caliper Log The logging system provides a continuous recording of borehole diameter versus depth. Can be
- 13. Porosity Logs
- 14. Density Logging The formation density log is a porosity log that measures electron density of a
- 15. Sonic (Acoustic) Log Acoustic tools measure the speed of sound waves in subsurface formations. While the
- 16. Neutron Logging The Neutron Log is primarily used to evaluate formation porosity, but the fact that
- 17. Electrical Logs
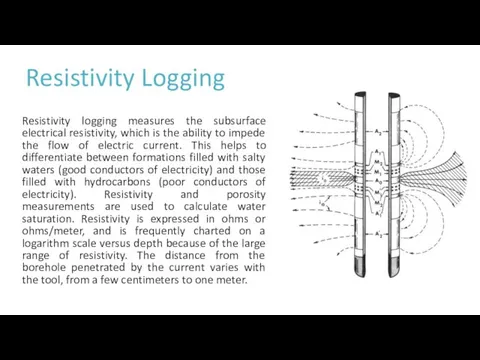
- 18. Resistivity Logging Resistivity logging measures the subsurface electrical resistivity, which is the ability to impede the
- 19. During logging, a current is produced within a formation and the formation’s response to the current
- 22. Скачать презентацию
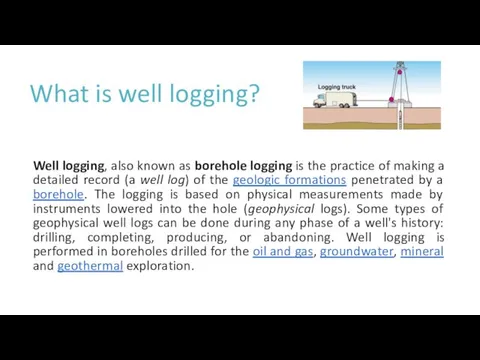
What is well logging?
Well logging, also known as borehole logging is
What is well logging?
Well logging, also known as borehole logging is
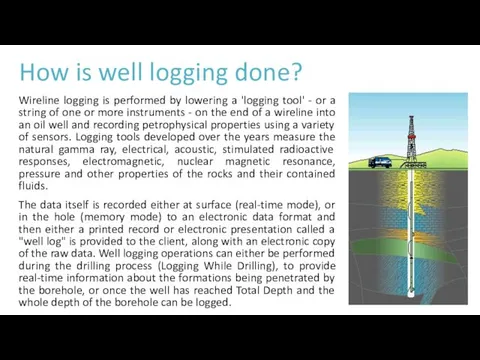
How is well logging done?
Wireline logging is performed by lowering a
How is well logging done?
Wireline logging is performed by lowering a
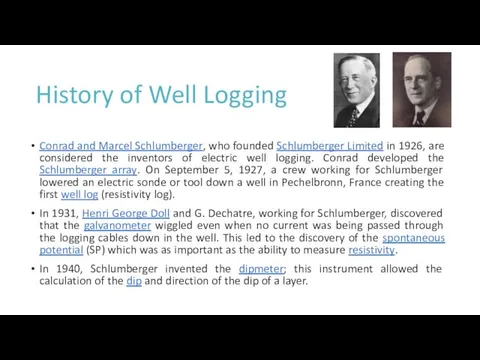
History of Well Logging
Conrad and Marcel Schlumberger, who founded Schlumberger Limited
History of Well Logging
Conrad and Marcel Schlumberger, who founded Schlumberger Limited
History of Well Logging
Oil-based mud (OBM) was first used in Colorado
History of Well Logging
Oil-based mud (OBM) was first used in Colorado
History of Well Logging
The gamma ray log, measuring the natural radioactivity,
History of Well Logging
The gamma ray log, measuring the natural radioactivity,
Classification of Well Logging
Logs can be classified into several types under
Classification of Well Logging
Logs can be classified into several types under
Permeability and Lithology Logs
Permeability and Lithology Logs
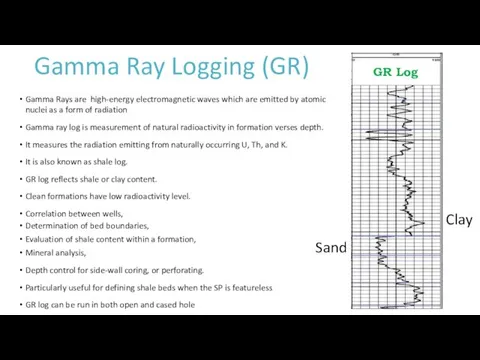
Gamma Ray Logging (GR)
Gamma Rays are high-energy electromagnetic waves which are
Gamma Ray Logging (GR)
Gamma Rays are high-energy electromagnetic waves which are
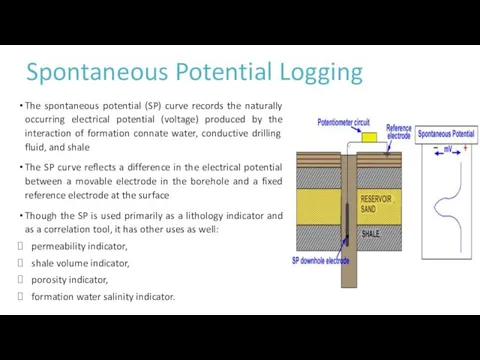
Spontaneous Potential Logging
The spontaneous potential (SP) curve records the naturally occurring
Spontaneous Potential Logging
The spontaneous potential (SP) curve records the naturally occurring
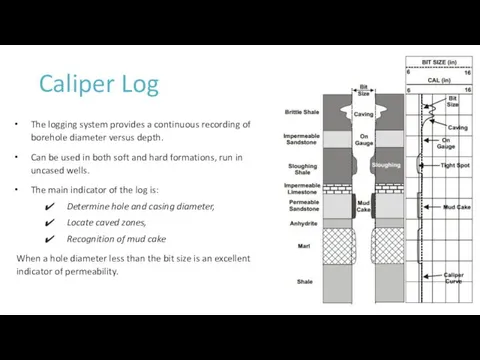
Caliper Log
The logging system provides a continuous recording of borehole diameter
Caliper Log
The logging system provides a continuous recording of borehole diameter
Porosity Logs
Porosity Logs
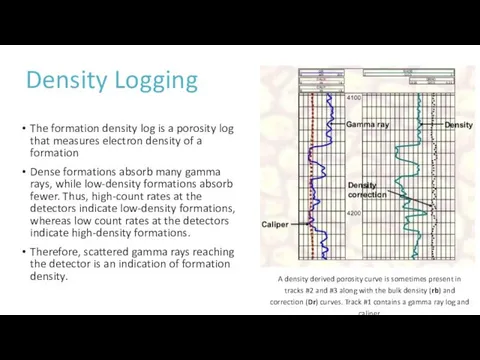
Density Logging
The formation density log is a porosity log that measures
Density Logging
The formation density log is a porosity log that measures
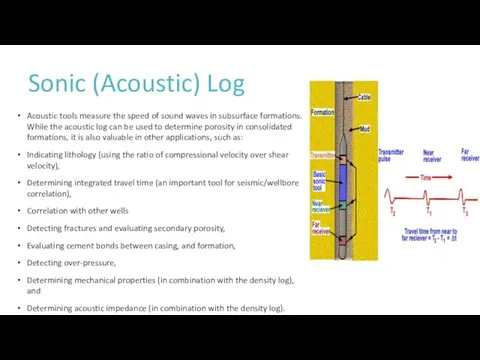
Sonic (Acoustic) Log
Acoustic tools measure the speed of sound waves in
Sonic (Acoustic) Log
Acoustic tools measure the speed of sound waves in
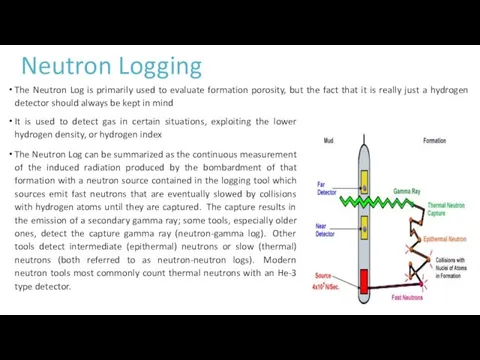
Neutron Logging
The Neutron Log is primarily used to evaluate formation porosity,
Neutron Logging
The Neutron Log is primarily used to evaluate formation porosity,
Electrical Logs
Electrical Logs
Resistivity Logging
Resistivity logging measures the subsurface electrical resistivity, which is the
Resistivity Logging
Resistivity logging measures the subsurface electrical resistivity, which is the
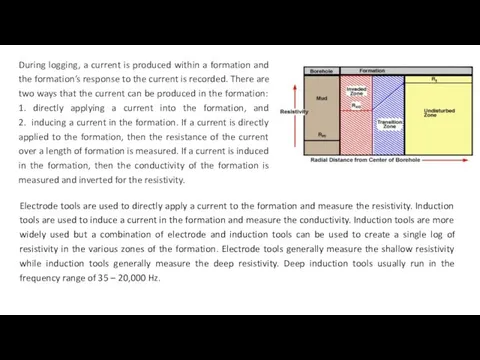
During logging, a current is produced within a formation and the
During logging, a current is produced within a formation and the
 Презентация. Не спешите срывать первоцветы. В рамках проекта Оставьте цветы весне
 Методы сбора и обработки данных при помощи Python. Урок 5
 Дифференциация звуков Ж-Ш в слогах, словах и предложениях.
 Презентация к аттестации
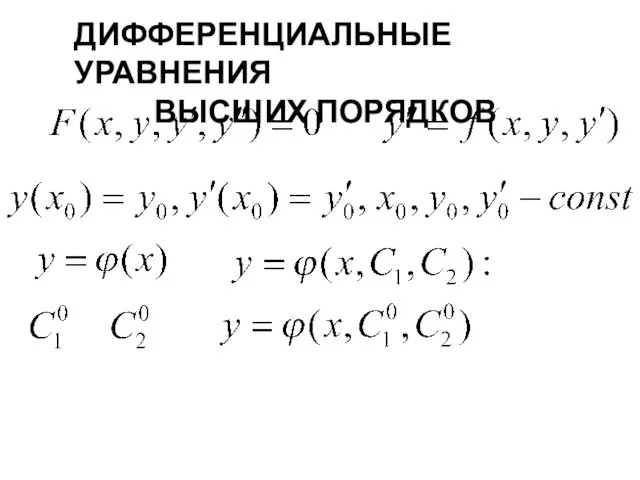 Дифференциальные уравнения высших порядков
 Политические партии и движения
 Художественный фильм режиссёра Франко Дзеффирелли Ромео и Джульетта
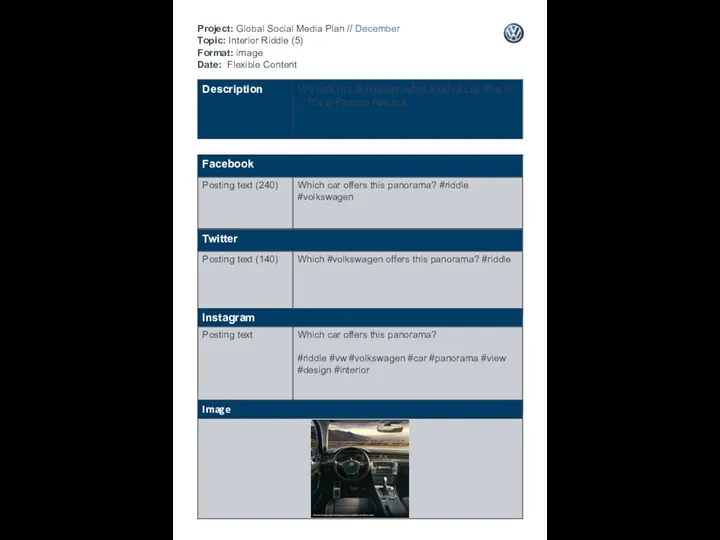 Interior 5
 Религия: понятия и виды
 Ударение. Распредели слова в 3 столбика
 Трёхфазные электрические цепи Соединение треугольником. Лекция 7
 Презентация по химии Д.И.Менделеев
 Острый респираторный дистресс-синдром при вирусных поражениях легких
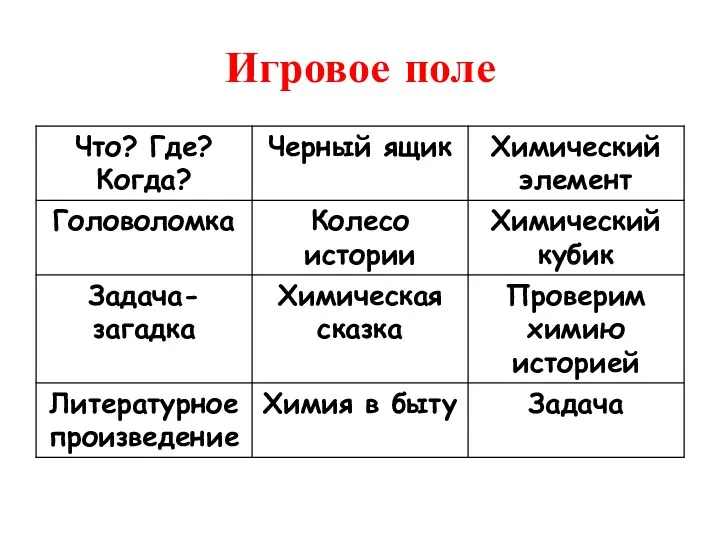 презентация к внеклассному мероприятию в 9 классе
 Рождественская звезда
 Книги - юбиляры 2018 года. Отечественные авторы
 Передающие среды
 Произведения искусства на сюжеты Библии. Произведения искусства на сюжеты Нового Завета
 Внутренняя политика Петра I
 Задачи и организационная структура Всероссийской службы медицины катастроф
 Презентация пректа Интеллектуальный журнал для детей и родителей Занимательные игры
 проект
 Халықаралық жария құқық субъектілері
 День Конституции
 Регулирование территориальных сетевых организаций
 Все про рок и электрогитары
 Частотные методы анализа показателей качества
 Криптоспоридиозы животных и человека