- Economy of Russia

Содержание
- 2. GDP per capita 1000 – 2000, international $, log.scale 2
- 3. Attempt to reconstruct the world economy dynamics 3
- 4. Economic history quest: Malthusian trap Source: http://krugman.blogs.nytimes.com/2009/07/01/the-malthusian-insult/comment-page-4/?_r=0 (taken from Brad de Long) 4
- 5. Development rates of countries differ Environment: tropics, moderate, North, heath, islands and remote areas Primary states
- 6. Legal Systems of the World Source: stolen from Wikipedia 6
- 7. The Great Divergence China, India, Japan, Arabs were helpless against Turkey and Europe in XV-XVI cent.
- 8. Key problems of the Russian history Millennium+ with no peace, regular wars… Big wars – Borders
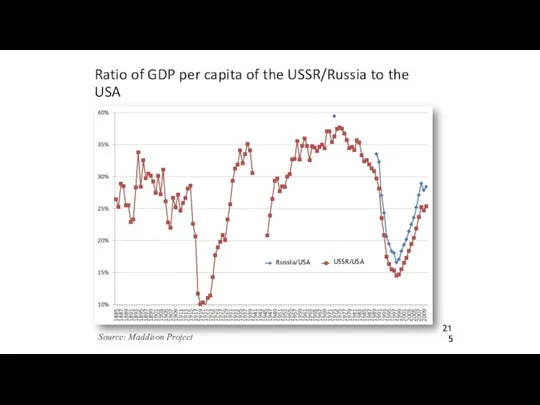
- 9. Ratio of GDP per capita of the USSR/Russia to the USA Russia/USA USSR/USA
- 10. Problems at the end of the 1980s. Growth in different countries became stable, living standards were
- 11. Moscow princedom, 1533 (in red) Moscow – Central Federal Region, 2013 (green borders)
- 12. History – till 1533 Russian elites – “driving under influence”: Normans since VIII century, Byzantium since
- 13. History – 1533- 1991 (1) 1533 – turning point for enlarging – post Saint Bartholomew massacre
- 14. History – 1533- 1991 (2) WWI and Romanov’s Crush, Revolution out of mainstream; Purges and industrialization
- 15. Remaining European empires Empires were established by ”cool” adventurers followed by boyars and Streltsy Old empires
- 16. Договора Руси с Византией, 860… 912 Нестор - В Повести временных лет об этом договоре сказано:
- 17. Договора Руси с Византией, 860… 912 Русско-византийский договор (907-912). Заключен после успешного похода на Константинополь князя
- 18. 1533 – 1917, 1991 – the Big Bang Ivan the “Terrible”: Siberia – Baltic and South
- 19. Empire is what it is By A.N. Kuropatkin, the Nikolai II Minister of War count, there
- 20. What exactly has to be transformed during a country transition? The most crucial thing is property
- 21. How deals on territorial changes are hold Potential elites and legitimacy Negotiations, elites` interests Arrangements (referendums
- 22. Might the development and transformation issues be resolved? Goals of the transformation: democracy and market economy
- 23. Difficulties and losses of the transitional period boost phobias: Foreign capital as a threat Corruption omnipotence
- 24. …and utopias: Ideal policy exists Governance instead of initiative All-purpose instruments Sudden leaps for no reason
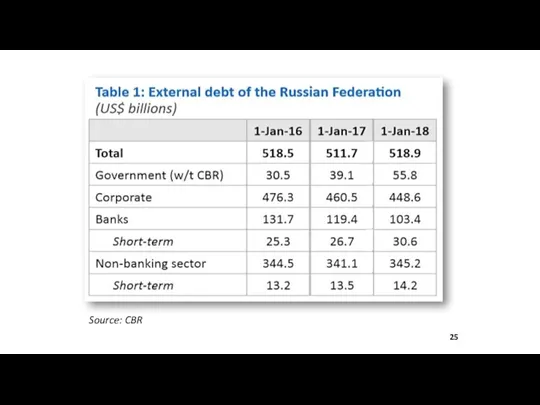
- 25. What did Russia obtained after the collapse? Territory – more than 80% and natural resources Population
- 26. Dynamics of GDP per capita PPP (2011 prices) and population of EAEU countries), 1990-2016 * Including
- 27. Death, birth and natural increase in Russia, 1960-2015s 27
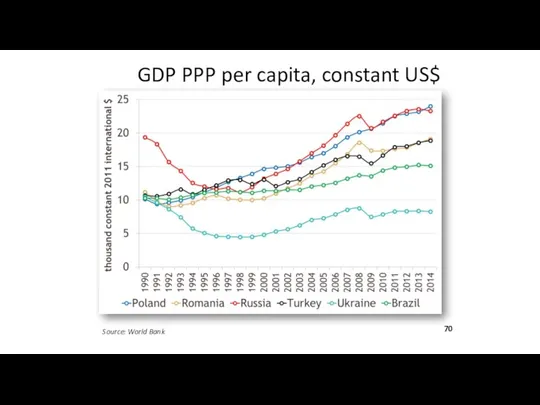
- 28. Source: World Bank GDP PPP per capita, constant US$
- 29. Key topics – crush of 1990-s GDP = minus 43%, jump in Suicides and Murders Failure
- 30. Russia: GDP level, Suicide and Homicide, qtr., s.a. 2006-2015
- 31. Russians speaking English and Russian & the Internet access
- 32. Society after 1/4 Century of Transition Current Russian Socio-economic realty is the result partly of Soviet
- 33. Key topics – Cold war in minds of Elites Russians never lost Cold War, better forget
- 34. Trap of the middle level development? The «500 days» program 1990; attempts of 1991; IMF and
- 35. Leonid Grigoryev – some publications Elites - the Choice for Modernization in “Russia: the Challenges of
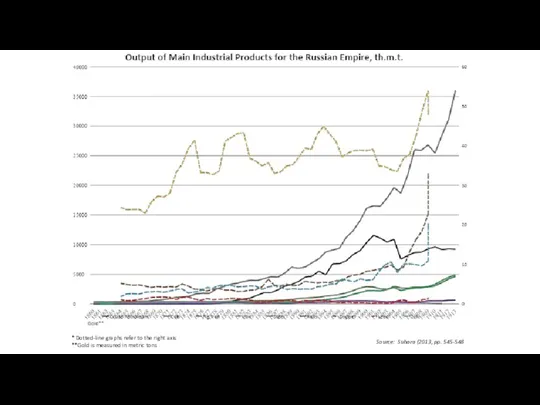
- 36. * Dotted-line graphs refer to the right axis **Gold is measured in metric tons Source: Suhara
- 37. Source: Maddison 2007, p. 379, table A.4
- 38. Literature, basic: 1. Mau V., Drobyshevskaya T. "Modernization and the Russian Economy: Three Hundred Years of
- 39. Transformations of 1917-2018 (ideology, ownership, country’s configuration) and objective reasons for problems. 21.01.2019 Professor Leonid Grigoryev,
- 40. Topics for discussion: Russian in 1913 – Development V Institutions European politics and WWI WWI –
- 41. History Millennium+ with no peace, regular invasions Normans, Byzantium, Nomads before Mongols Big wars – Borders
- 42. The Empire Map
- 43. Periods of Russian History in XX-XXI C Tsar Nikolai II – till 1917 Revolution and Civil
- 44. Source: Maddison 2007, p. 379, table A.4
- 45. * Dotted-line graphs refer to the right axis **Gold is measured in metric tons Source: Suhara
- 46. Real national income per head, 1913 to 1927/28: year-on-year percent change on Soviet territory and at
- 47. Postwar recovery: The GDPs of selected Eurasian countries in 1928, percent of 1913 31 Source: Markevich
- 48. European Empires and Unions Empires were established by ”cool” adventurers followed by “Boyars and Streltsy” =
- 49. Russian and Soviet economic and demographic losses in four crises Source: Markevich A., Harrison M. Great
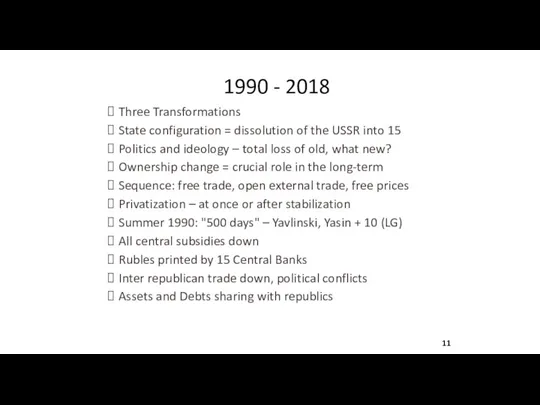
- 50. 1990 - 2018 Three Transformations: State configuration Politics and ideology Ownership Steps of 1992: free trade,
- 51. Source: World Bank GDP PPP per capita, constant US$
- 52. Source: World Bank Economic history quest: Growth of transition economies. 1990 – 2017,GDP PPP per capita,
- 53. Key topics – crush of 1990-s GDP = minus 43%, jump in Suicides and Murders Failure
- 54. What did Russia obtain after the collapse? Territory – more than 80% and natural resources Population
- 55. Russia key indicators, growth for the period,% Source: Rosstat
- 56. GDP, Industry production and Gross Fixed Capital Production, 1961-2007 Source: Rosstat, CSU USSR, IEF calculations
- 57. GDP (2000=100), military and R&D expenditures, oil extraction and prices
- 58. Russia: GDP level, Suicide and Homicide rates, 1989-2010
- 59. Russia: GDP level, Suicide and Homicide, qtr., s.a.2006-2015
- 60. Consumer Expenditure on Durable Goods, US$, Current Prices, 2000-2015 Source: Euromonitor
- 61. Society after 1/4 Century of Transition Current Russian Socio-economic realty is the result partly of Soviet
- 62. Key topics – Cold war in minds of Elites Russians never lost Cold War, better forget
- 63. Military expenditure, in constant (2015) US$ Source: SIPR, 2017I
- 64. Russians know English and Russian & got access
- 65. Logic of this Presentation Objective problem of Russian history and institutions with limited information and prejudices
- 66. Ratio of GDP per capita of the USSR/Russia to the USA Russia/USA USSR/USA
- 67. Literature: “Transition to Market Economy” (in collaboration), Moscow, 1990, a.k.a. "500 days. Transition to the Market",
- 68. Russia - transformations of 1990-2018 Privatization and Ownership and corporate governance "Even God cannot change the
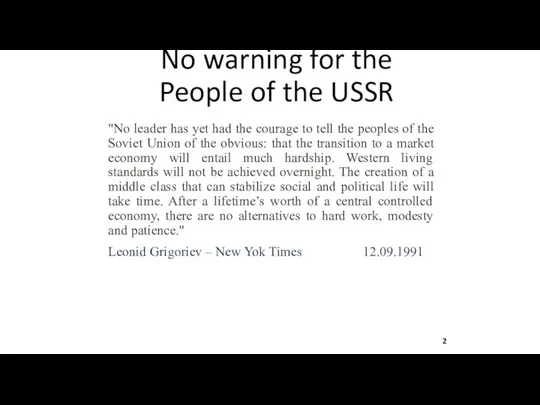
- 69. No warning for the People of the USSR "No leader has yet had the courage to
- 70. Source: World Bank GDP PPP per capita, constant US$
- 71. Russia key indicators, growth for the period,% Source: Rosstat
- 72. Key topics – crush of 1990-s GDP = minus 43%, jump in Suicides and Murders Failure
- 73. Transformation Debates 1987-1992 1987 – "ECO" = 70 years since 1917; Aganbegian, Kornai, Gaidar, Yasin –
- 74. "Soviets need a unified Free Economy" (1/2) Leonid Grigoriev – New York Times: 12 Sept. 1991
- 75. "Soviets need a unified Free Economy" (2/2) Leonid Grigoriev – New York Times: 12 Sept. 1991
- 76. Global Choice of privatization To privatize: Lands, houses, infrastructure, firms, natural resources, financial assets, human capital
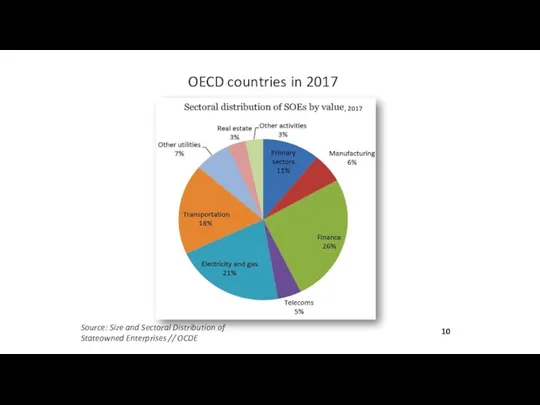
- 77. OECD countries in 2017 Source: Size and Sectoral Distribution of Stateowned Enterprises // OCDE 10
- 78. 1990 - 2018 Three Transformations State configuration = dissolution of the USSR into 15 Politics and
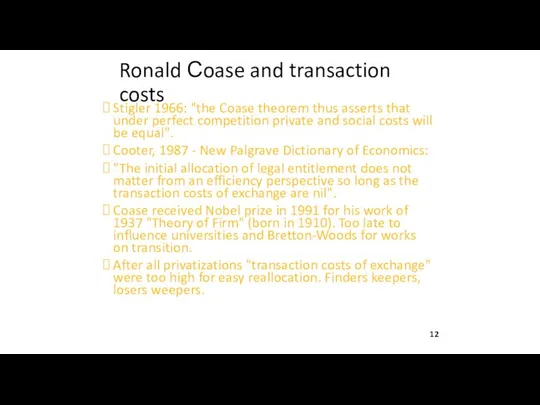
- 79. Ronald Сoase and transaction costs Stigler 1966: "the Coase theorem thus asserts that under perfect competition
- 80. Bundle of Rights – Honore 1961 – Ownership (1/2) (1) The Right to Possess: The right
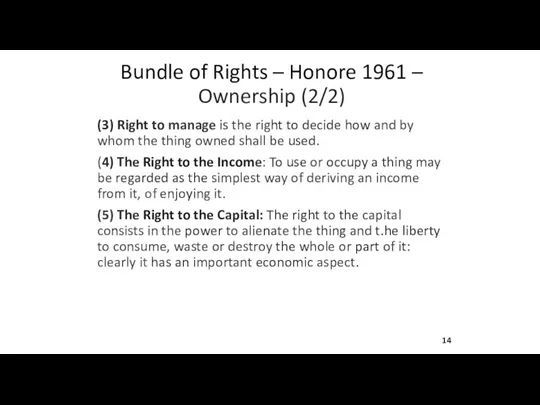
- 81. Bundle of Rights – Honore 1961 – Ownership (2/2) (3) Right to manage is the right
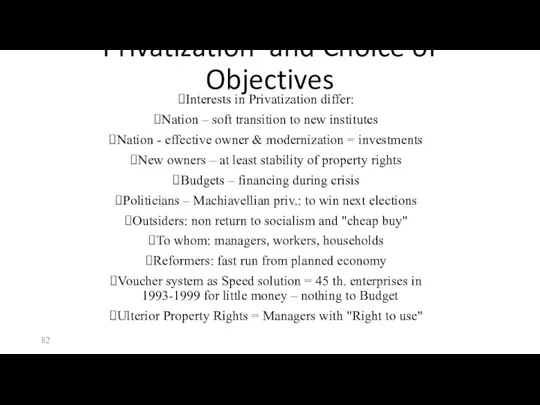
- 82. Privatization and Choice of Objectives Interests in Privatization differ: Nation – soft transition to new institutes
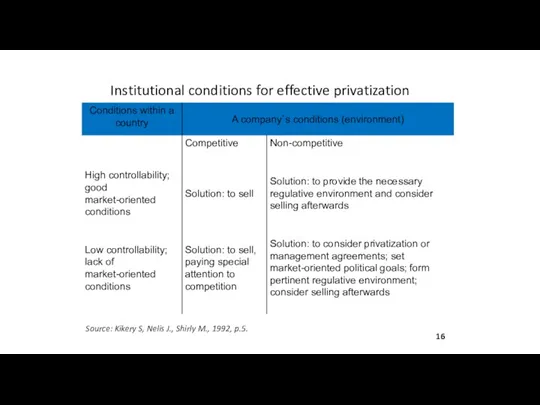
- 83. Institutional conditions for effective privatization Source: Kikery S, Nelis J., Shirly M., 1992, p.5. 16
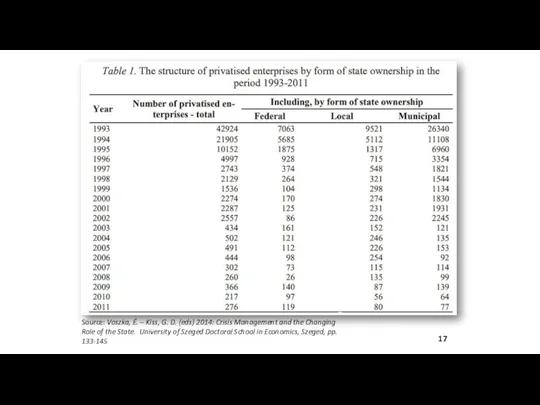
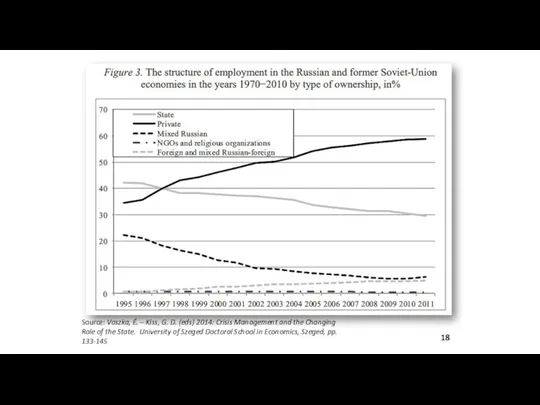
- 84. 17 Source: Voszka, É. – Kiss, G. D. (eds) 2014: Crisis Management and the Changing Role
- 85. Source: Voszka, É. – Kiss, G. D. (eds) 2014: Crisis Management and the Changing Role of
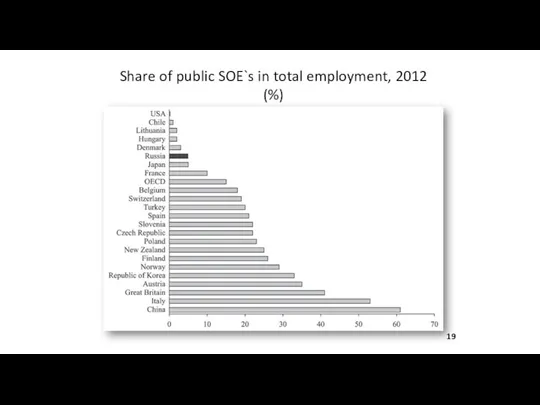
- 86. Share of public SOE`s in total employment, 2012 (%) 19
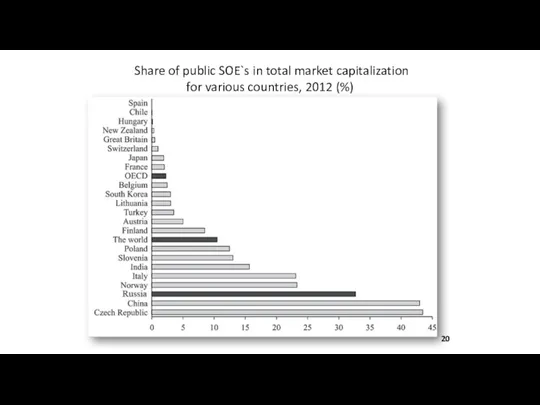
- 87. Share of public SOE`s in total market capitalization for various countries, 2012 (%) 20
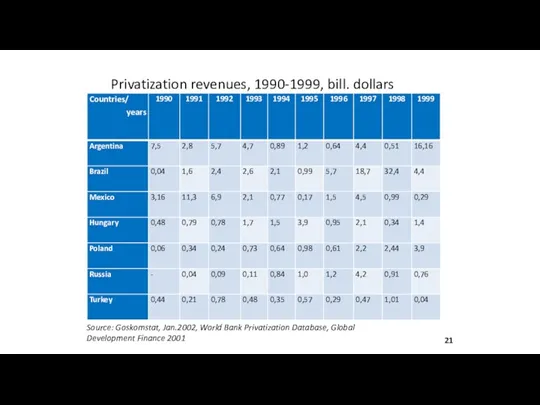
- 88. Privatization revenues, 1990-1999, bill. dollars Source: Goskomstat, Jan.2002, World Bank Privatization Database, Global Development Finance 2001
- 89. Outcome of privatization in Russia Politicians and Reformers may believe in their decisions But actual results
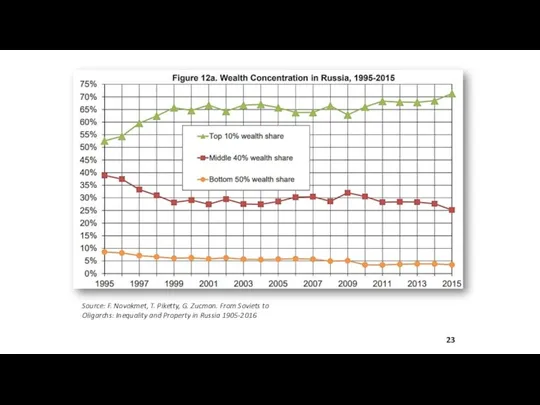
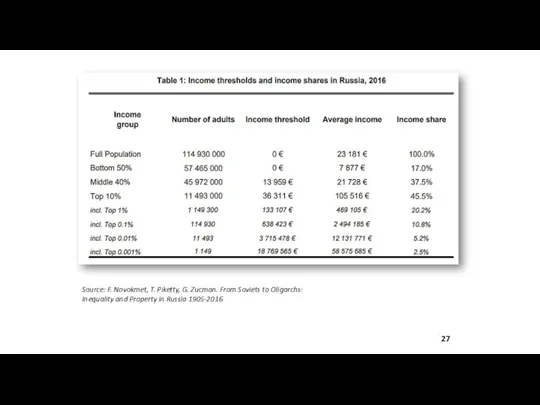
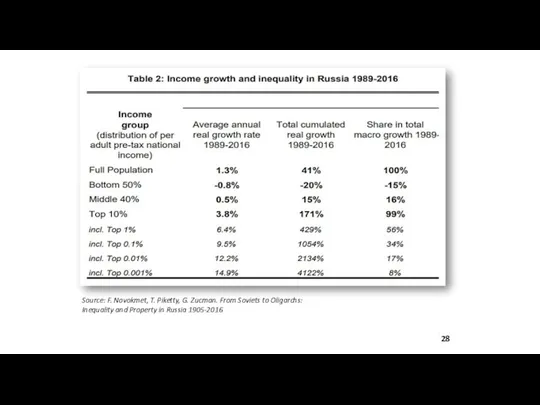
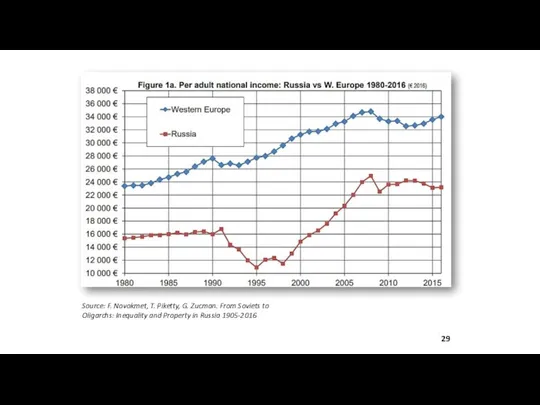
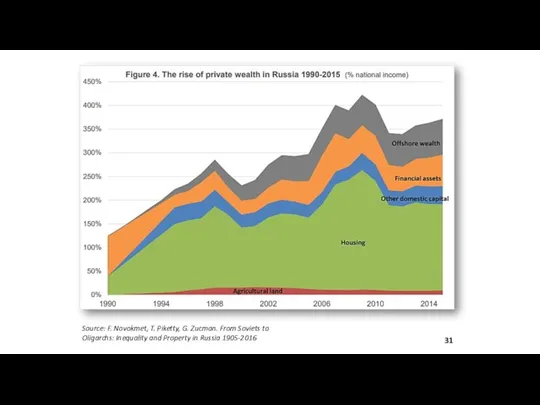
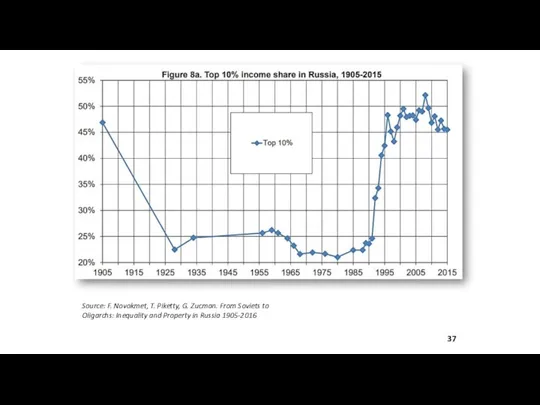
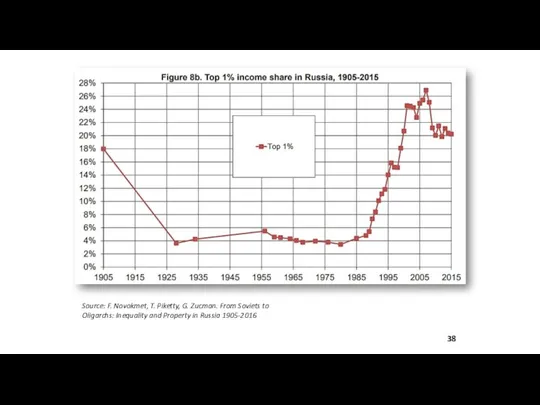
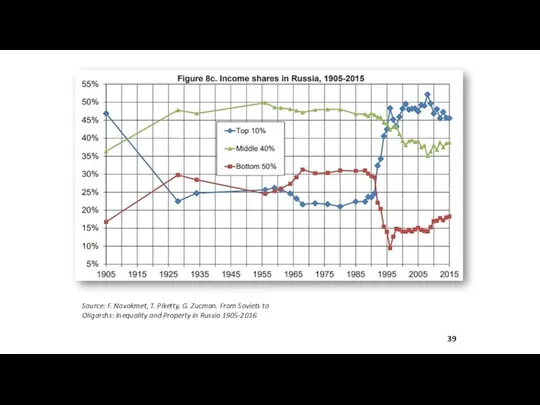
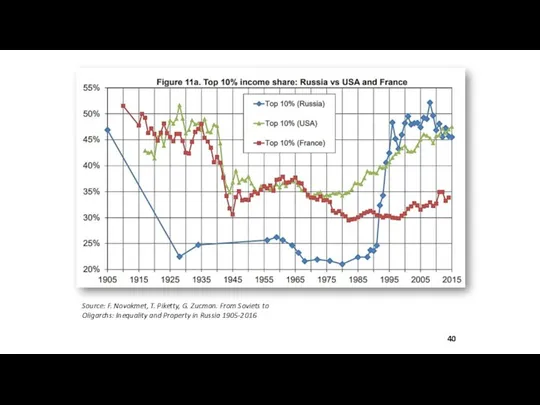
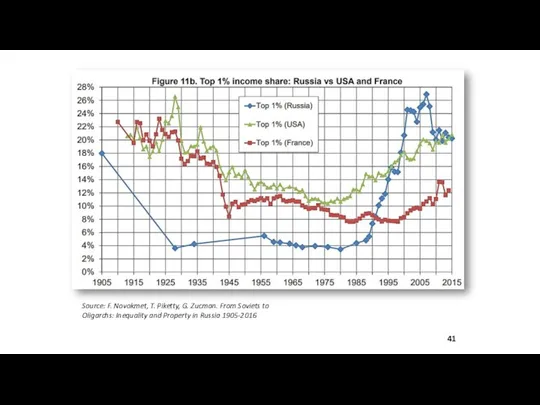
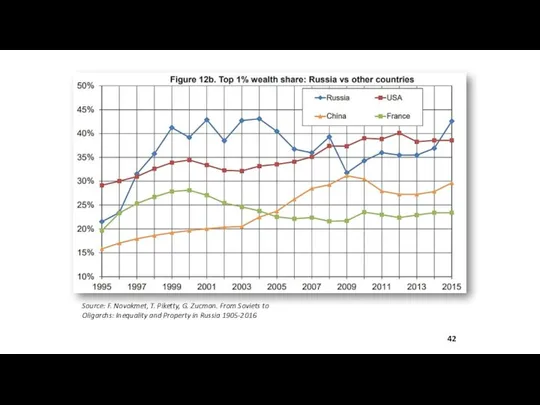
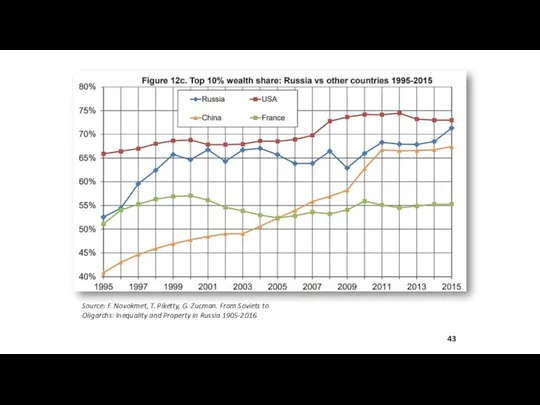
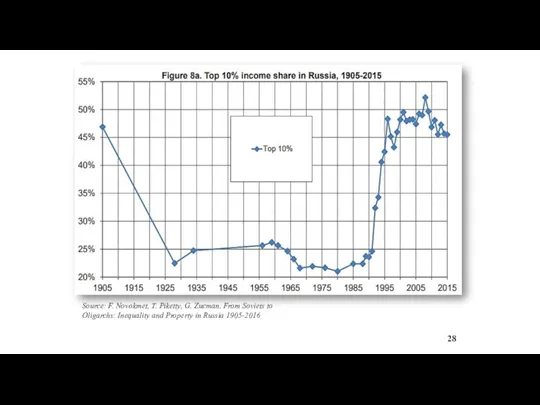
- 90. Source: F. Novokmet, T. Piketty, G. Zucman. From Soviets to Oligarchs: Inequality and Property in Russia
- 91. SOE shares among countries’ top ten firms (%), 2013 Source: State-owned enterprises in the global economy
- 92. Source: GlobalEconomy https://www.theglobaleconomy.com/rankings/herit_property_rights/ Measures the degree to which a government enforces private property protection laws and
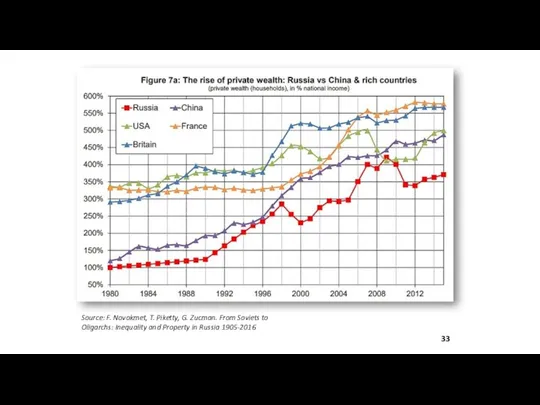
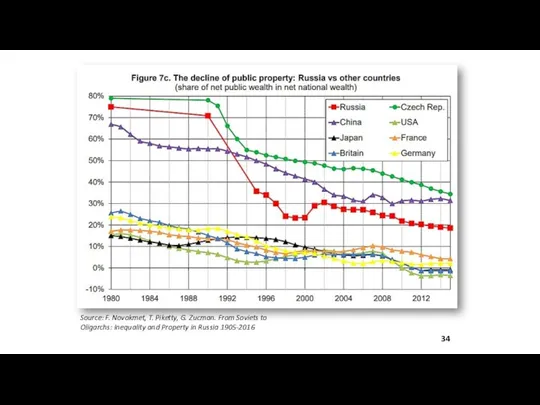
- 93. Calculations of Piketty and Co Russia made its way to high concentration of Property in 1993-1996
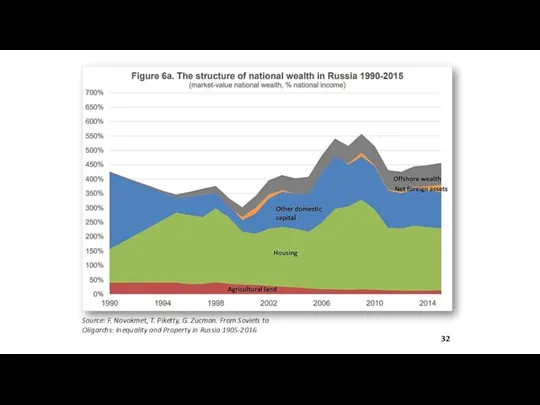
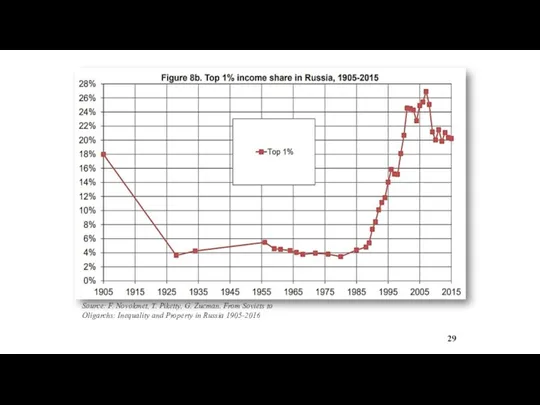
- 94. Source: F. Novokmet, T. Piketty, G. Zucman. From Soviets to Oligarchs: Inequality and Property in Russia
- 95. Source: F. Novokmet, T. Piketty, G. Zucman. From Soviets to Oligarchs: Inequality and Property in Russia
- 96. Source: F. Novokmet, T. Piketty, G. Zucman. From Soviets to Oligarchs: Inequality and Property in Russia
- 97. Source: F. Novokmet, T. Piketty, G. Zucman. From Soviets to Oligarchs: Inequality and Property in Russia
- 98. Source: F. Novokmet, T. Piketty, G. Zucman. From Soviets to Oligarchs: Inequality and Property in Russia
- 99. Source: F. Novokmet, T. Piketty, G. Zucman. From Soviets to Oligarchs: Inequality and Property in Russia
- 100. Source: F. Novokmet, T. Piketty, G. Zucman. From Soviets to Oligarchs: Inequality and Property in Russia
- 101. Source: F. Novokmet, T. Piketty, G. Zucman. From Soviets to Oligarchs: Inequality and Property in Russia
- 102. Byproducts of Wealth Distribution Inequality may be measured differently. Might have been a correct approach –
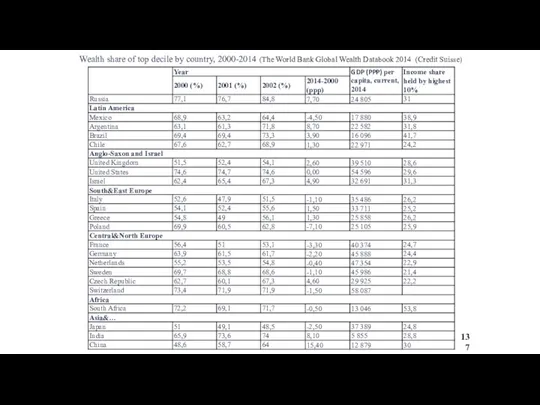
- 103. Source: The World Bank Global Wealth Databook 2014 (Credit Suisse) Wealth share of top decile by
- 104. Source: F. Novokmet, T. Piketty, G. Zucman. From Soviets to Oligarchs: Inequality and Property in Russia
- 105. Source: F. Novokmet, T. Piketty, G. Zucman. From Soviets to Oligarchs: Inequality and Property in Russia
- 106. Source: F. Novokmet, T. Piketty, G. Zucman. From Soviets to Oligarchs: Inequality and Property in Russia
- 107. Source: F. Novokmet, T. Piketty, G. Zucman. From Soviets to Oligarchs: Inequality and Property in Russia
- 108. Source: F. Novokmet, T. Piketty, G. Zucman. From Soviets to Oligarchs: Inequality and Property in Russia
- 109. Source: F. Novokmet, T. Piketty, G. Zucman. From Soviets to Oligarchs: Inequality and Property in Russia
- 110. Source: F. Novokmet, T. Piketty, G. Zucman. From Soviets to Oligarchs: Inequality and Property in Russia
- 111. Literature: Kornai Y. The Socialist System: The Political Economy of Communism. Oxford University Press, chapter 3,
- 112. Leonid Grigoryev – some publications Grigoryev L. "Ulterior Property Rights" (chapter) in "The Post-Soviet Economy". Edited
- 113. Global Structure Inequality: Income and Wealth (4.02. 2019) Tenured Professor Leonid Grigoryev Higher School of Economics,
- 114. Births, Deaths And Natural Increase Dynamics in Russia, 1960-2015 2
- 115. World Population and GDP in Various Dimensions, 1992–2016
- 116. Key points (1/2): Inequality between countries changes, Clusters go apart. Global economic growth has not changed
- 117. Key points (2/2): Domestic inequality is rigid, Growth is not changing distances for deciles. As we
- 118. Gini coefficient reflects mostly variation in rich deciles. Gini in comparison with IS -10th 6
- 119. Average and weighted average GDP per capita, PPP current prices (thousand USD and thousand int. dollars),
- 120. UN sustainable development goal №10. Reduce inequalities (1/2) Socio-economic parameters of various countries, 2000 and 2013/14
- 121. Income Inequality – International Comparison, 2014 or latest available
- 122. Personal Consumption in Selected Countries, 2016 Source: Euromonitor 10
- 123. Attitudes and Happiness Transformation has reduced expectations of state support. Not Russia is the center of
- 124. The degree of agreement of respondents with the statement “Government should reduce differences in income levels”
- 125. Level of life satisfaction in BRICS countries by income level, 1990-2014, % 13
- 126. Level of life satisfaction in BRICS countries, 1990-2014, % 14
- 127. Access to Internet, mobile phone and personal computer usage, % households, 2010, 2015 15
- 128. Russia: from quasi egalitarian to? Yasin’s work of 2010: only top 20% are better off to
- 129. Real cash income dynamics by 20% - income groups, 1991–2009 гг., % E.Yasin et all, 2011
- 130. Re-stratification of the society I could not find a study of the “navigation” of social groups
- 131. Seven Stratas of Society Upper class – income, rent, etc.: (1) Upper upper and (2) Lower
- 132. Russia: Middle class structure in 2000s (T. Maleva) 20
- 133. Dynamics of inequality in Russia (1/2) High social inequality in Russia has formed in the 1990s;
- 134. Dynamics of inequality in Russia (2/2) Share of income by 20-percent groups of population, % Source:
- 135. Transformation of society: features 10 years of economic decline (minus 43) lead to different cumulative degree
- 136. Income and Wealth Inequality Inequality has a long history – in Europe and in Asia. Estimated
- 137. Wealth share of top decile by country, 2000-2014 (The World Bank Global Wealth Databook 2014 (Credit
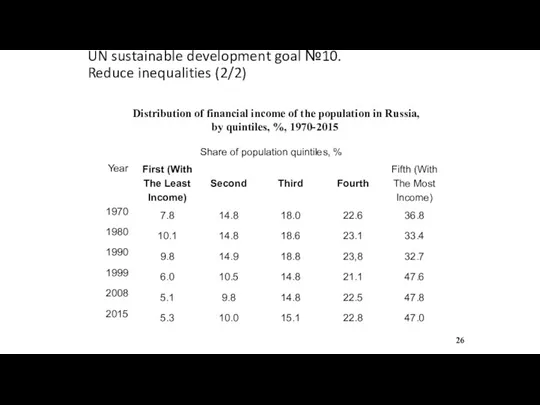
- 138. UN sustainable development goal №10. Reduce inequalities (2/2) Distribution of financial income of the population in
- 139. Source: F. Novokmet, T. Piketty, G. Zucman. From Soviets to Oligarchs: Inequality and Property in Russia
- 140. Source: F. Novokmet, T. Piketty, G. Zucman. From Soviets to Oligarchs: Inequality and Property in Russia
- 141. Source: F. Novokmet, T. Piketty, G. Zucman. From Soviets to Oligarchs: Inequality and Property in Russia
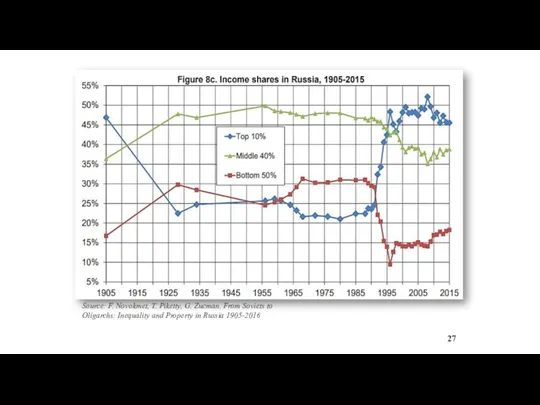
- 142. Conclusion: Russia Russia has made the detour from European income distribution to Latin American one. We
- 143. 31
- 144. Literature – 1 Atkinson Anthony “Inequality. What can be done?”, Cambridge, Harvard Un. Press, 2015. Grigoryev
- 145. Literature - 2 Григорьев Л.М, Павлюшина В.А. Социальное неравенство в мире и в России. Доклад о
- 146. Growth and Macro 11.02.2019 Professor Leonid Grigoryev HSE, Moscow www.leonidgrigoryev.com
- 147. Ratio of GDP per capita of the USSR/Russia to the USA Source: Maddison Project
- 148. Growth factors – long-run demand Infrastructure – roads and communications, Housing = new tendencies – two
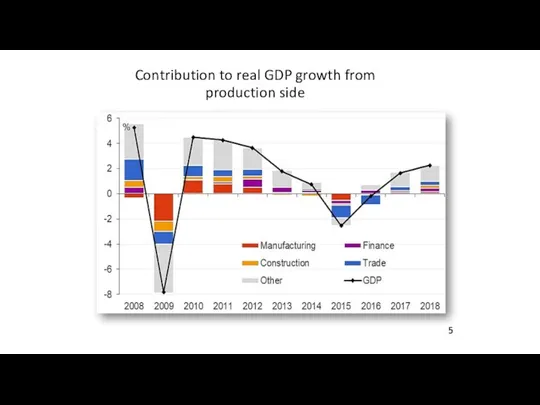
- 149. Contribution to real GDP growth from production side 4
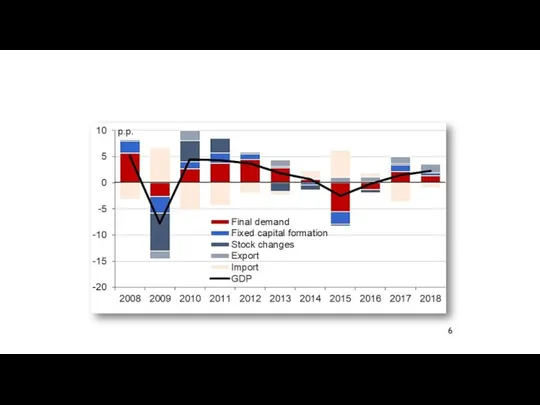
- 150. Contribution to real GDP growth from demand side 5
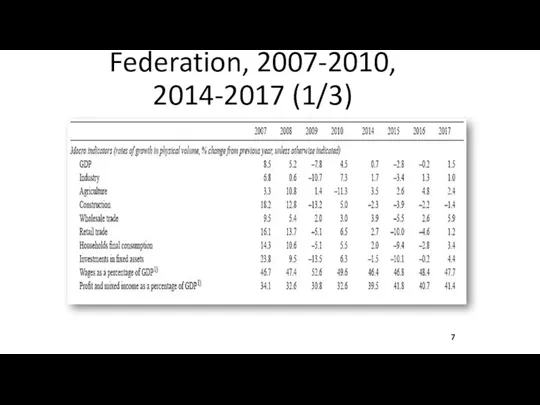
- 151. Main economic indicators of the Russian Federation, 2007-2010, 2014-2017 (1/4) 6
- 152. Main economic indicators of the Russian Federation, 2007-2010, 2014-2017 (2/4) 6
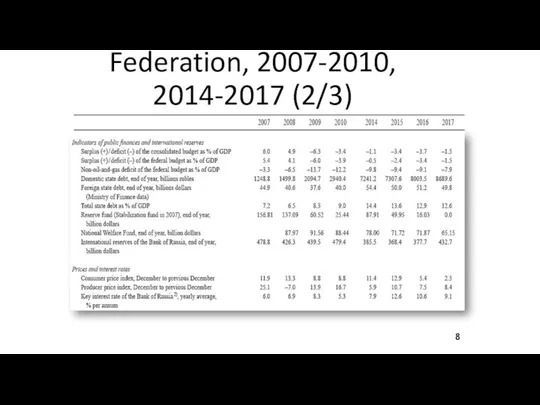
- 153. Main economic indicators of the Russian Federation, 2007-2010, 2014-2017 (3/4) 7
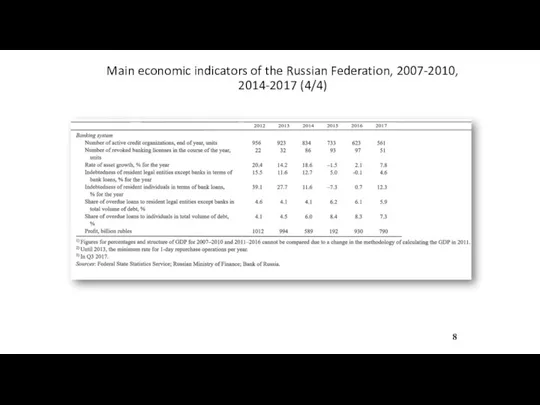
- 154. Main economic indicators of the Russian Federation, 2007-2010, 2014-2017 (4/4) 8
- 155. Russia key indicators, growth for the period, % Source: Rosstat
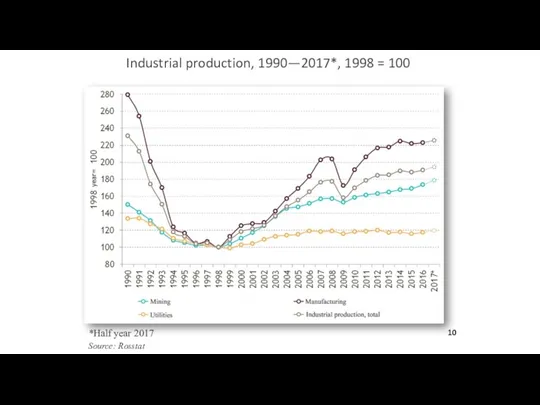
- 156. Industrial production, 1990—2017*, 1998 = 100 *Half year 2017 Source: Rosstat 10
- 157. Labour productivity growth rates in the world, the OECD region and emerging ,arkets and developing economies
- 158. Growth of labour productivity, capital deepening and TFP in the market sector of the Russian economy
- 159. Gross profit and wages as a percentage of GDP (right scale) 13
- 160. Percentage gap in GDP per worker in some Central and East Europe economies and Russia, arranged
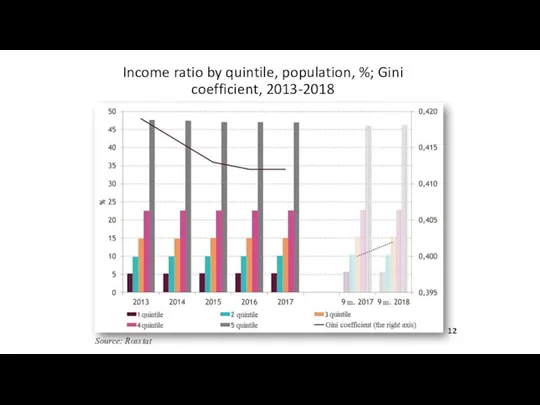
- 161. Income ratio by quintile, population, %; Gini coefficient, 2013-2018 Source: Rosstat 15
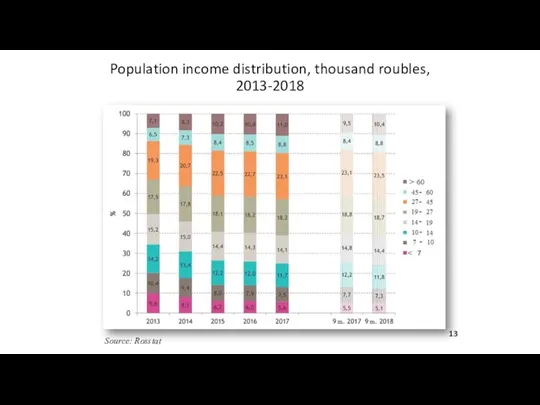
- 162. Population income distribution, thousand roubles, 2013-2018 Source: Rosstat 16
- 163. Personal consumption structure in Russia, 1990-2017 Source: Euromonitor 17
- 164. Real disposable income, real wages and consumer spending, 2012-2017 18
- 165. Key interest rates of the leading countries` Central banks, 2007–2017 Source — Thomson Reuters, Baker Hughes
- 166. Actual CPI and survey inflationary expectations, 2010-2017 (by November)
- 167. Federal Budget Expenditures
- 168. Foreign Trade Main Parameters 22
- 169. Military expenditure, in constant (2015) US$ Source: SIPR, 2017I
- 170. CPI, key interest rate CBR, ruble to $ rate and key % minus CPI 24
- 171. Share of households in possession of some household durables and gadgets in Russia, 1992-2017 Source: Euromonitor
- 172. Regional structure of the population and GRP (gross regional product) in Russia, 1990, 1997, 2007, 2015/2016
- 173. Retail sales 2015-2016, per capita by type of regions Source: Rosstat, Analytical center calculations
- 174. Share of non-food goods expenditures in consumer spending of Russian families by quintiles, 2013-2018 Source: Rosstat
- 175. Share of alcohol expenditures in consumer spendings of Russian families by quintiles, 2013-2018 Source: Rosstat 29
- 176. Total area, number of flats and mean flats` area in houses built by legal entities and
- 177. Recession and implications Recession is difficult for everybody Unofficial evaluations gave the loss of GDP to
- 178. Conclusion: Russia Russia has made the detour from European income distribution to Latin American one in
- 179. Literature: Voskoboynikov, I. "Sources of long run economic growth in Russia before and after the global
- 180. Professor Leonid Grigoryev www.leonidgrigoryev.com Economy & Energy 18.02.2019
- 181. Energy – history and theory Energy waves – replacement by efficiency, costs, for mass use of
- 182. Energy: history Source: A. Makarov, A. Makarov. Laws of Power Industry Development: Elusory Essence. Thermal Engineering,
- 183. Dynamics of the real prices for the key primary products 1901-2010, where 2007 = 100 Source:
- 184. Dynamics of the global energy consumption and GDP, 1971 - 2015 Source: IEA 5
- 185. GDP energy capacity: developed countries,1970 – 2016 Source: IEA
- 186. GDP energy capacity: developing countries,1971 - 2015 Source: IEA
- 187. Average per capita energy consumption, 1970 - 2016 Source: IEA
- 188. Comparison of the prices for different fuels, 2000 – 2016, $ / barrels of oil equivalent
- 189. The Structure of World Energy Consumption, 1971 and 2015, % total consumption Source: IEA
- 190. Primary energy demand by fuel (in 2015 and increase by 2040), Probable Scenario Source: Global and
- 191. Geopolitics & Rational Changes Growth and Energy consumption Embargo of Arab OPEC 1973 and Fear of
- 192. World GDP and Trade Growth rate, %, 1995‑2018 Source: IMF, WEO April 2017 Edition
- 193. Carbon Dioxide Emissions, 1985-2017 Source: BP Stat. Review 2017
- 194. Geopolitics steps over trade, development and Global problems’ solutions World is losing stability but keeps talking
- 195. GDP and Primary Energy Consumption, annual growth rates, 1991 - 2017 Source: World Bank, BP
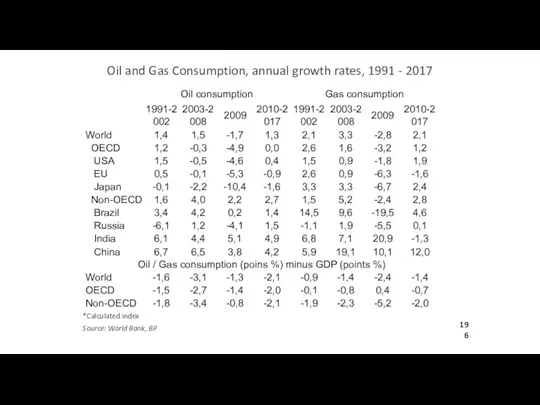
- 196. Oil and Gas Consumption, annual growth rates, 1991 - 2017 Source: World Bank, BP *Calculated index
- 197. Coal consumption and Electricity generation, annual growth rates, 1991 - 2017 Source: World Bank, BP *Calculated
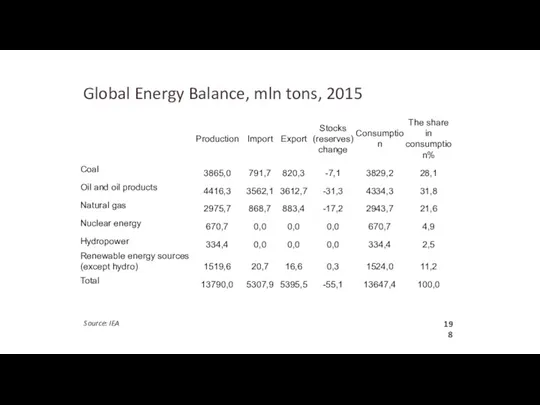
- 198. Global Energy Balance, mln tons, 2015 Source: IEA
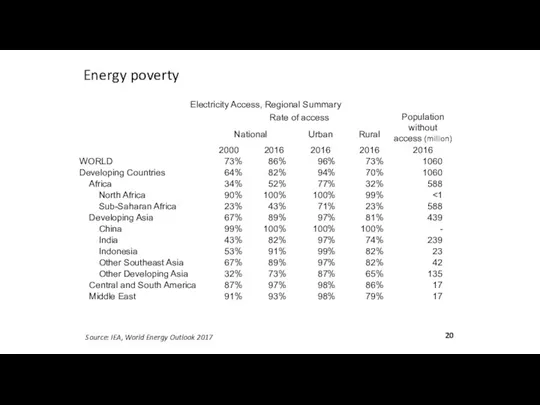
- 199. Energy poverty Source: IEA, World Energy Outlook 2017 20
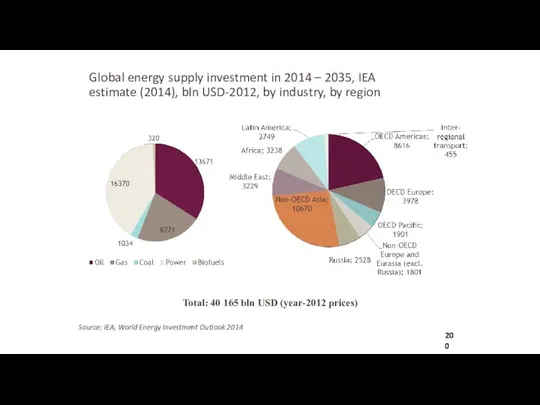
- 200. Global energy supply investment in 2014 – 2035, IEA estimate (2014), bln USD-2012, by industry, by
- 201. Example of interfuel substitution Source:IEA 22
- 202. OPEC & RUSSIA
- 203. Export Incomes in OPEC countries and Russia, bln. $, 2000-2017 Source: Analytical Center 24
- 204. The acceptable price in budget leveraging, 2000-2017
- 205. Source: BP Russian Primary Energy Consumption, mln toe
- 206. GDP, export and import of Russia, y/y, 2015-2017 Source: Thomson Reuters Datastream
- 207. Russian export of energy, mln toe Source: ERI RAS
- 208. Source: BP Russian Primary Energy Consumption, mln toe
- 209. Conclusions on OPEC+ Oil prices of $55 - $70 helped to Global growth restoration in 2016-2018
- 210. World Energy Transition and Future World is undergoing Energy transition, but still not that fast as
- 211. Literature 1 Григорьев Л.М., Чапыгина А.В. «Саудовская Аравия – нефть и развитие», «Мировая Энергетическая политика», №7,
- 212. Literature 2 “Global and Russian Energy Outlook Up To 2040”, IES, RAS,2016 “Domestic Debates on Climate
- 213. Macro & 4.03.2019 Professor Leonid Grigoryev HSE, Moscow www.leonidgrigoryev.com
- 214. Upcoming events 4 of March – Macro light questions for students 11 of March – lecture
- 215. Ratio of GDP per capita of the USSR/Russia to the USA Source: Maddison Project
- 216. Growth factors – long-run demand Infrastructure – roads and communications, Housing = new tendencies – two
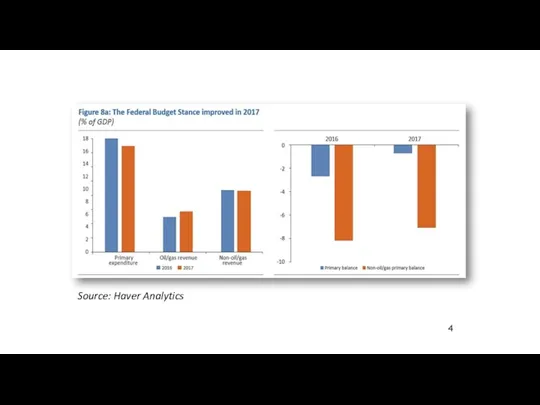
- 217. Source: Haver Analytics 4
- 218. Contribution to real GDP growth from production side 5
- 219. Contribution to real GDP growth from demand side 6
- 220. Main economic indicators of the Russian Federation, 2007-2010, 2014-2017 (1/3) 7
- 221. Main economic indicators of the Russian Federation, 2007-2010, 2014-2017 (2/3) 8
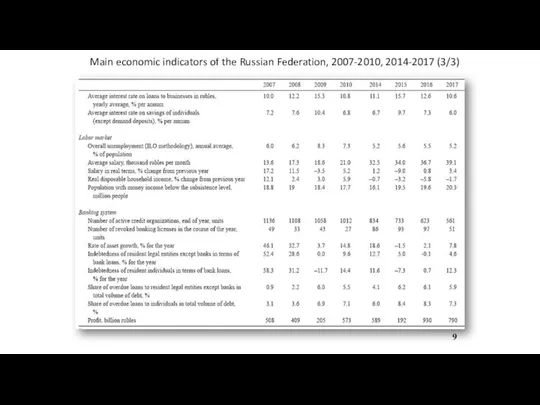
- 222. Main economic indicators of the Russian Federation, 2007-2010, 2014-2017 (3/3) 9
- 223. Industrial production, 1990—2017*, 1998 = 100 *Half year 2017 Source: Rosstat 10
- 224. Gross profit and wages as a percentage of GDP (right scale) 11
- 225. Income ratio by quintile, population, %; Gini coefficient, 2013-2018 Source: Rosstat 12
- 226. Population income distribution, thousand roubles, 2013-2018 Source: Rosstat 13
- 227. Personal consumption structure in Russia, 1990-2017 Source: Euromonitor 14
- 228. Share of households in possession of some household durables and gadgets in Russia, 1992-2017 Source: Euromonitor
- 229. Actual CPI and survey inflationary expectations, 2010-2017 (by November) 16
- 230. Federal Budget Expenditures 17
- 231. Foreign Trade Main Parameters 18
- 232. Military expenditure, in constant (2015) US$ 19 Source: SIPR, 2017I
- 233. Relative Stability of main economic indicators
- 234. CPI, key interest rate CBR, ruble to $ rate and key % minus CPI 21
- 235. Note: Seasonally adjusted quarterly growth, annualized. PMI stands for Purchasing Manager’s Index. Source: Haver Analytics, World
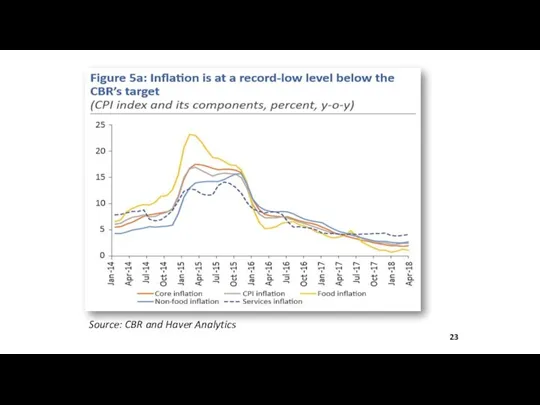
- 236. Source: CBR and Haver Analytics 23
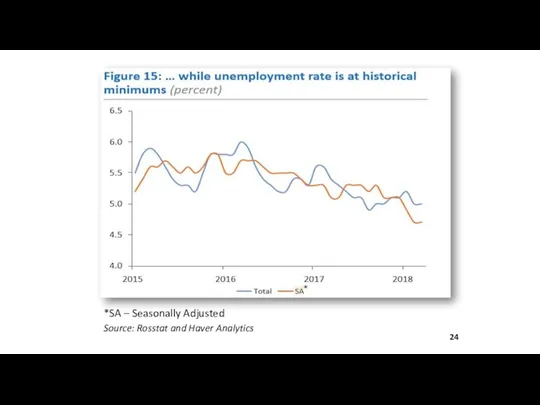
- 237. *SA – Seasonally Adjusted Source: Rosstat and Haver Analytics 24
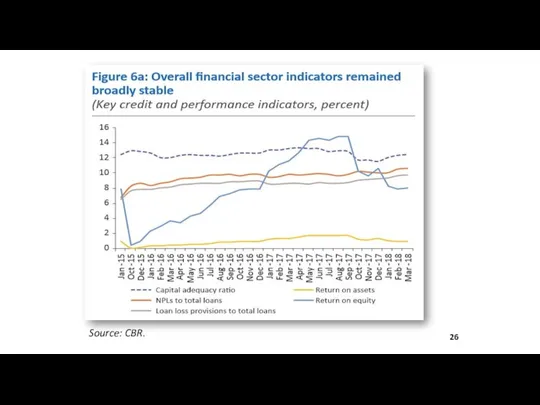
- 238. Source: CBR 25
- 239. Source: CBR. 26
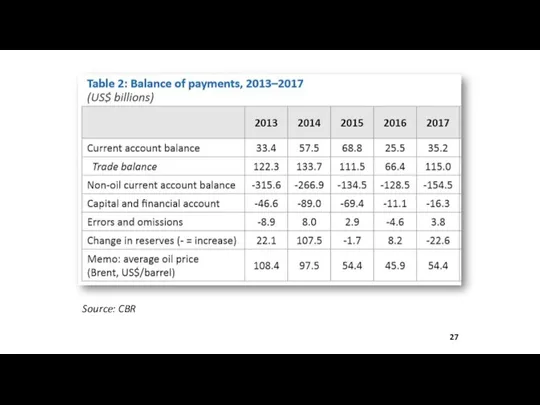
- 240. Source: CBR 27
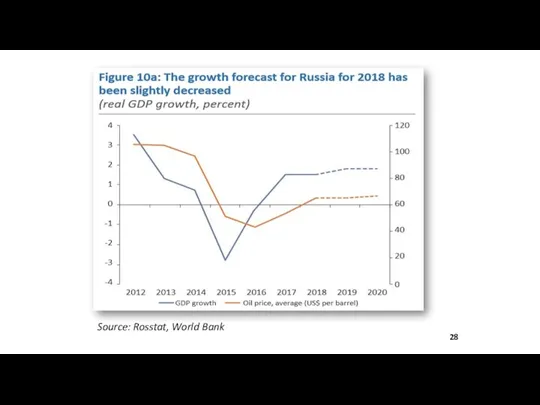
- 241. Source: Rosstat, World Bank 28
- 242. Recession and implications Recession is difficult for everybody Unofficial evaluations gave the loss of GDP to
- 243. Conclusion: Russia Russia has made the detour from European income distribution to Latin American one in
- 245. Скачать презентацию
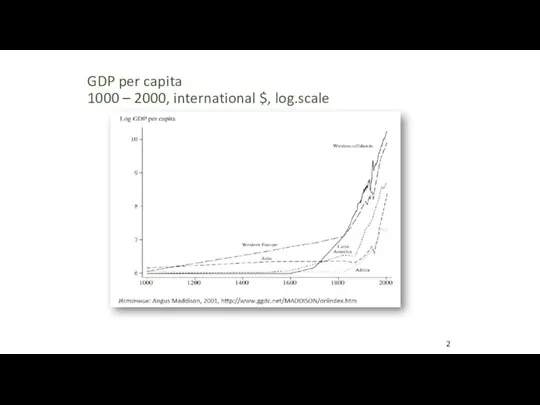
GDP per capita
1000 – 2000, international $, log.scale
2
GDP per capita
1000 – 2000, international $, log.scale
2
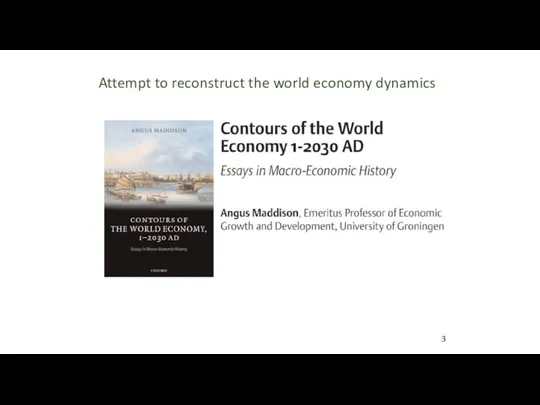
Attempt to reconstruct the world economy dynamics
3
Attempt to reconstruct the world economy dynamics
3
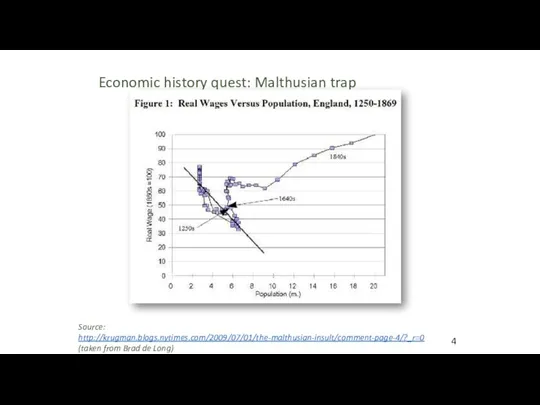
Economic history quest: Malthusian trap
Source: http://krugman.blogs.nytimes.com/2009/07/01/the-malthusian-insult/comment-page-4/?_r=0 (taken from Brad de Long)
4
Economic history quest: Malthusian trap
Source: http://krugman.blogs.nytimes.com/2009/07/01/the-malthusian-insult/comment-page-4/?_r=0 (taken from Brad de Long)
4
Development rates of countries differ
Environment: tropics, moderate, North, heath, islands and
Development rates of countries differ
Environment: tropics, moderate, North, heath, islands and
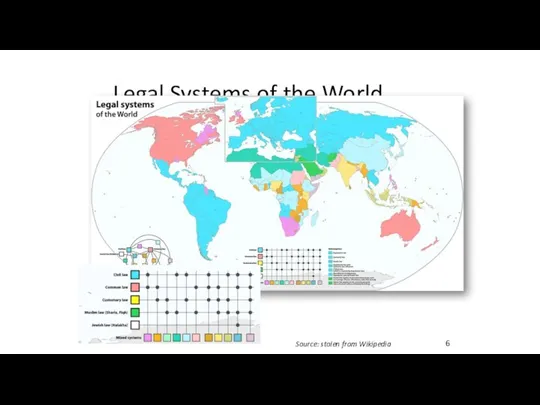
Legal Systems of the World
Source: stolen from Wikipedia
6
Legal Systems of the World
Source: stolen from Wikipedia
6
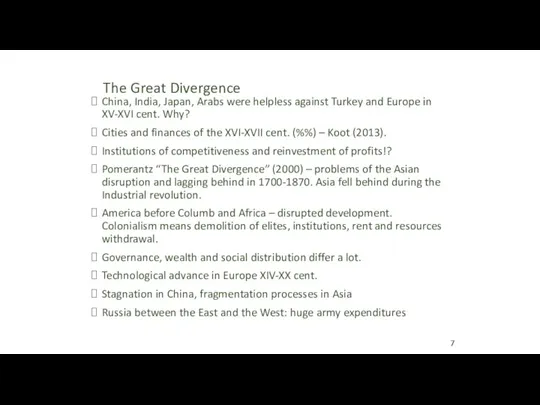
The Great Divergence
China, India, Japan, Arabs were helpless against Turkey and
The Great Divergence
China, India, Japan, Arabs were helpless against Turkey and
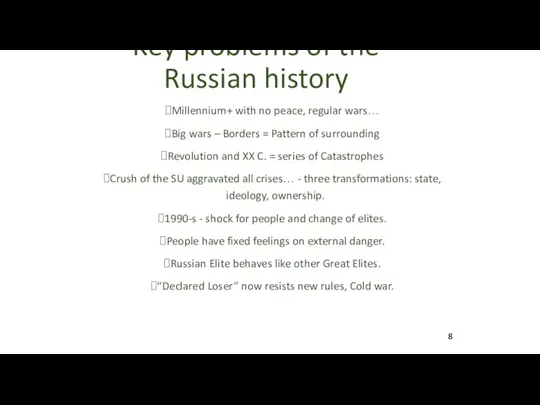
Key problems of the Russian history
Millennium+ with no peace, regular wars…
Big
Key problems of the Russian history
Millennium+ with no peace, regular wars…
Big
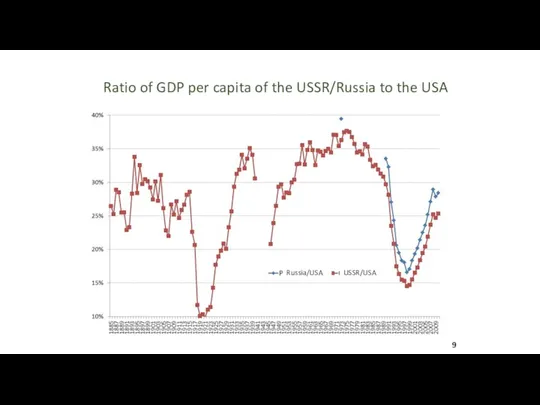
Ratio of GDP per capita of the USSR/Russia to the USA
Russia/USA
USSR/USA
Ratio of GDP per capita of the USSR/Russia to the USA
Russia/USA
USSR/USA
Problems at the end of the 1980s.
Growth in different countries became
Problems at the end of the 1980s.
Growth in different countries became

Moscow princedom, 1533 (in red)
Moscow – Central Federal Region, 2013 (green
Moscow princedom, 1533 (in red) Moscow – Central Federal Region, 2013 (green
History – till 1533
Russian elites – “driving under influence”: Normans since
History – till 1533
Russian elites – “driving under influence”: Normans since
History – 1533- 1991 (1)
1533 – turning point for enlarging
History – 1533- 1991 (1)
1533 – turning point for enlarging
History – 1533- 1991 (2)
WWI and Romanov’s Crush, Revolution out
History – 1533- 1991 (2)
WWI and Romanov’s Crush, Revolution out
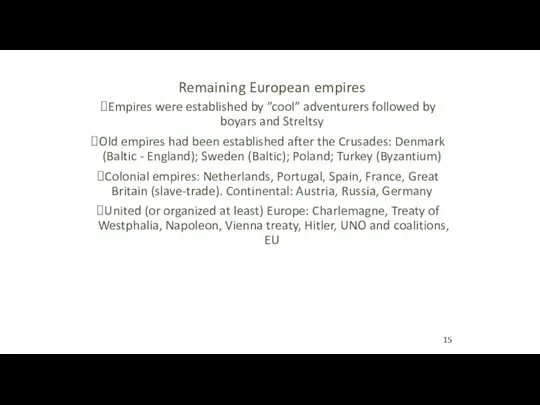
Remaining European empires
Empires were established by ”cool” adventurers followed by boyars
Remaining European empires
Empires were established by ”cool” adventurers followed by boyars
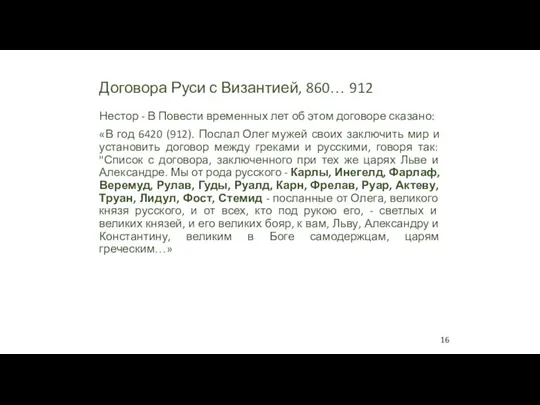
Договора Руси с Византией, 860… 912
Нестор - В Повести временных лет об этом
Договора Руси с Византией, 860… 912
Нестор - В Повести временных лет об этом

Договора Руси с Византией, 860… 912
Русско-византийский договор (907-912). Заключен после успешного
Договора Руси с Византией, 860… 912
Русско-византийский договор (907-912). Заключен после успешного
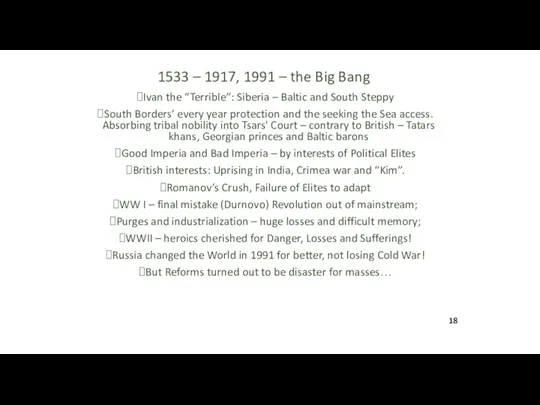
1533 – 1917, 1991 – the Big Bang
Ivan the “Terrible”: Siberia
1533 – 1917, 1991 – the Big Bang
Ivan the “Terrible”: Siberia
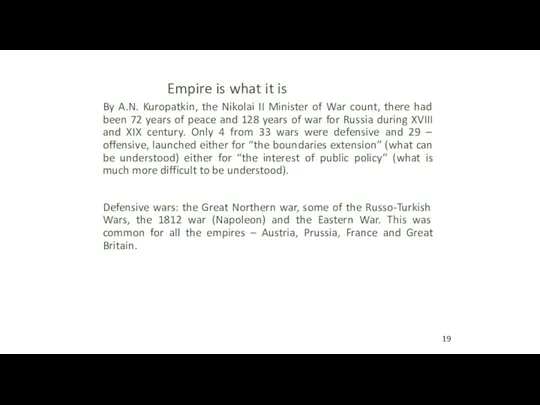
Empire is what it is
By A.N. Kuropatkin, the Nikolai II Minister
Empire is what it is
By A.N. Kuropatkin, the Nikolai II Minister
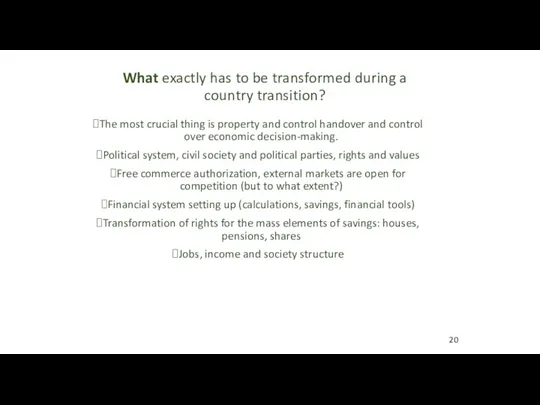
What exactly has to be transformed during a country transition?
The most
What exactly has to be transformed during a country transition?
The most
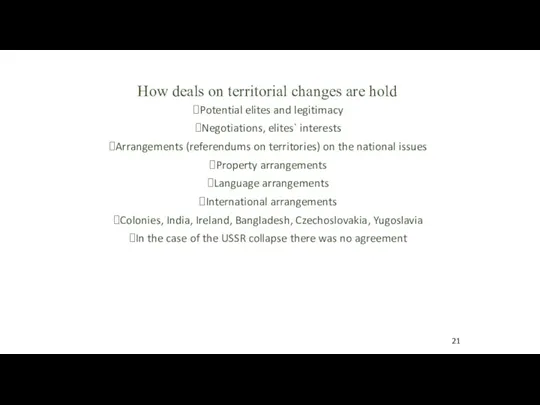
How deals on territorial changes are hold
Potential elites and legitimacy
Negotiations, elites`
How deals on territorial changes are hold
Potential elites and legitimacy
Negotiations, elites`
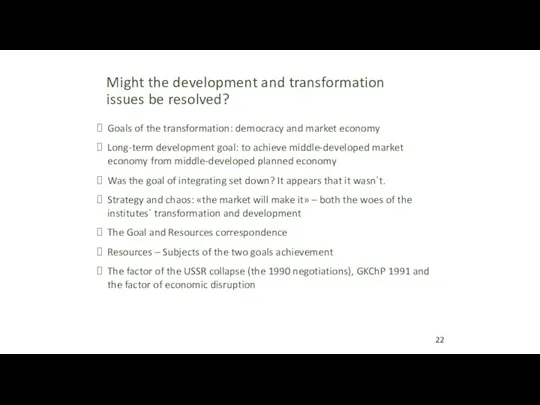
Might the development and transformation issues be resolved?
Goals of the transformation:
Might the development and transformation issues be resolved?
Goals of the transformation:
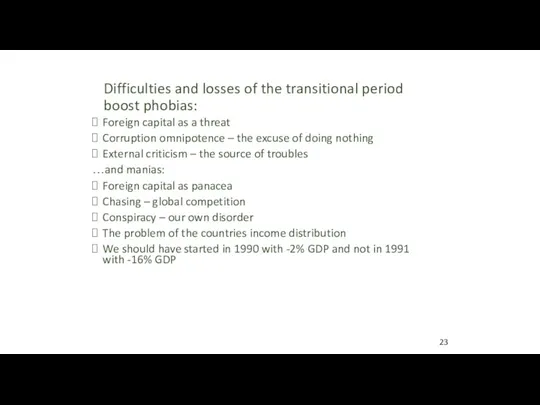
Difficulties and losses of the transitional period boost phobias:
Foreign capital as
Difficulties and losses of the transitional period boost phobias:
Foreign capital as
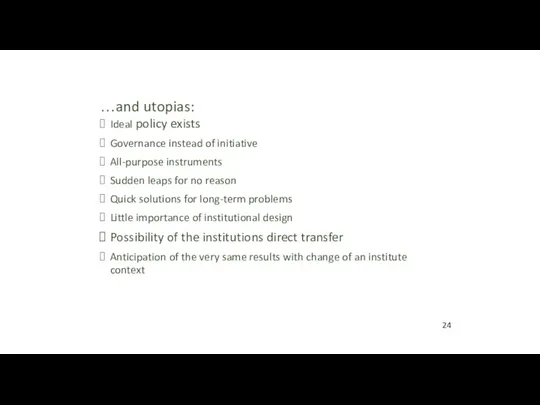
…and utopias:
Ideal policy exists
Governance instead of initiative
All-purpose instruments
Sudden leaps for no
…and utopias:
Ideal policy exists
Governance instead of initiative
All-purpose instruments
Sudden leaps for no

What did Russia obtained after the collapse?
Territory – more than 80%
What did Russia obtained after the collapse?
Territory – more than 80%
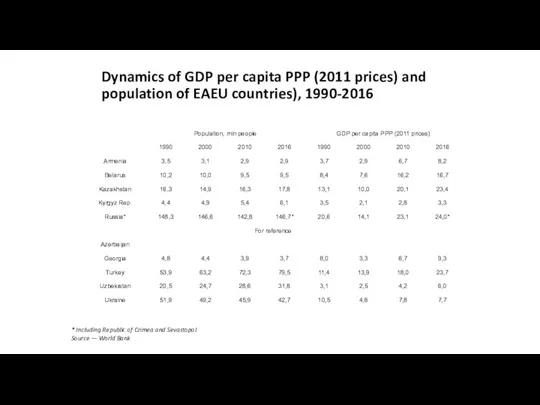
Dynamics of GDP per capita PPP (2011 prices) and population of
Dynamics of GDP per capita PPP (2011 prices) and population of
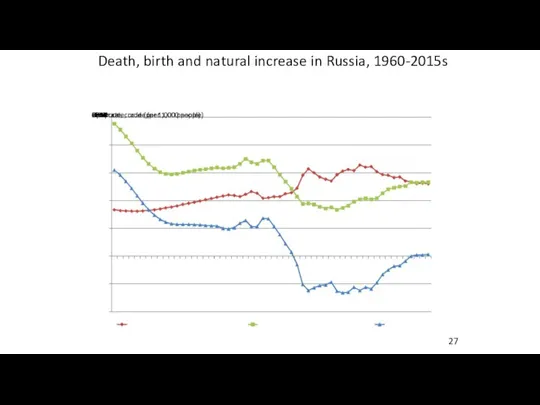
Death, birth and natural increase in Russia, 1960-2015s
27
Death, birth and natural increase in Russia, 1960-2015s
27

Source: World Bank
GDP PPP per capita, constant US$
Source: World Bank
GDP PPP per capita, constant US$
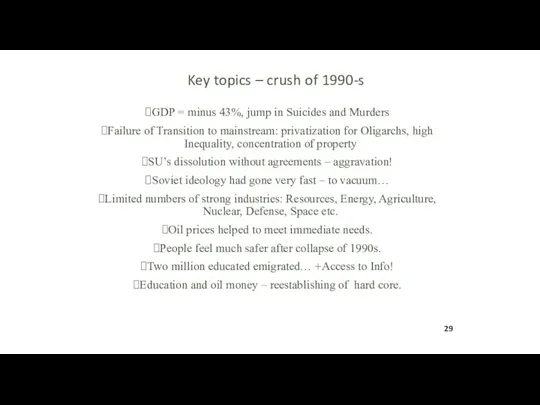
Key topics – crush of 1990-s
GDP = minus 43%, jump in
Key topics – crush of 1990-s
GDP = minus 43%, jump in
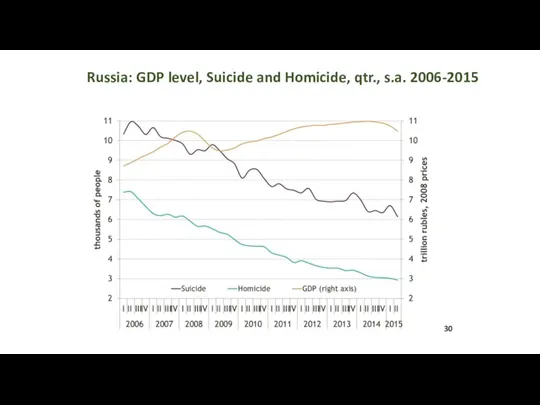
Russia: GDP level, Suicide and Homicide, qtr., s.a. 2006-2015
Russia: GDP level, Suicide and Homicide, qtr., s.a. 2006-2015
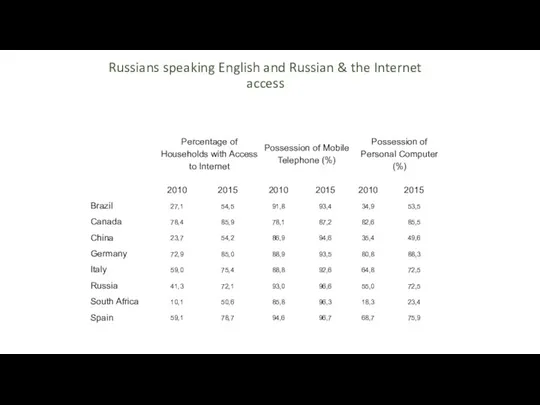
Russians speaking English and Russian & the Internet access
Russians speaking English and Russian & the Internet access
Society after 1/4 Century of Transition
Current Russian Socio-economic realty is the
Society after 1/4 Century of Transition
Current Russian Socio-economic realty is the
Key topics – Cold war in minds of Elites
Russians never lost
Key topics – Cold war in minds of Elites
Russians never lost
Trap of the middle level development?
The «500 days» program 1990;
Trap of the middle level development?
The «500 days» program 1990;
Leonid Grigoryev – some publications
Elites - the Choice for Modernization
Leonid Grigoryev – some publications
Elites - the Choice for Modernization
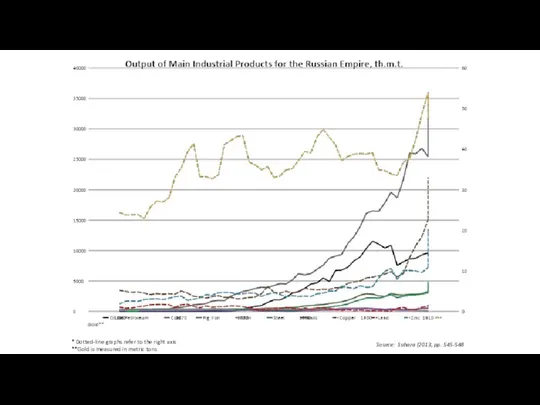
* Dotted-line graphs refer to the right axis
**Gold is measured in
* Dotted-line graphs refer to the right axis
**Gold is measured in
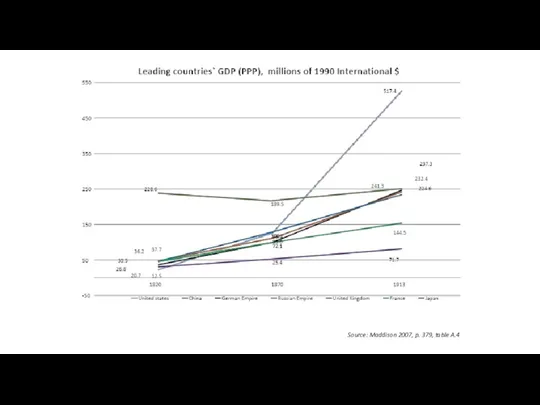
Source: Maddison 2007, p. 379, table A.4
Source: Maddison 2007, p. 379, table A.4
Literature, basic:
1. Mau V., Drobyshevskaya T. "Modernization and the Russian Economy:
Literature, basic:
1. Mau V., Drobyshevskaya T. "Modernization and the Russian Economy:
Transformations of 1917-2018
(ideology, ownership, country’s configuration)
and objective reasons for
Transformations of 1917-2018 (ideology, ownership, country’s configuration) and objective reasons for
Topics for discussion:
Russian in 1913 – Development V Institutions
European politics and
Topics for discussion:
Russian in 1913 – Development V Institutions
European politics and
History
Millennium+ with no peace, regular invasions
Normans, Byzantium, Nomads before Mongols
Big
History
Millennium+ with no peace, regular invasions
Normans, Byzantium, Nomads before Mongols
Big
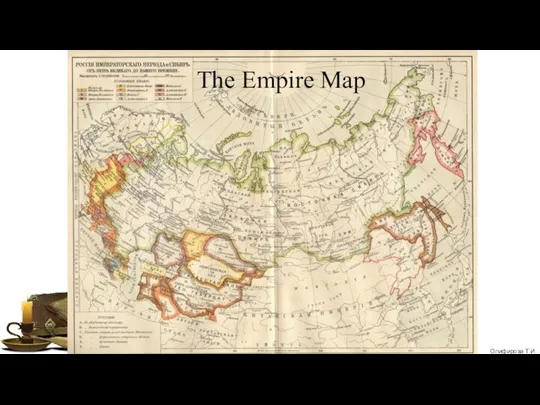
The Empire Map
The Empire Map
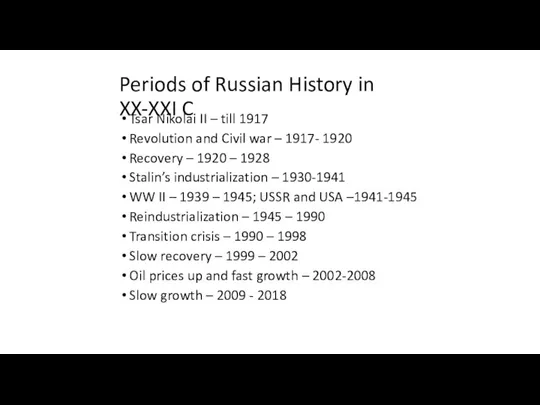
Periods of Russian History in XX-XXI C
Tsar Nikolai II – till
Periods of Russian History in XX-XXI C
Tsar Nikolai II – till
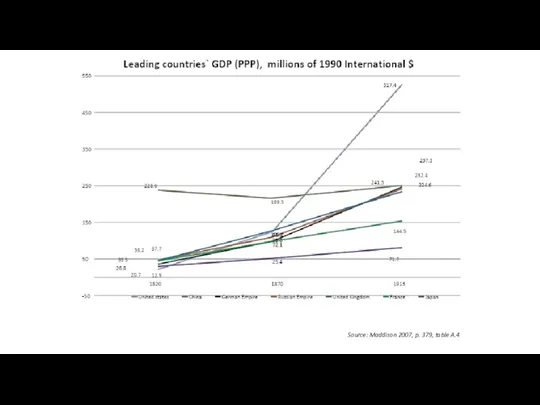
Source: Maddison 2007, p. 379, table A.4
Source: Maddison 2007, p. 379, table A.4
* Dotted-line graphs refer to the right axis
**Gold is measured in
* Dotted-line graphs refer to the right axis
**Gold is measured in
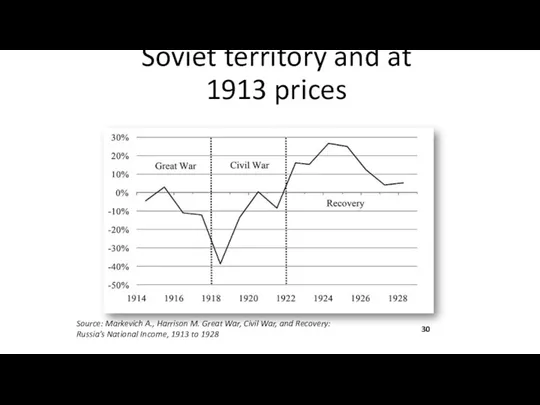
Real national income per head, 1913 to 1927/28: year-on-year percent change
Real national income per head, 1913 to 1927/28: year-on-year percent change

Postwar recovery: The GDPs of selected Eurasian countries in 1928, percent
Postwar recovery: The GDPs of selected Eurasian countries in 1928, percent
European Empires and Unions
Empires were established by ”cool” adventurers followed by
European Empires and Unions
Empires were established by ”cool” adventurers followed by
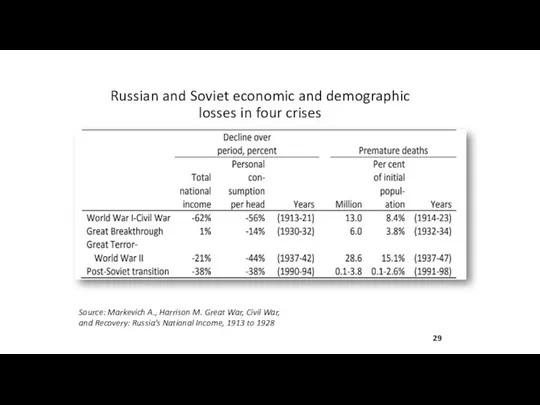
Russian and Soviet economic and demographic losses in four crises
Source: Markevich
Russian and Soviet economic and demographic losses in four crises
Source: Markevich
1990 - 2018
Three Transformations:
State configuration
Politics and ideology
Ownership
Steps of 1992: free trade,
1990 - 2018
Three Transformations:
State configuration
Politics and ideology
Ownership
Steps of 1992: free trade,
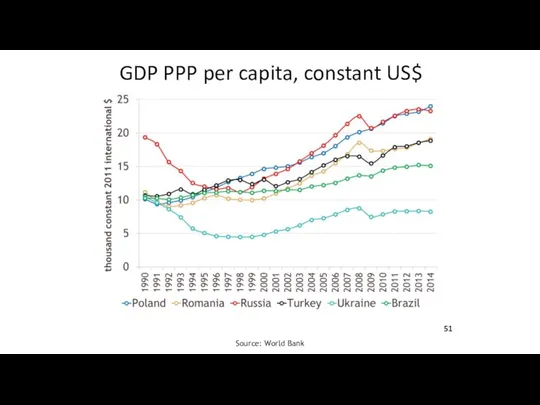
Source: World Bank
GDP PPP per capita, constant US$
Source: World Bank
GDP PPP per capita, constant US$
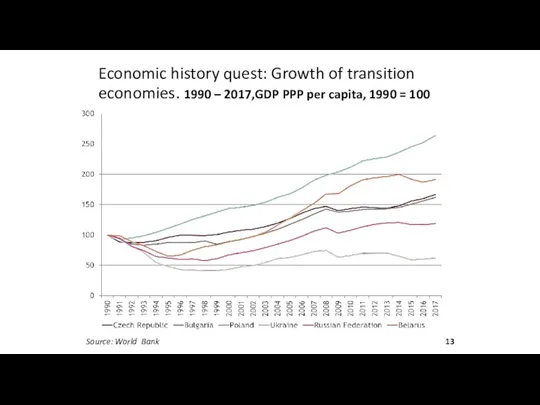
Source: World Bank
Economic history quest: Growth of transition economies. 1990 –
Source: World Bank
Economic history quest: Growth of transition economies. 1990 –
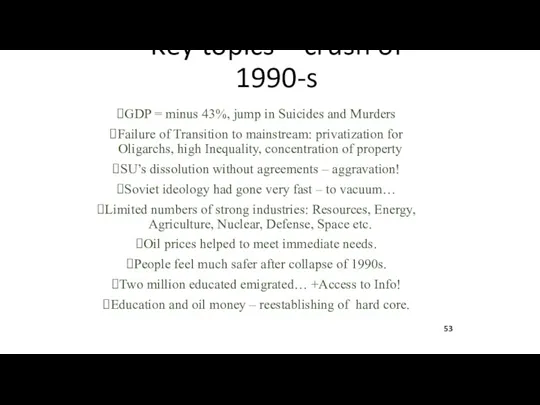
Key topics – crush of 1990-s
GDP = minus 43%, jump in
Key topics – crush of 1990-s
GDP = minus 43%, jump in
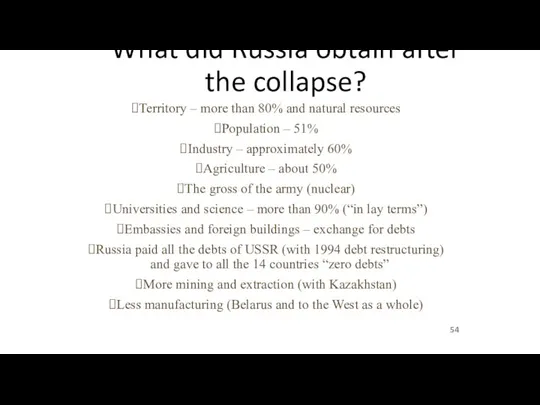
What did Russia obtain after the collapse?
Territory – more than 80%
What did Russia obtain after the collapse?
Territory – more than 80%
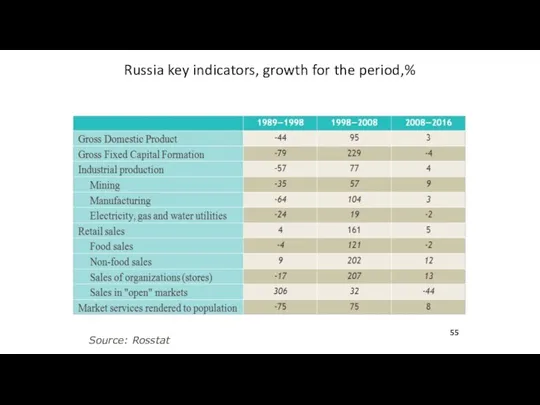
Russia key indicators, growth for the period,%
Source: Rosstat
Russia key indicators, growth for the period,%
Source: Rosstat
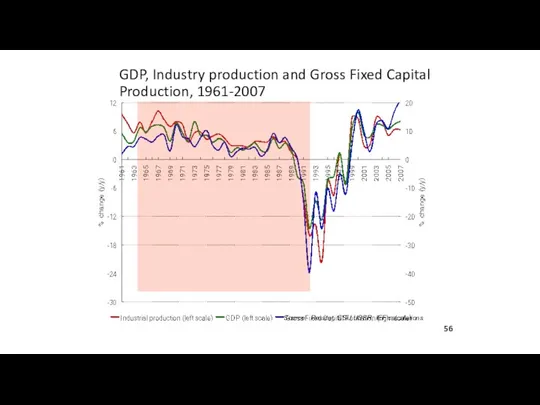
GDP, Industry production and Gross Fixed Capital Production, 1961-2007
Source: Rosstat, CSU
GDP, Industry production and Gross Fixed Capital Production, 1961-2007
Source: Rosstat, CSU
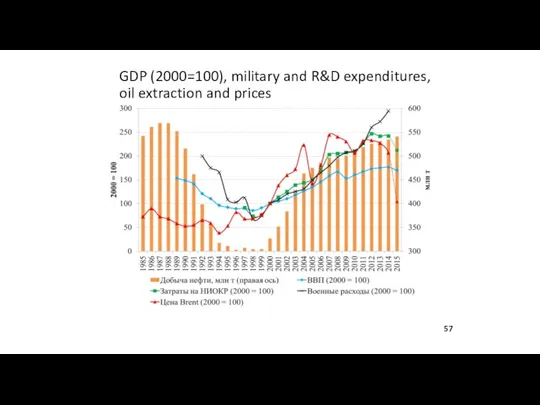
GDP (2000=100), military and R&D expenditures, oil extraction and prices
GDP (2000=100), military and R&D expenditures, oil extraction and prices
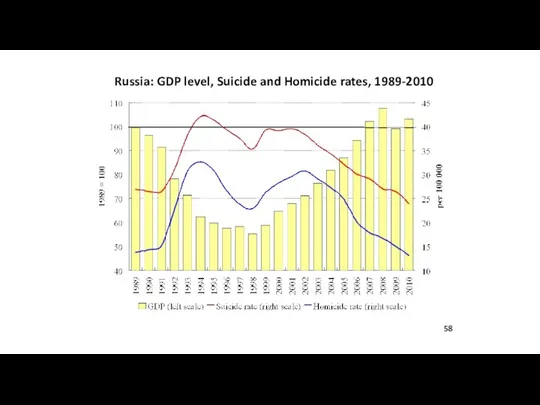
Russia: GDP level, Suicide and Homicide rates, 1989-2010
Russia: GDP level, Suicide and Homicide rates, 1989-2010
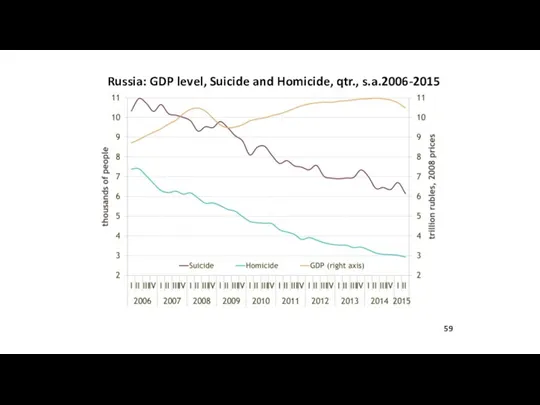
Russia: GDP level, Suicide and Homicide, qtr., s.a.2006-2015
Russia: GDP level, Suicide and Homicide, qtr., s.a.2006-2015
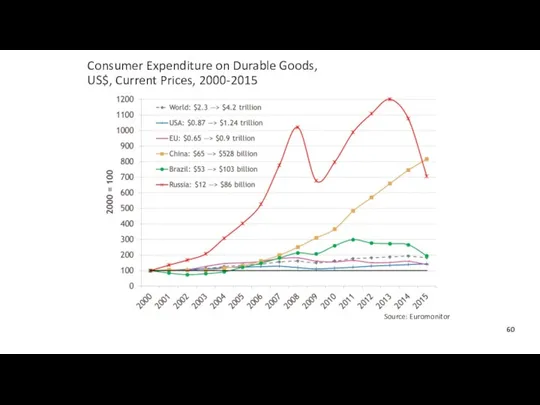
Consumer Expenditure on Durable Goods,
US$, Current Prices, 2000-2015
Source: Euromonitor
Consumer Expenditure on Durable Goods,
US$, Current Prices, 2000-2015
Source: Euromonitor
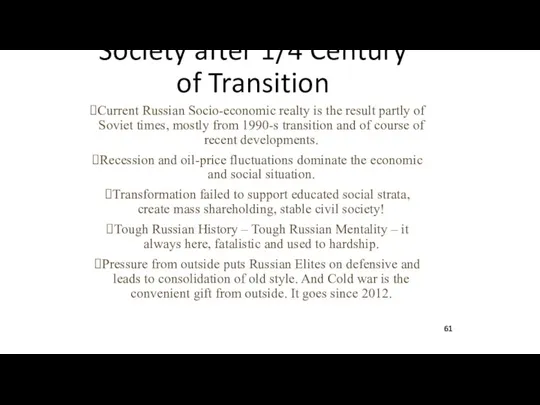
Society after 1/4 Century of Transition
Current Russian Socio-economic realty is the
Society after 1/4 Century of Transition
Current Russian Socio-economic realty is the
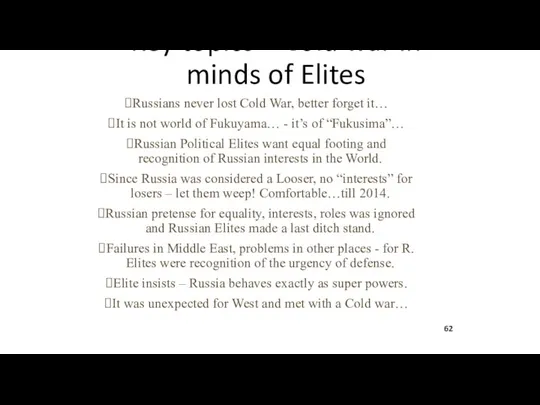
Key topics – Cold war in minds of Elites
Russians never lost
Key topics – Cold war in minds of Elites
Russians never lost
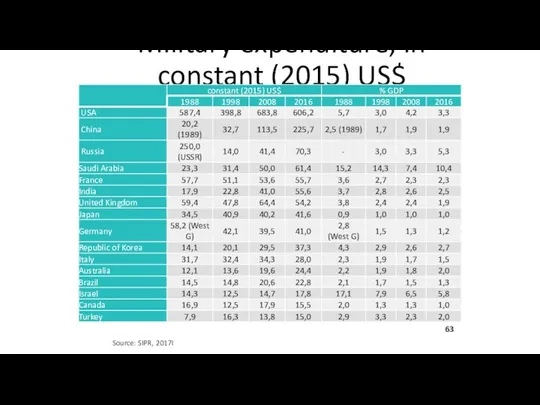
Military expenditure, in constant (2015) US$
Source: SIPR, 2017I
Military expenditure, in constant (2015) US$
Source: SIPR, 2017I
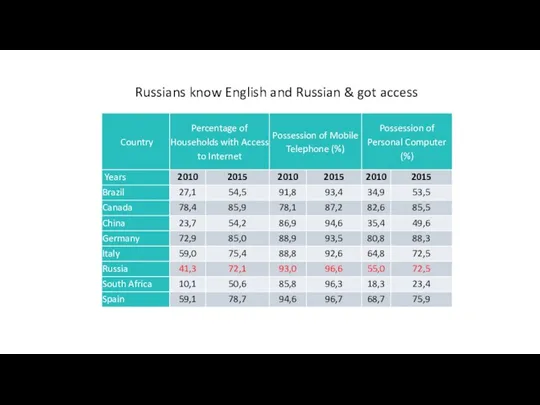
Russians know English and Russian & got access
Russians know English and Russian & got access
Logic of this Presentation
Objective problem of Russian history and institutions with
Logic of this Presentation
Objective problem of Russian history and institutions with
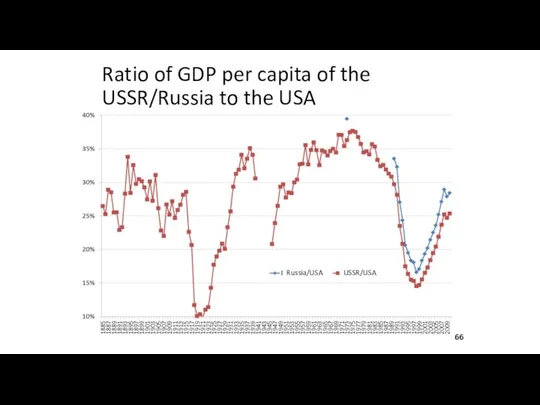
Ratio of GDP per capita of the USSR/Russia to the USA
Russia/USA
USSR/USA
Ratio of GDP per capita of the USSR/Russia to the USA
Russia/USA
USSR/USA
Literature:
“Transition to Market Economy” (in collaboration), Moscow, 1990, a.k.a. "500 days.
Literature:
“Transition to Market Economy” (in collaboration), Moscow, 1990, a.k.a. "500 days.
Russia - transformations of 1990-2018
Privatization and Ownership
and corporate governance
"Even
Russia - transformations of 1990-2018 Privatization and Ownership and corporate governance "Even
No warning for the People of the USSR
"No leader has yet
No warning for the People of the USSR
"No leader has yet
Source: World Bank
GDP PPP per capita, constant US$
Source: World Bank
GDP PPP per capita, constant US$
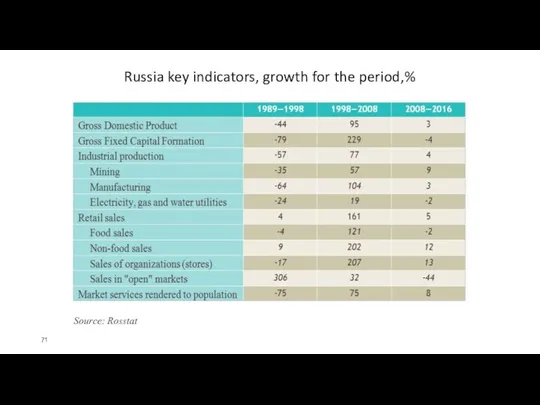
Russia key indicators, growth for the period,%
Source: Rosstat
Russia key indicators, growth for the period,%
Source: Rosstat
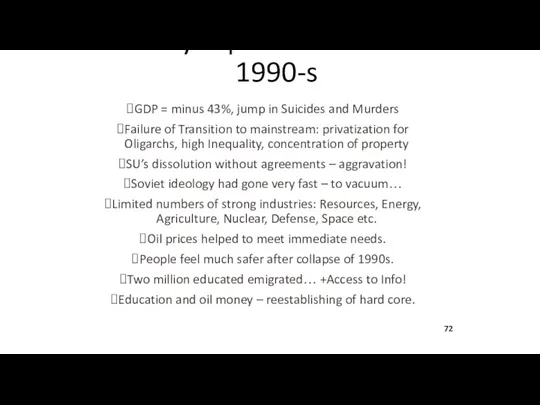
Key topics – crush of 1990-s
GDP = minus 43%, jump in
Key topics – crush of 1990-s
GDP = minus 43%, jump in
Transformation Debates 1987-1992
1987 – "ECO" = 70 years since 1917; Aganbegian,
Transformation Debates 1987-1992
1987 – "ECO" = 70 years since 1917; Aganbegian,
"Soviets need a unified Free Economy" (1/2)
Leonid Grigoriev – New York
"Soviets need a unified Free Economy" (1/2) Leonid Grigoriev – New York
"Soviets need a unified Free Economy" (2/2)
Leonid Grigoriev – New York
"Soviets need a unified Free Economy" (2/2) Leonid Grigoriev – New York

Global Choice of privatization
To privatize:
Lands, houses, infrastructure, firms, natural resources,
Global Choice of privatization
To privatize:
Lands, houses, infrastructure, firms, natural resources,
OECD countries in 2017
Source: Size and Sectoral Distribution of Stateowned
OECD countries in 2017
Source: Size and Sectoral Distribution of Stateowned
1990 - 2018
Three Transformations
State configuration = dissolution of the USSR into
1990 - 2018
Three Transformations
State configuration = dissolution of the USSR into
Ronald Сoase and transaction costs
Stigler 1966: "the Coase theorem thus asserts
Ronald Сoase and transaction costs
Stigler 1966: "the Coase theorem thus asserts

Bundle of Rights – Honore 1961 – Ownership (1/2)
(1) The
Bundle of Rights – Honore 1961 – Ownership (1/2)
(1) The
Bundle of Rights – Honore 1961 – Ownership (2/2)
(3) Right
Bundle of Rights – Honore 1961 – Ownership (2/2)
(3) Right
Privatization and Choice of Objectives
Interests in Privatization differ:
Nation – soft transition
Privatization and Choice of Objectives
Interests in Privatization differ:
Nation – soft transition
Institutional conditions for effective privatization
Source: Kikery S, Nelis J., Shirly M.,
Institutional conditions for effective privatization
Source: Kikery S, Nelis J., Shirly M.,
17
Source: Voszka, É. – Kiss, G. D. (eds) 2014: Crisis Management
17
Source: Voszka, É. – Kiss, G. D. (eds) 2014: Crisis Management
Source: Voszka, É. – Kiss, G. D. (eds) 2014: Crisis Management
Source: Voszka, É. – Kiss, G. D. (eds) 2014: Crisis Management
Share of public SOE`s in total employment, 2012 (%)
19
Share of public SOE`s in total employment, 2012 (%)
19
Share of public SOE`s in total market capitalization for various countries,
Share of public SOE`s in total market capitalization for various countries,
Privatization revenues, 1990-1999, bill. dollars
Source: Goskomstat, Jan.2002, World Bank Privatization Database,
Privatization revenues, 1990-1999, bill. dollars
Source: Goskomstat, Jan.2002, World Bank Privatization Database,
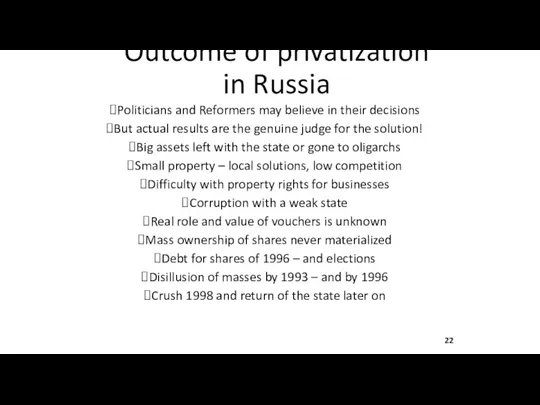
Outcome of privatization in Russia
Politicians and Reformers may believe in their
Outcome of privatization in Russia
Politicians and Reformers may believe in their
Source: F. Novokmet, T. Piketty, G. Zucman. From Soviets to Oligarchs:
Source: F. Novokmet, T. Piketty, G. Zucman. From Soviets to Oligarchs:
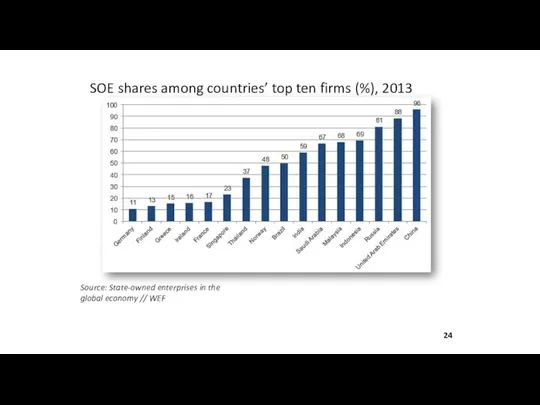
SOE shares among countries’ top ten firms (%), 2013
Source: State-owned enterprises
SOE shares among countries’ top ten firms (%), 2013
Source: State-owned enterprises
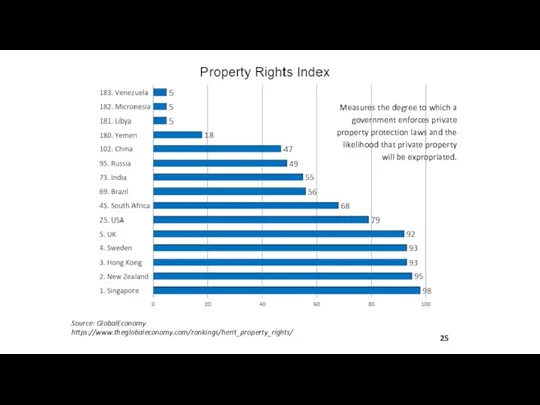
Source: GlobalEconomy https://www.theglobaleconomy.com/rankings/herit_property_rights/
Measures the degree to which a government enforces private
Source: GlobalEconomy https://www.theglobaleconomy.com/rankings/herit_property_rights/
Measures the degree to which a government enforces private
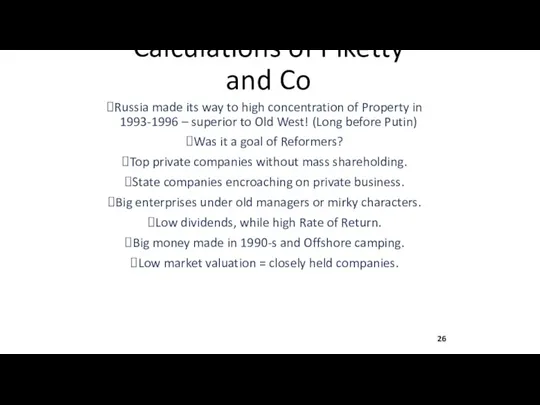
Calculations of Piketty and Co
Russia made its way to high concentration
Calculations of Piketty and Co
Russia made its way to high concentration
Source: F. Novokmet, T. Piketty, G. Zucman. From Soviets to Oligarchs:
Source: F. Novokmet, T. Piketty, G. Zucman. From Soviets to Oligarchs:
Source: F. Novokmet, T. Piketty, G. Zucman. From Soviets to Oligarchs:
Inequality
Source: F. Novokmet, T. Piketty, G. Zucman. From Soviets to Oligarchs:
Inequality
Source: F. Novokmet, T. Piketty, G. Zucman. From Soviets to Oligarchs:
Source: F. Novokmet, T. Piketty, G. Zucman. From Soviets to Oligarchs:

Source: F. Novokmet, T. Piketty, G. Zucman. From Soviets to Oligarchs:
Source: F. Novokmet, T. Piketty, G. Zucman. From Soviets to Oligarchs:
Source: F. Novokmet, T. Piketty, G. Zucman. From Soviets to Oligarchs:
Source: F. Novokmet, T. Piketty, G. Zucman. From Soviets to Oligarchs:
Source: F. Novokmet, T. Piketty, G. Zucman. From Soviets to Oligarchs:
Source: F. Novokmet, T. Piketty, G. Zucman. From Soviets to Oligarchs:
Source: F. Novokmet, T. Piketty, G. Zucman. From Soviets to Oligarchs:
Source: F. Novokmet, T. Piketty, G. Zucman. From Soviets to Oligarchs:
Source: F. Novokmet, T. Piketty, G. Zucman. From Soviets to Oligarchs:
Source: F. Novokmet, T. Piketty, G. Zucman. From Soviets to Oligarchs:
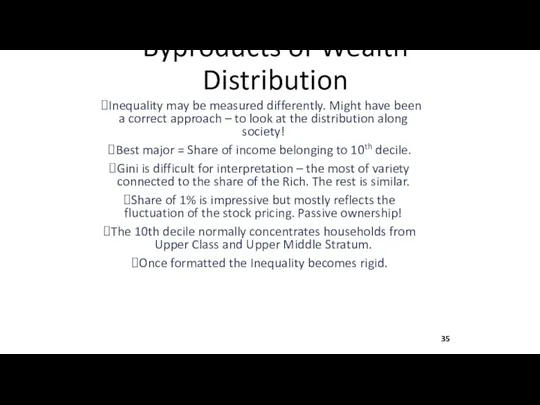
Byproducts of Wealth Distribution
Inequality may be measured differently. Might have been
Byproducts of Wealth Distribution
Inequality may be measured differently. Might have been
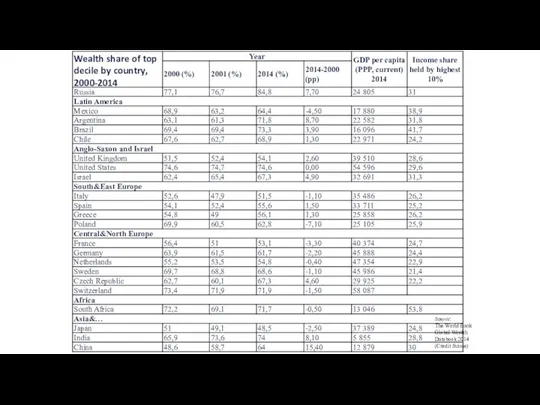
Source:
The World Bank
Global Wealth Databook 2014 (Credit Suisse)
Wealth share
Source:
The World Bank
Global Wealth Databook 2014 (Credit Suisse)
Wealth share
Source: F. Novokmet, T. Piketty, G. Zucman. From Soviets to Oligarchs:
Source: F. Novokmet, T. Piketty, G. Zucman. From Soviets to Oligarchs:
Source: F. Novokmet, T. Piketty, G. Zucman. From Soviets to Oligarchs:
Source: F. Novokmet, T. Piketty, G. Zucman. From Soviets to Oligarchs:
Source: F. Novokmet, T. Piketty, G. Zucman. From Soviets to Oligarchs:
Source: F. Novokmet, T. Piketty, G. Zucman. From Soviets to Oligarchs:
Source: F. Novokmet, T. Piketty, G. Zucman. From Soviets to Oligarchs:
Source: F. Novokmet, T. Piketty, G. Zucman. From Soviets to Oligarchs:
Source: F. Novokmet, T. Piketty, G. Zucman. From Soviets to Oligarchs:
Source: F. Novokmet, T. Piketty, G. Zucman. From Soviets to Oligarchs:
Source: F. Novokmet, T. Piketty, G. Zucman. From Soviets to Oligarchs:
Source: F. Novokmet, T. Piketty, G. Zucman. From Soviets to Oligarchs:
Source: F. Novokmet, T. Piketty, G. Zucman. From Soviets to Oligarchs:
Source: F. Novokmet, T. Piketty, G. Zucman. From Soviets to Oligarchs:
Literature:
Kornai Y. The Socialist System: The Political Economy of Communism. Oxford
Literature:
Kornai Y. The Socialist System: The Political Economy of Communism. Oxford
Leonid Grigoryev – some publications
Grigoryev L. "Ulterior Property Rights"
Leonid Grigoryev – some publications
Grigoryev L. "Ulterior Property Rights"
Global Structure
Inequality:
Income and Wealth
(4.02. 2019)
Tenured Professor Leonid Grigoryev
Global Structure
Inequality:
Income and Wealth
(4.02. 2019)
Tenured Professor Leonid Grigoryev
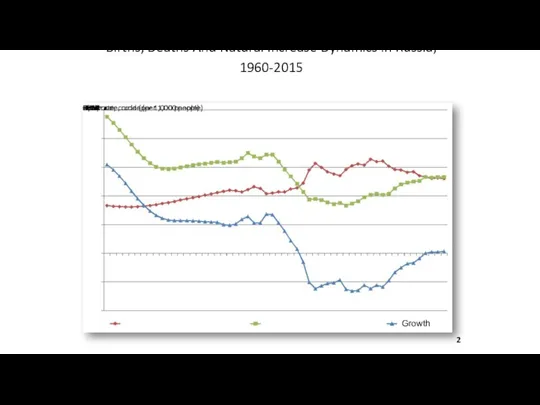
Births, Deaths And Natural Increase Dynamics in Russia, 1960-2015
2
Births, Deaths And Natural Increase Dynamics in Russia, 1960-2015
2
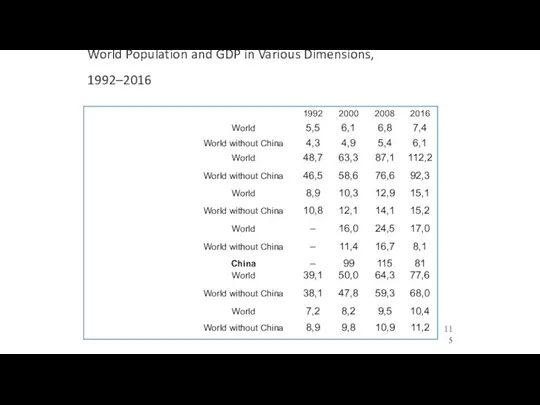
World Population and GDP in Various Dimensions, 1992–2016
World Population and GDP in Various Dimensions, 1992–2016
Key points (1/2):
Inequality between countries changes, Clusters go apart.
Global
Key points (1/2):
Inequality between countries changes, Clusters go apart.
Global
Key points (2/2):
Domestic inequality is rigid, Growth is not changing
Key points (2/2):
Domestic inequality is rigid, Growth is not changing
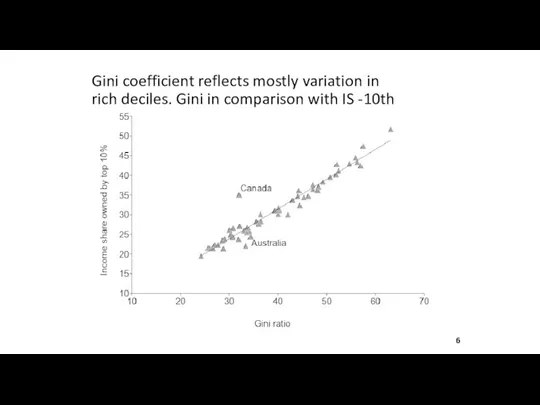
Gini coefficient reflects mostly variation in rich deciles. Gini in comparison
Gini coefficient reflects mostly variation in rich deciles. Gini in comparison
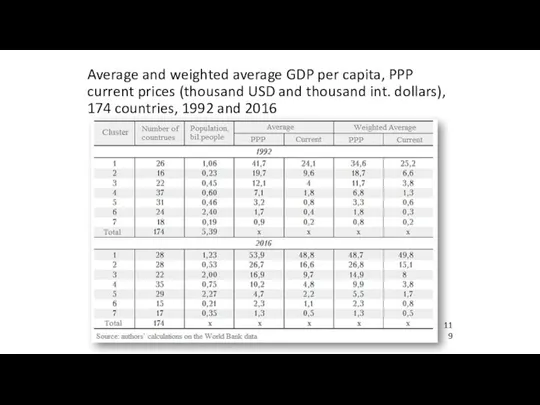
Average and weighted average GDP per capita, PPP current prices (thousand
Average and weighted average GDP per capita, PPP current prices (thousand
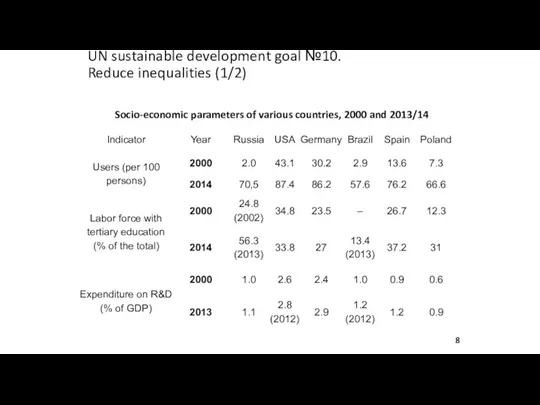
UN sustainable development goal №10.
Reduce inequalities (1/2)
Socio-economic parameters of
UN sustainable development goal №10.
Reduce inequalities (1/2)
Socio-economic parameters of
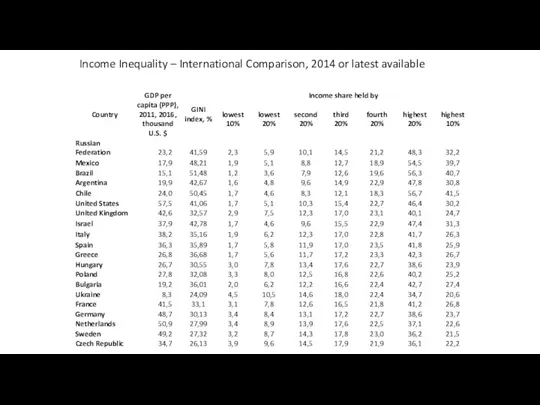
Income Inequality – International Comparison, 2014 or latest available
Income Inequality – International Comparison, 2014 or latest available
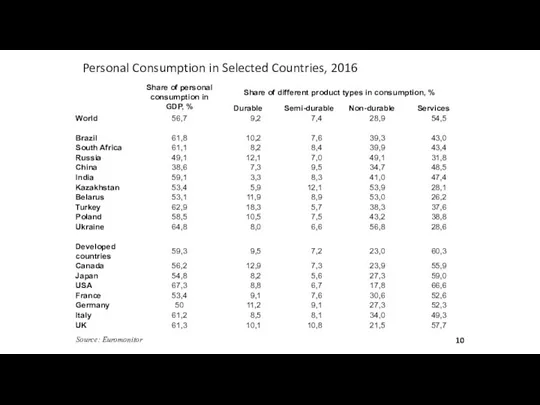
Personal Consumption in Selected Countries, 2016
Source: Euromonitor
10
Personal Consumption in Selected Countries, 2016
Source: Euromonitor
10
Attitudes and Happiness
Transformation has reduced expectations of state support. Not Russia
Attitudes and Happiness
Transformation has reduced expectations of state support. Not Russia
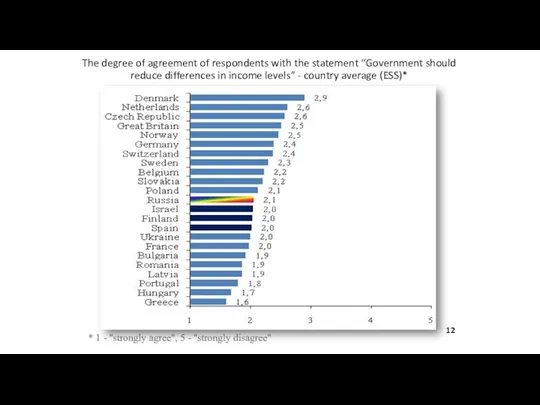
The degree of agreement of respondents with the statement “Government should
The degree of agreement of respondents with the statement “Government should

Level of life satisfaction in BRICS countries by income level, 1990-2014,
Level of life satisfaction in BRICS countries by income level, 1990-2014,
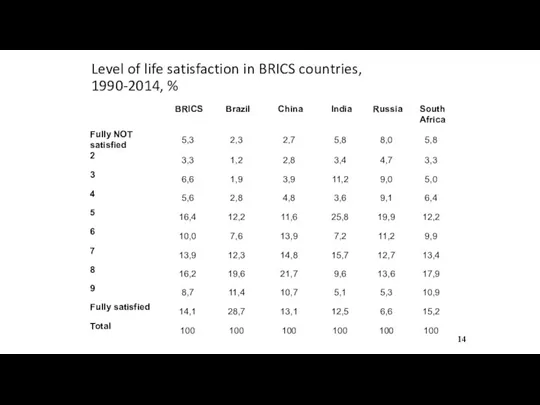
Level of life satisfaction in BRICS countries, 1990-2014, %
14
Level of life satisfaction in BRICS countries, 1990-2014, %
14

Access to Internet, mobile phone and personal computer usage, % households,
Access to Internet, mobile phone and personal computer usage, % households,
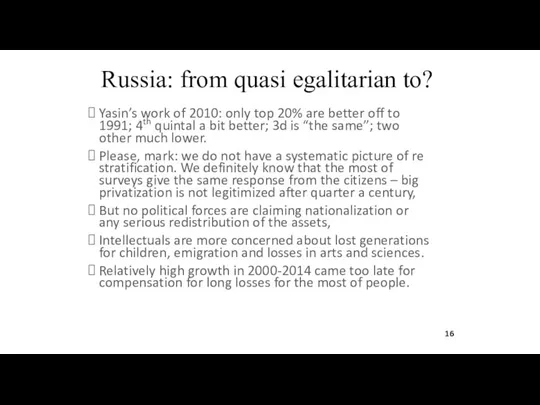
Russia: from quasi egalitarian to?
Yasin’s work of 2010: only top 20%
Russia: from quasi egalitarian to?
Yasin’s work of 2010: only top 20%
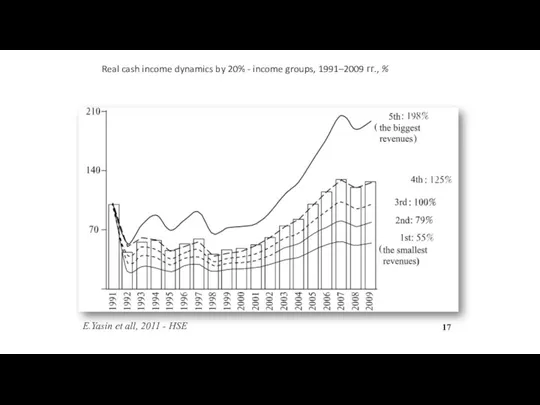
Real cash income dynamics by 20% - income groups, 1991–2009 гг.,
Real cash income dynamics by 20% - income groups, 1991–2009 гг.,
Re-stratification of the society
I could not find a study of the
Re-stratification of the society
I could not find a study of the
Seven Stratas of Society
Upper class – income, rent, etc.: (1) Upper
Seven Stratas of Society
Upper class – income, rent, etc.: (1) Upper
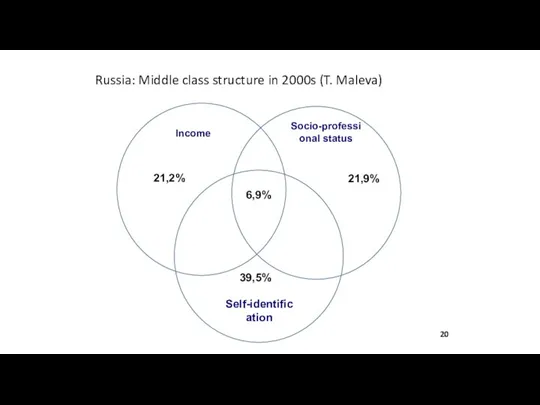
Russia: Middle class structure in 2000s (T. Maleva)
20
Russia: Middle class structure in 2000s (T. Maleva)
20
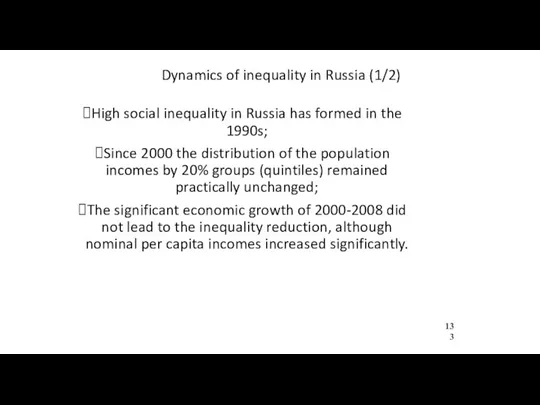
Dynamics of inequality in Russia (1/2)
High social inequality in Russia has
Dynamics of inequality in Russia (1/2)
High social inequality in Russia has
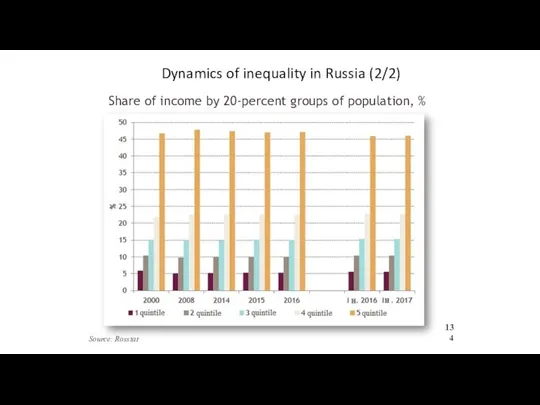
Dynamics of inequality in Russia (2/2)
Share of income by 20-percent groups
Dynamics of inequality in Russia (2/2)
Share of income by 20-percent groups
Transformation of society: features
10 years of economic decline (minus 43) lead
Transformation of society: features
10 years of economic decline (minus 43) lead
Income and Wealth Inequality
Inequality has a long history – in Europe
Income and Wealth Inequality
Inequality has a long history – in Europe
Wealth share of top decile by country, 2000-2014 (The World Bank
Wealth share of top decile by country, 2000-2014 (The World Bank
UN sustainable development goal №10.
Reduce inequalities (2/2)
Distribution of financial
UN sustainable development goal №10.
Reduce inequalities (2/2)
Distribution of financial
Source: F. Novokmet, T. Piketty, G. Zucman. From Soviets to Oligarchs:
Source: F. Novokmet, T. Piketty, G. Zucman. From Soviets to Oligarchs:
Source: F. Novokmet, T. Piketty, G. Zucman. From Soviets to Oligarchs:
Source: F. Novokmet, T. Piketty, G. Zucman. From Soviets to Oligarchs:
Source: F. Novokmet, T. Piketty, G. Zucman. From Soviets to Oligarchs:
Source: F. Novokmet, T. Piketty, G. Zucman. From Soviets to Oligarchs:

Conclusion: Russia
Russia has made the detour from European income
Conclusion: Russia
Russia has made the detour from European income
31
31
Literature – 1
Atkinson Anthony “Inequality. What can be done?”, Cambridge,
Literature – 1
Atkinson Anthony “Inequality. What can be done?”, Cambridge,
Literature - 2
Григорьев Л.М, Павлюшина В.А. Социальное неравенство в мире
Literature - 2
Григорьев Л.М, Павлюшина В.А. Социальное неравенство в мире
Growth and Macro
11.02.2019
Professor Leonid Grigoryev
HSE, Moscow
www.leonidgrigoryev.com
Growth and Macro
11.02.2019
Professor Leonid Grigoryev
HSE, Moscow
www.leonidgrigoryev.com
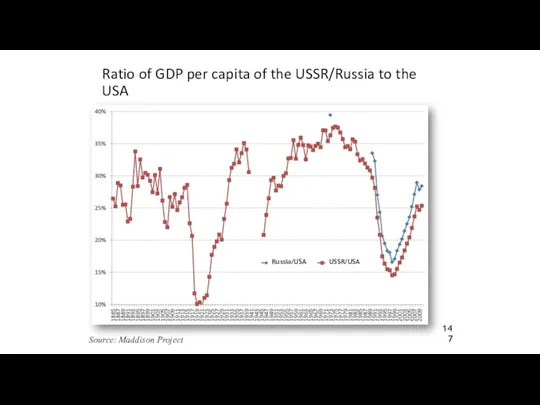
Ratio of GDP per capita of the USSR/Russia to the USA
Source:
Ratio of GDP per capita of the USSR/Russia to the USA
Source:
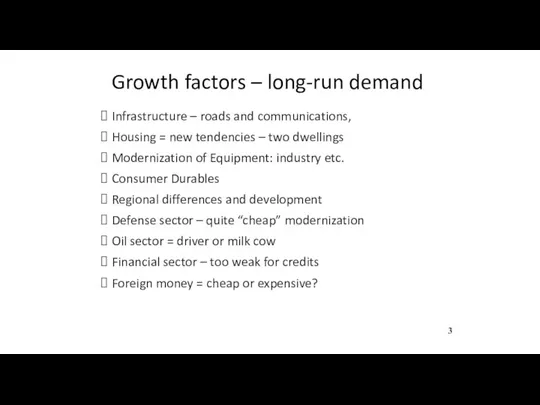
Growth factors – long-run demand
Infrastructure – roads and communications,
Housing = new
Growth factors – long-run demand
Infrastructure – roads and communications,
Housing = new
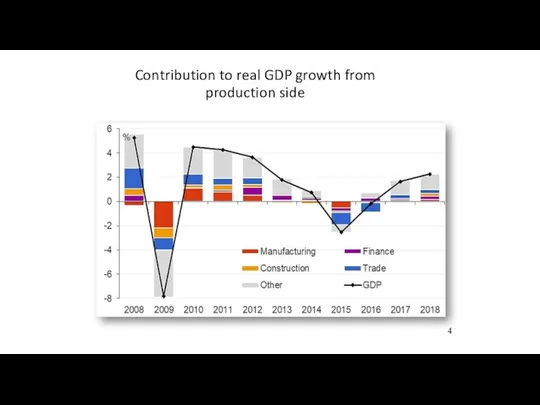
Contribution to real GDP growth from production side
4
Contribution to real GDP growth from production side
4

Contribution to real GDP growth from demand side
5
Contribution to real GDP growth from demand side
5
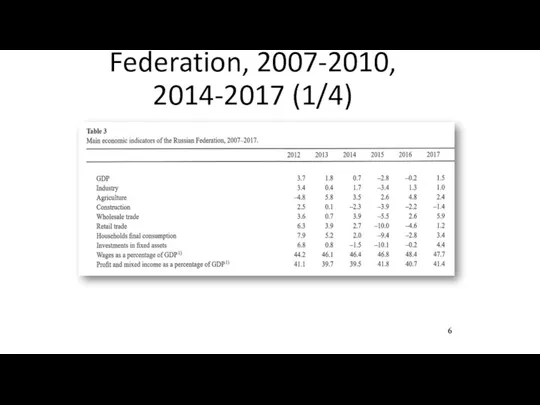
Main economic indicators of the Russian Federation, 2007-2010, 2014-2017 (1/4)
6
Main economic indicators of the Russian Federation, 2007-2010, 2014-2017 (1/4)
6
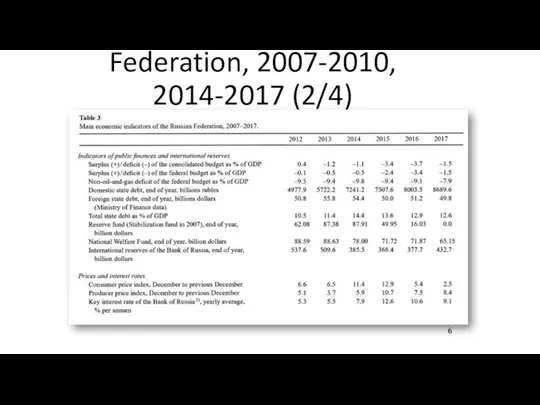
Main economic indicators of the Russian Federation, 2007-2010, 2014-2017 (2/4)
6
Main economic indicators of the Russian Federation, 2007-2010, 2014-2017 (2/4)
6
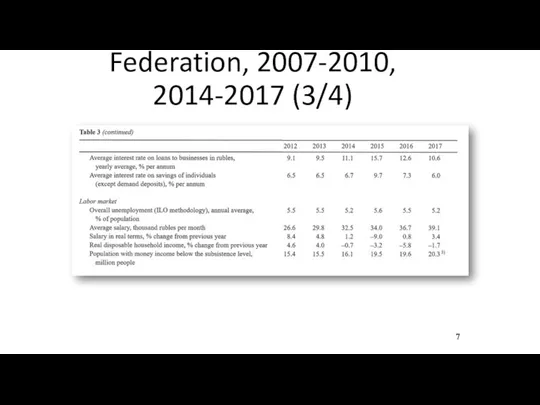
Main economic indicators of the Russian Federation, 2007-2010, 2014-2017 (3/4)
7
Main economic indicators of the Russian Federation, 2007-2010, 2014-2017 (3/4)
7
Main economic indicators of the Russian Federation, 2007-2010,
2014-2017 (4/4)
8
Main economic indicators of the Russian Federation, 2007-2010,
2014-2017 (4/4)
8
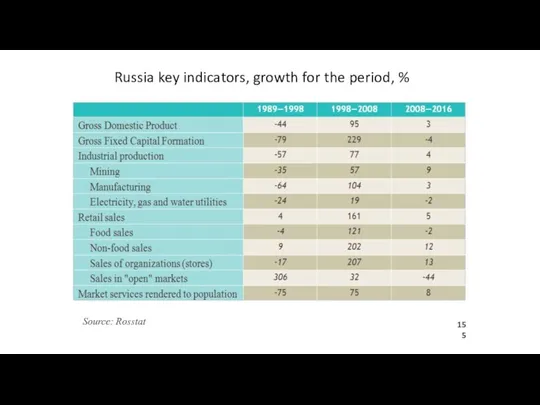
Russia key indicators, growth for the period, %
Source: Rosstat
Russia key indicators, growth for the period, %
Source: Rosstat
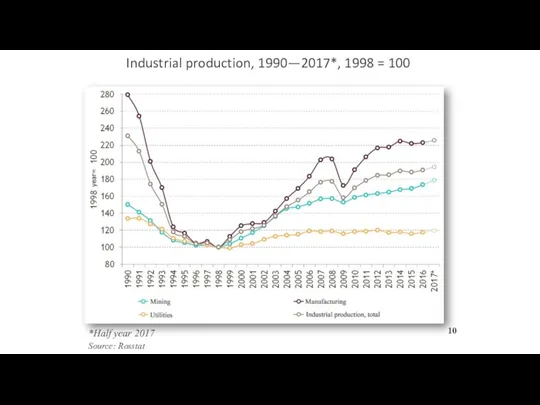
Industrial production, 1990—2017*, 1998 = 100
*Half year 2017
Source: Rosstat
10
Industrial production, 1990—2017*, 1998 = 100
*Half year 2017
Source: Rosstat
10
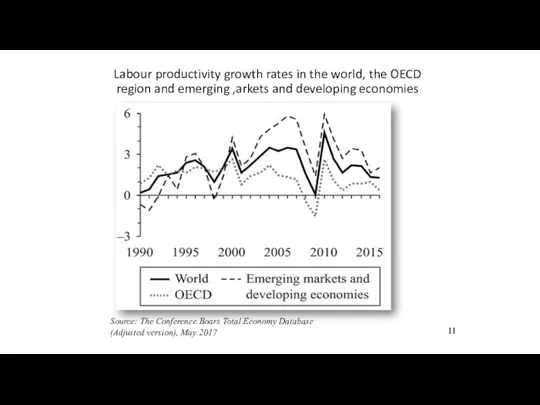
Labour productivity growth rates in the world, the OECD region and
Labour productivity growth rates in the world, the OECD region and
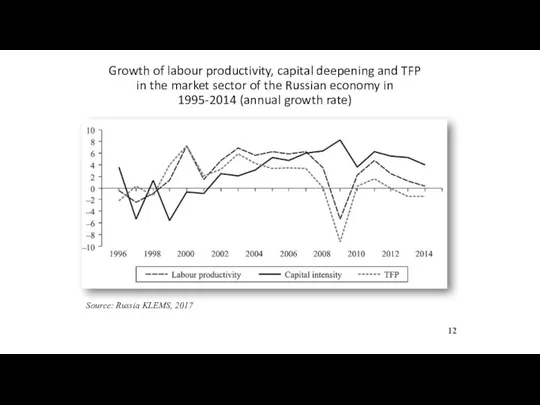
Growth of labour productivity, capital deepening and TFP in the market
Growth of labour productivity, capital deepening and TFP in the market
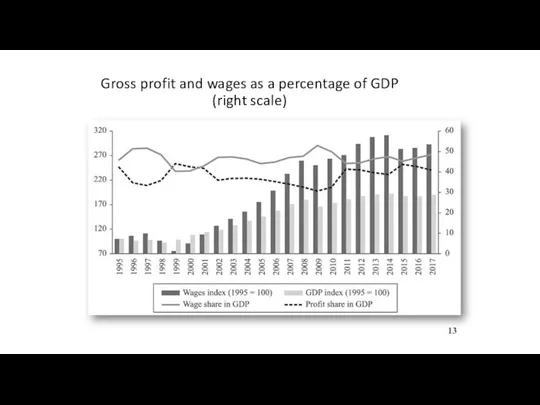
Gross profit and wages as a percentage of GDP (right scale)
13
Gross profit and wages as a percentage of GDP (right scale)
13
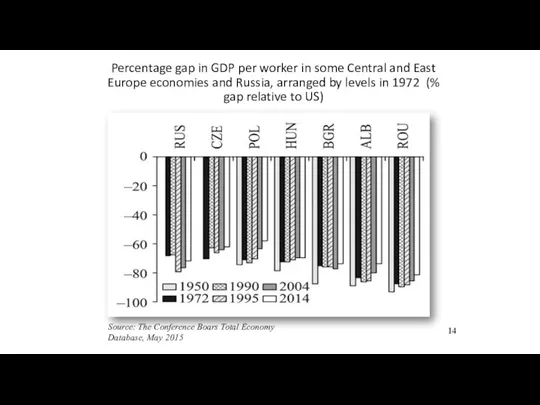
Percentage gap in GDP per worker in some Central and East
Percentage gap in GDP per worker in some Central and East
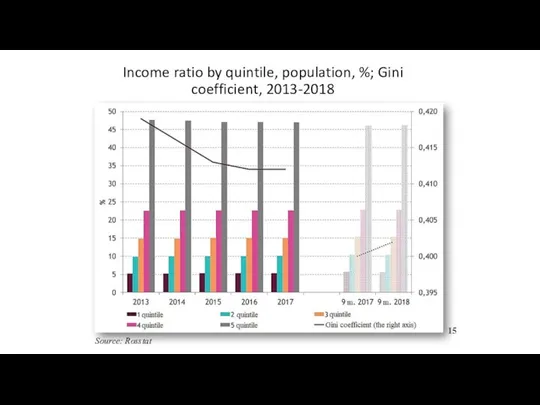
Income ratio by quintile, population, %; Gini coefficient, 2013-2018
Source: Rosstat
15
Income ratio by quintile, population, %; Gini coefficient, 2013-2018
Source: Rosstat
15

Population income distribution, thousand roubles, 2013-2018
Source: Rosstat
16
Population income distribution, thousand roubles, 2013-2018
Source: Rosstat
16
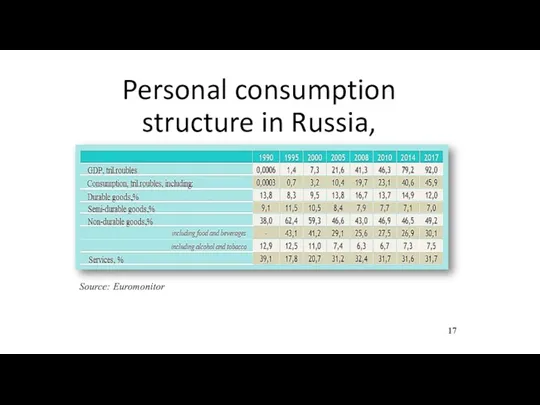
Personal consumption structure in Russia, 1990-2017
Source: Euromonitor
17
Personal consumption structure in Russia, 1990-2017
Source: Euromonitor
17
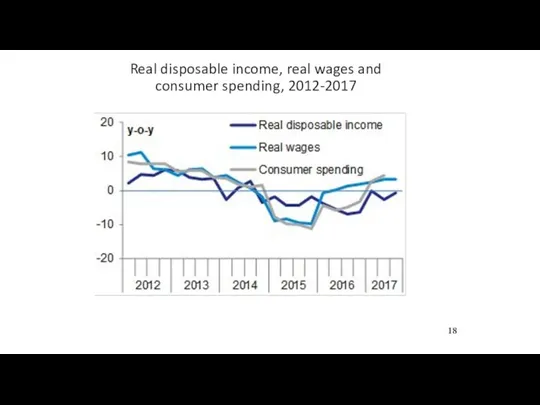
Real disposable income, real wages and consumer spending, 2012-2017
18
Real disposable income, real wages and consumer spending, 2012-2017
18
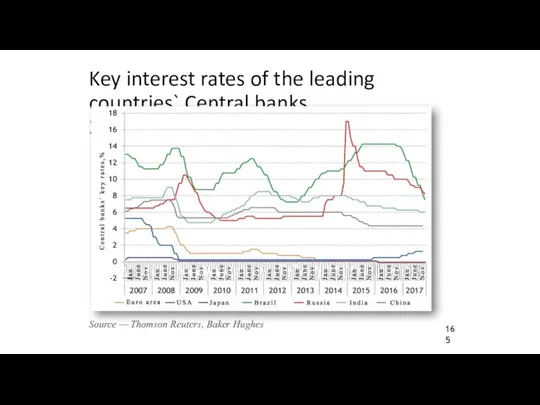
Key interest rates of the leading countries` Central banks, 2007–2017
Source — Thomson
Key interest rates of the leading countries` Central banks, 2007–2017
Source — Thomson
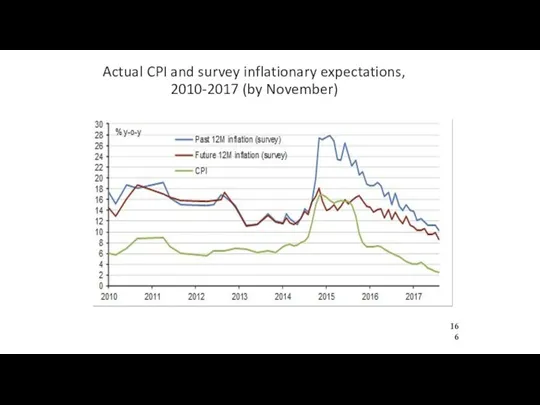
Actual CPI and survey inflationary expectations, 2010-2017 (by November)
Actual CPI and survey inflationary expectations, 2010-2017 (by November)
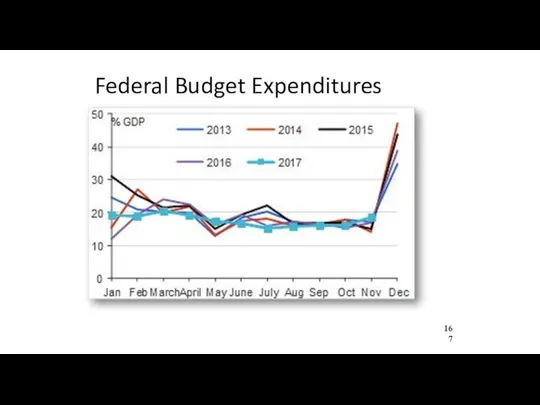
Federal Budget Expenditures
Federal Budget Expenditures
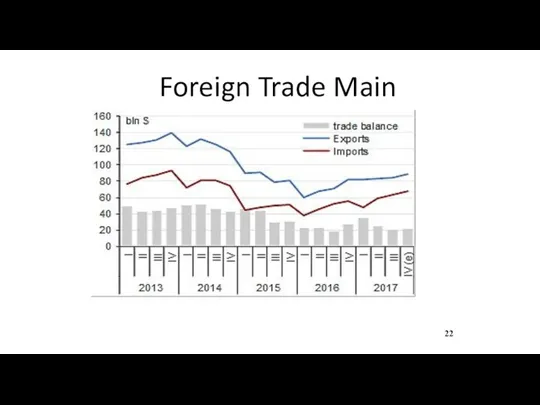
Foreign Trade Main Parameters
22
Foreign Trade Main Parameters
22
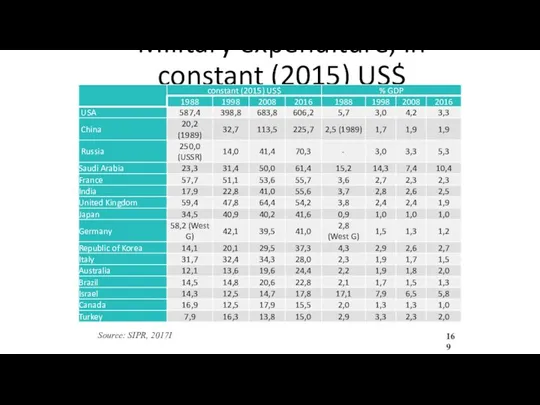
Military expenditure, in constant (2015) US$
Source: SIPR, 2017I
Military expenditure, in constant (2015) US$
Source: SIPR, 2017I

CPI, key interest rate CBR, ruble to $ rate and key
CPI, key interest rate CBR, ruble to $ rate and key
Share of households in possession of some household durables and gadgets
Share of households in possession of some household durables and gadgets
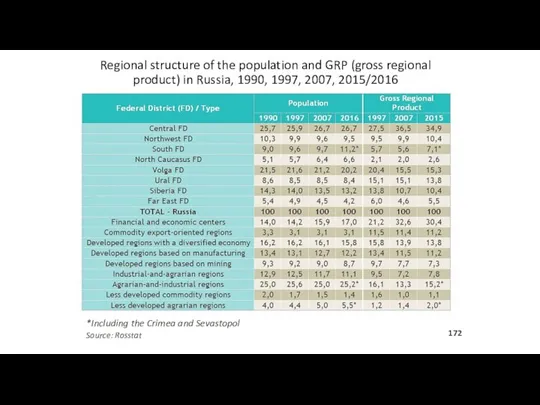
Regional structure of the population and GRP (gross regional product) in
Regional structure of the population and GRP (gross regional product) in
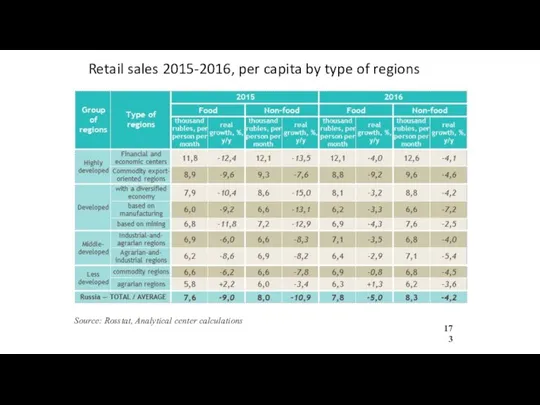
Retail sales 2015-2016, per capita by type of regions
Source: Rosstat, Analytical
Retail sales 2015-2016, per capita by type of regions
Source: Rosstat, Analytical
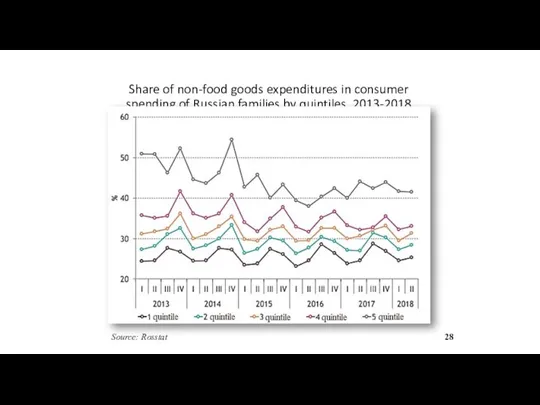
Share of non-food goods expenditures in consumer spending of Russian families
Share of non-food goods expenditures in consumer spending of Russian families
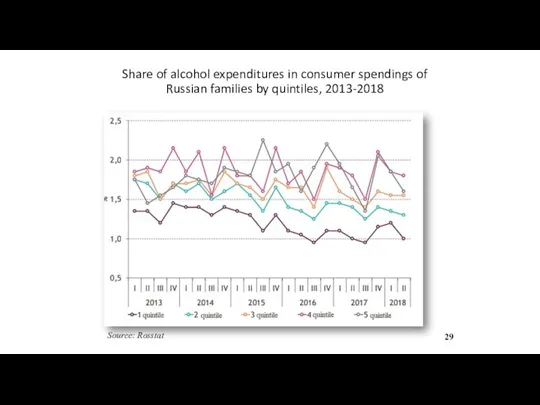
Share of alcohol expenditures in consumer spendings of Russian families by
Share of alcohol expenditures in consumer spendings of Russian families by
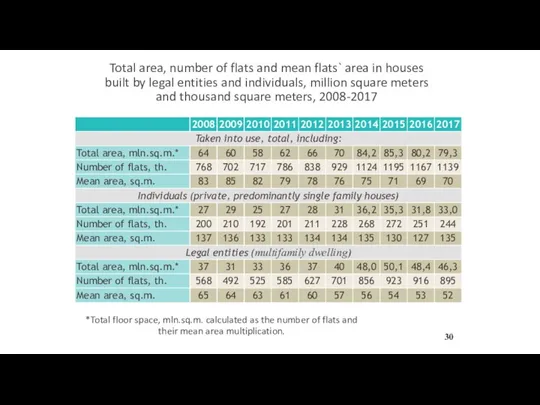
Total area, number of flats and mean flats` area in houses
Total area, number of flats and mean flats` area in houses

Recession and implications
Recession is difficult for everybody
Unofficial evaluations gave the loss
Recession and implications
Recession is difficult for everybody
Unofficial evaluations gave the loss

Conclusion: Russia
Russia has made the detour from European income distribution
Conclusion: Russia
Russia has made the detour from European income distribution

Literature:
Voskoboynikov, I. "Sources of long run economic growth in Russia before
Literature:
Voskoboynikov, I. "Sources of long run economic growth in Russia before
Professor Leonid Grigoryev
www.leonidgrigoryev.com
Economy & Energy
18.02.2019
Professor Leonid Grigoryev
www.leonidgrigoryev.com
Economy & Energy
18.02.2019
Energy – history and theory
Energy waves – replacement by efficiency, costs,
Energy – history and theory
Energy waves – replacement by efficiency, costs,
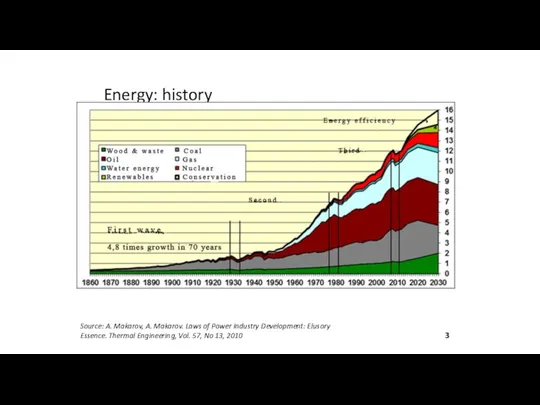
Energy: history
Source: A. Makarov, A. Makarov. Laws of Power Industry Development:
Energy: history
Source: A. Makarov, A. Makarov. Laws of Power Industry Development:
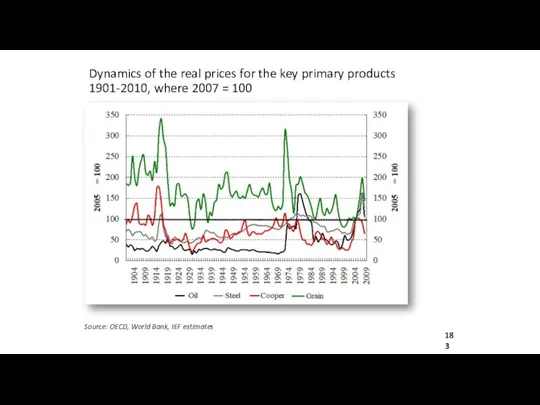
Dynamics of the real prices for the key primary products
1901-2010, where
Dynamics of the real prices for the key primary products 1901-2010, where
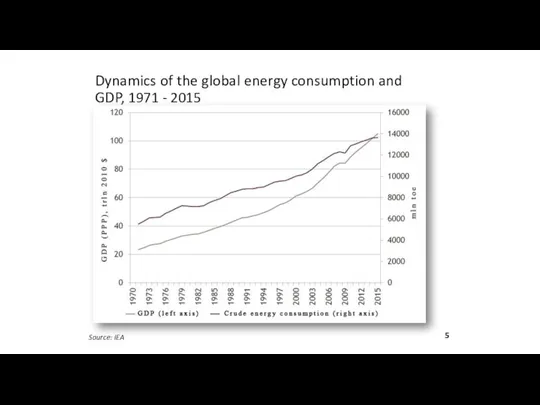
Dynamics of the global energy consumption and GDP, 1971 - 2015
Source:
Dynamics of the global energy consumption and GDP, 1971 - 2015
Source:
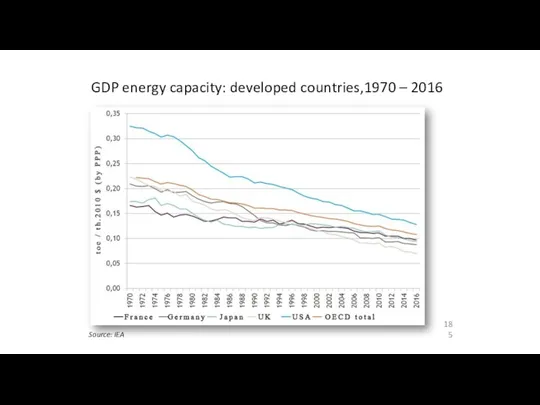
GDP energy capacity: developed countries,1970 – 2016
Source: IEA
GDP energy capacity: developed countries,1970 – 2016
Source: IEA
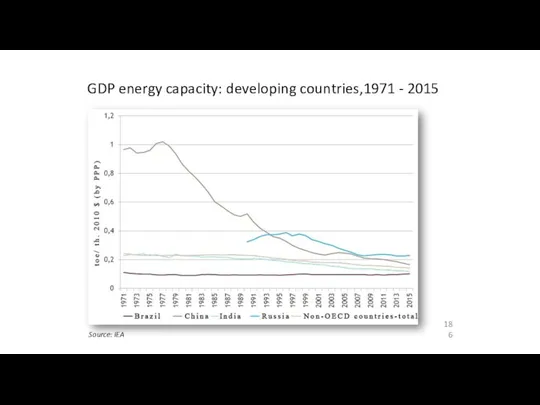
GDP energy capacity: developing countries,1971 - 2015
Source: IEA
GDP energy capacity: developing countries,1971 - 2015
Source: IEA
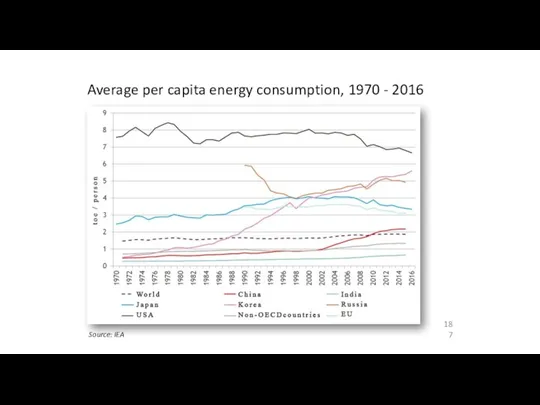
Average per capita energy consumption, 1970 - 2016
Source: IEA
Average per capita energy consumption, 1970 - 2016
Source: IEA
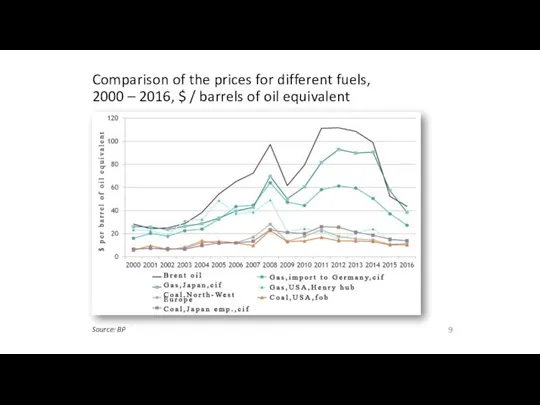
Comparison of the prices for different fuels,
2000 – 2016, $
Comparison of the prices for different fuels, 2000 – 2016, $
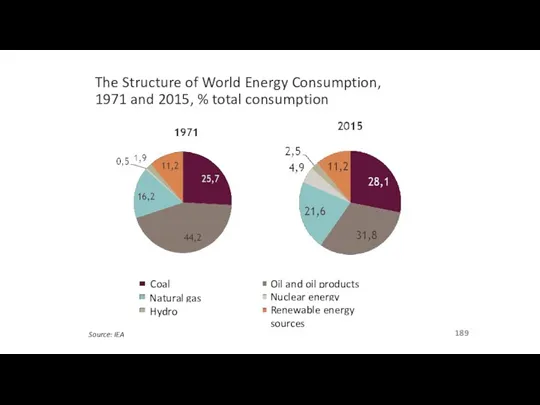
The Structure of World Energy Consumption,
1971 and 2015, % total consumption
Source:
The Structure of World Energy Consumption,
1971 and 2015, % total consumption
Source:
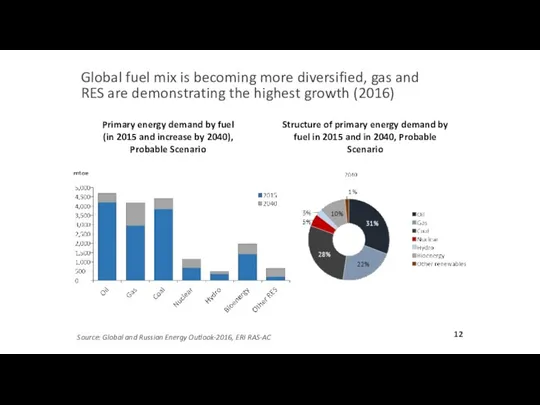
Primary energy demand by fuel
(in 2015 and increase by 2040),
Primary energy demand by fuel
(in 2015 and increase by 2040),
Geopolitics & Rational Changes
Growth and Energy consumption
Embargo of Arab OPEC 1973
Geopolitics & Rational Changes
Growth and Energy consumption
Embargo of Arab OPEC 1973

World GDP and Trade Growth rate, %, 1995‑2018
Source: IMF, WEO April
World GDP and Trade Growth rate, %, 1995‑2018
Source: IMF, WEO April
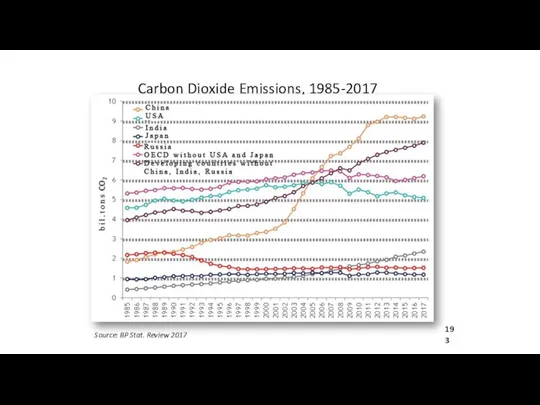
Carbon Dioxide Emissions, 1985-2017
Source: BP Stat. Review 2017
Carbon Dioxide Emissions, 1985-2017
Source: BP Stat. Review 2017
Geopolitics steps over trade, development
and Global problems’ solutions
World is losing stability
Geopolitics steps over trade, development
and Global problems’ solutions
World is losing stability
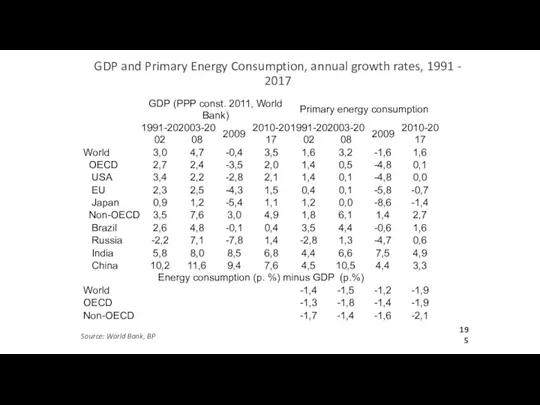
GDP and Primary Energy Consumption, annual growth rates, 1991 - 2017
Source:
GDP and Primary Energy Consumption, annual growth rates, 1991 - 2017
Source:
Oil and Gas Consumption, annual growth rates, 1991 - 2017
Source: World
Oil and Gas Consumption, annual growth rates, 1991 - 2017
Source: World

Coal consumption and Electricity generation, annual growth rates, 1991 - 2017
Source:
Coal consumption and Electricity generation, annual growth rates, 1991 - 2017
Source:
Global Energy Balance, mln tons, 2015
Source: IEA
Global Energy Balance, mln tons, 2015
Source: IEA
Energy poverty
Source: IEA, World Energy Outlook 2017
20
Energy poverty
Source: IEA, World Energy Outlook 2017
20
Global energy supply investment in 2014 – 2035, IEA estimate (2014),
Global energy supply investment in 2014 – 2035, IEA estimate (2014),
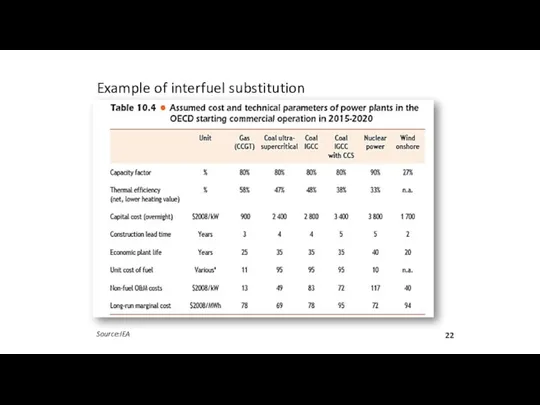
Example of interfuel substitution
Source:IEA
22
Example of interfuel substitution
Source:IEA
22
OPEC & RUSSIA
OPEC & RUSSIA
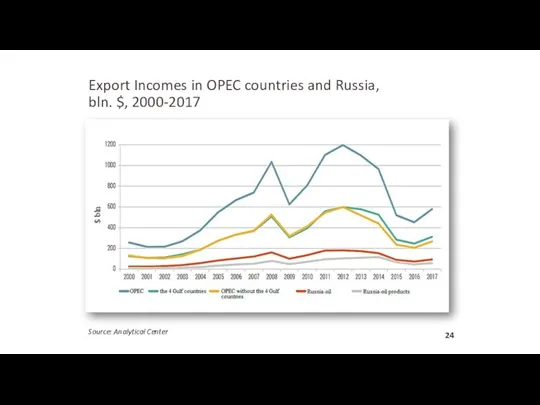
Export Incomes in OPEC countries and Russia,
bln. $, 2000-2017
Source: Analytical
Export Incomes in OPEC countries and Russia,
bln. $, 2000-2017
Source: Analytical

The acceptable price in budget leveraging, 2000-2017
The acceptable price in budget leveraging, 2000-2017
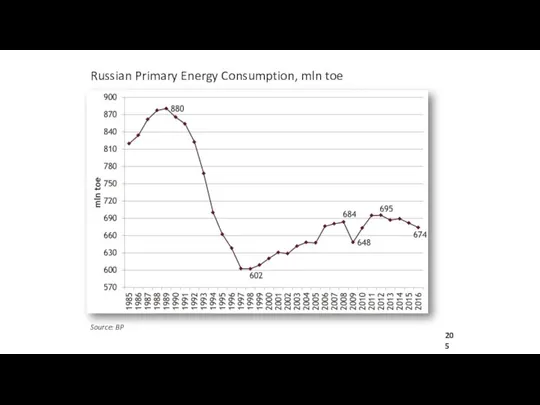
Source: BP
Russian Primary Energy Consumption, mln toe
Source: BP
Russian Primary Energy Consumption, mln toe
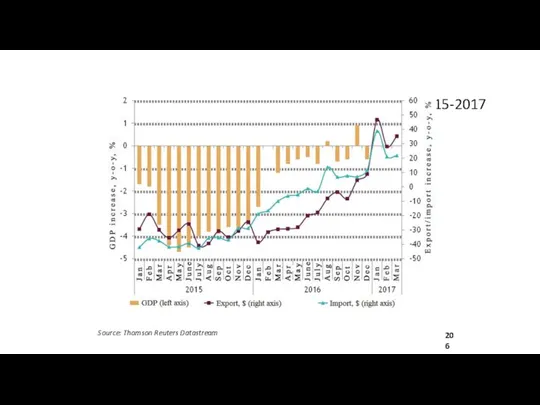
GDP, export and import of Russia, y/y, 2015-2017
Source: Thomson Reuters Datastream
GDP, export and import of Russia, y/y, 2015-2017
Source: Thomson Reuters Datastream

Russian export of energy, mln toe
Source: ERI RAS
Russian export of energy, mln toe
Source: ERI RAS
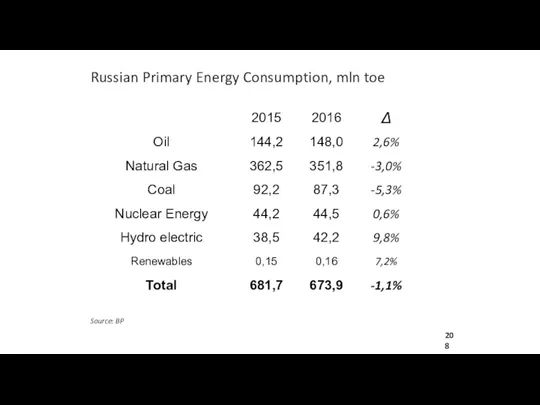
Source: BP
Russian Primary Energy Consumption, mln toe
Source: BP
Russian Primary Energy Consumption, mln toe
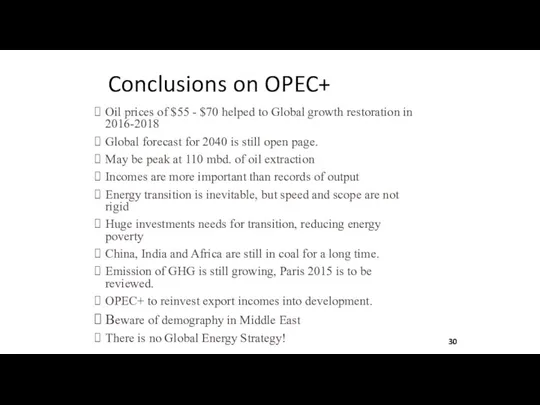
Conclusions on OPEC+
Oil prices of $55 - $70 helped to Global
Conclusions on OPEC+
Oil prices of $55 - $70 helped to Global

World Energy Transition and Future
World is undergoing Energy transition, but still
World Energy Transition and Future
World is undergoing Energy transition, but still
Literature 1
Григорьев Л.М., Чапыгина А.В. «Саудовская Аравия – нефть и развитие»,
Literature 1
Григорьев Л.М., Чапыгина А.В. «Саудовская Аравия – нефть и развитие»,
Literature 2
“Global and Russian Energy Outlook Up To 2040”, IES, RAS,2016
Literature 2
“Global and Russian Energy Outlook Up To 2040”, IES, RAS,2016
Macro &
4.03.2019
Professor Leonid Grigoryev
HSE, Moscow
www.leonidgrigoryev.com
Macro &
4.03.2019
Professor Leonid Grigoryev
HSE, Moscow
www.leonidgrigoryev.com

Upcoming events
4 of March – Macro light questions for students
11
Upcoming events
4 of March – Macro light questions for students
11
Ratio of GDP per capita of the USSR/Russia to the USA
Source:
Ratio of GDP per capita of the USSR/Russia to the USA
Source:

Growth factors – long-run demand
Infrastructure – roads and communications,
Housing = new
Growth factors – long-run demand
Infrastructure – roads and communications,
Housing = new
Source: Haver Analytics
4
Source: Haver Analytics
4
Contribution to real GDP growth from production side
5
Contribution to real GDP growth from production side
5
Contribution to real GDP growth from demand side
6
Contribution to real GDP growth from demand side
6
Main economic indicators of the Russian Federation, 2007-2010, 2014-2017 (1/3)
7
Main economic indicators of the Russian Federation, 2007-2010, 2014-2017 (1/3)
7
Main economic indicators of the Russian Federation, 2007-2010, 2014-2017 (2/3)
8
Main economic indicators of the Russian Federation, 2007-2010, 2014-2017 (2/3)
8
Main economic indicators of the Russian Federation, 2007-2010, 2014-2017 (3/3)
9
Main economic indicators of the Russian Federation, 2007-2010, 2014-2017 (3/3)
9
Industrial production, 1990—2017*, 1998 = 100
*Half year 2017
Source: Rosstat
10
Industrial production, 1990—2017*, 1998 = 100
*Half year 2017
Source: Rosstat
10

Gross profit and wages as a percentage of GDP (right scale)
11
Gross profit and wages as a percentage of GDP (right scale)
11
Income ratio by quintile, population, %; Gini coefficient, 2013-2018
Source: Rosstat
12
Income ratio by quintile, population, %; Gini coefficient, 2013-2018
Source: Rosstat
12
Population income distribution, thousand roubles, 2013-2018
Source: Rosstat
13
Population income distribution, thousand roubles, 2013-2018
Source: Rosstat
13
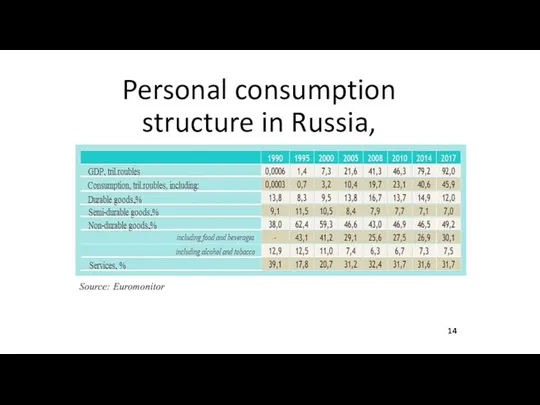
Personal consumption structure in Russia, 1990-2017
Source: Euromonitor
14
Personal consumption structure in Russia, 1990-2017
Source: Euromonitor
14

Share of households in possession of some household durables and gadgets
Share of households in possession of some household durables and gadgets

Actual CPI and survey inflationary expectations, 2010-2017 (by November)
16
Actual CPI and survey inflationary expectations, 2010-2017 (by November)
16
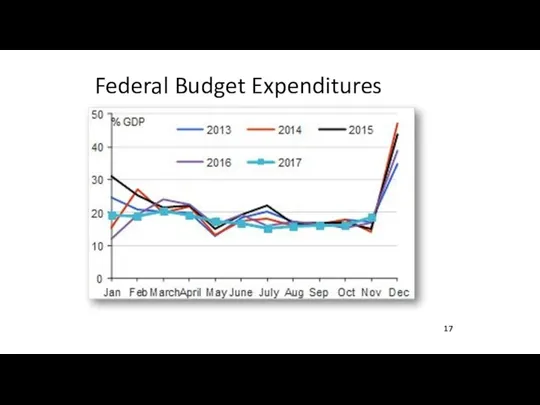
Federal Budget Expenditures
17
Federal Budget Expenditures
17
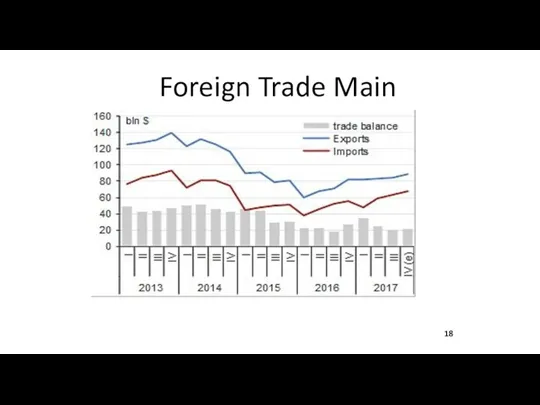
Foreign Trade Main Parameters
18
Foreign Trade Main Parameters
18

Military expenditure, in constant (2015) US$
19
Source: SIPR, 2017I
Military expenditure, in constant (2015) US$
19
Source: SIPR, 2017I
Relative Stability
of main economic indicators
Relative Stability
of main economic indicators
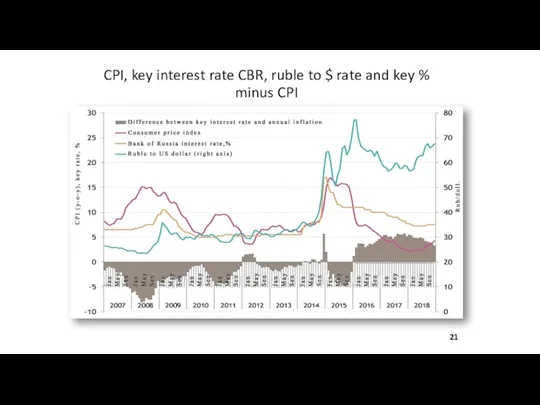
CPI, key interest rate CBR, ruble to $ rate and key
CPI, key interest rate CBR, ruble to $ rate and key
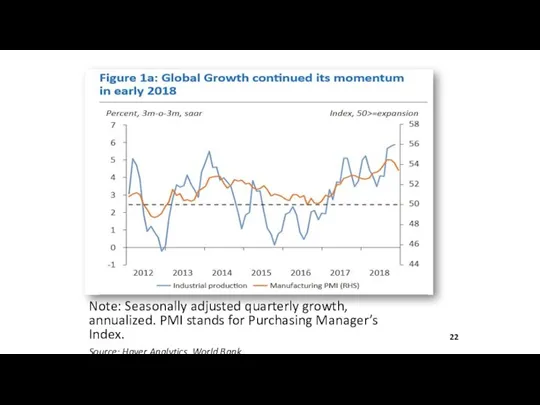
Note: Seasonally adjusted quarterly growth, annualized. PMI stands for Purchasing Manager’s
Note: Seasonally adjusted quarterly growth, annualized. PMI stands for Purchasing Manager’s
Source: CBR and Haver Analytics
23
Source: CBR and Haver Analytics
23
*SA – Seasonally Adjusted
Source: Rosstat and Haver Analytics
24
*SA – Seasonally Adjusted
Source: Rosstat and Haver Analytics
24
Source: CBR
25
Source: CBR
25
Source: CBR.
26
Source: CBR.
26
Source: CBR
27
Source: CBR
27
Source: Rosstat, World Bank
28
Source: Rosstat, World Bank
28
Recession and implications
Recession is difficult for everybody
Unofficial evaluations gave the loss
Recession and implications
Recession is difficult for everybody
Unofficial evaluations gave the loss
Conclusion: Russia
Russia has made the detour from European income distribution
Conclusion: Russia
Russia has made the detour from European income distribution
 Reported questions. What is important?
 Moscow is the capital of Russia
 Millionaire-modal auxiliares
 First conditional for possibilities
 Virus which gave birth to racism
 Инфинитив и герундий
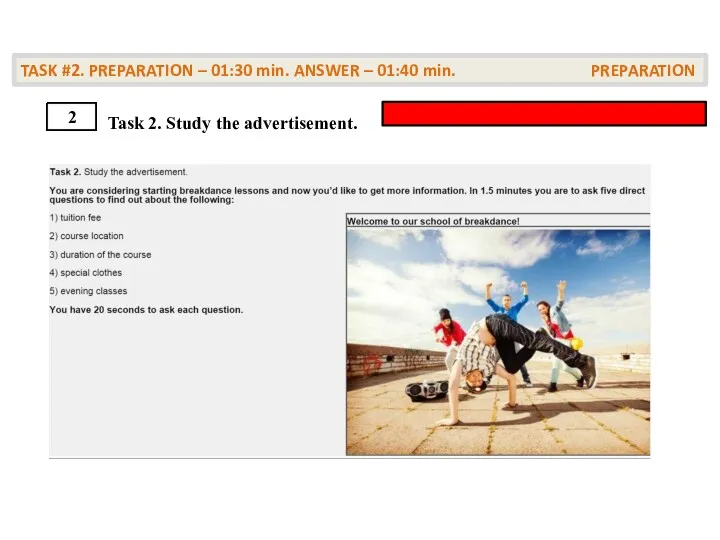 Study the advertisement. Preparation
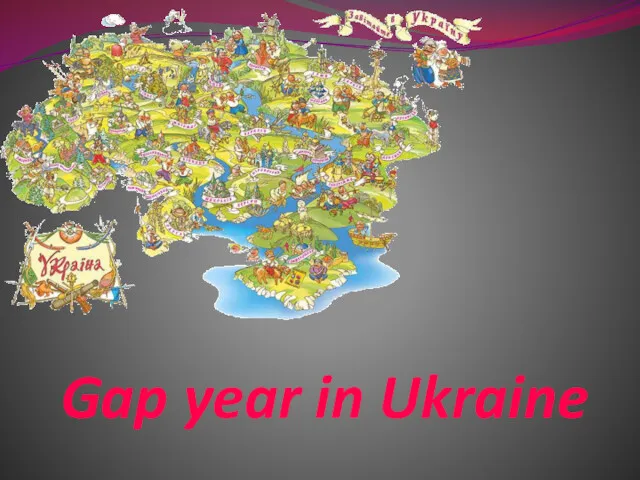 Gap year in Ukraine
 My family!
 Learning Styles
 Let's go to school
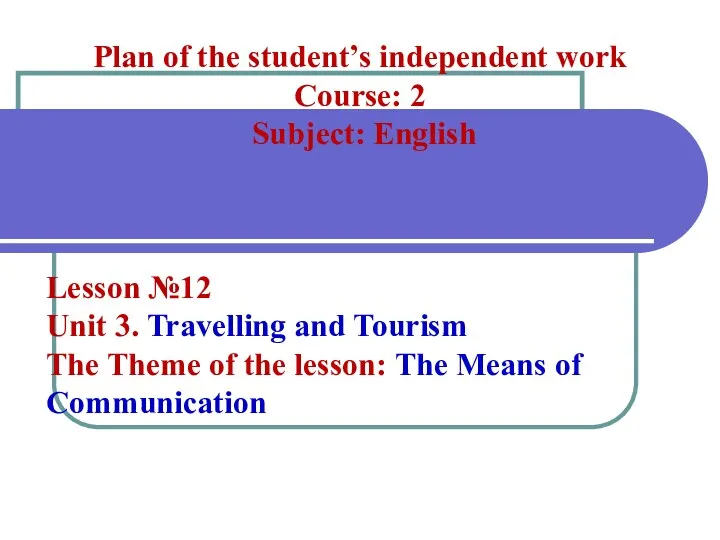 The Means of Communication
 Интерактивный тренажер Colors and Animals - 1
 Новая Зеландия
 Sports activities games
 Food – basic processes
 Describing pictures
 [w ] White, Well, Winter, Welcome Well, welcome white winter!
 ЕГЭ. Английский язык. Вариант 7
 Degrees of Comparison of Adjectives
 Using games in a foreign language classroom
 Present Perfect or Past Simple
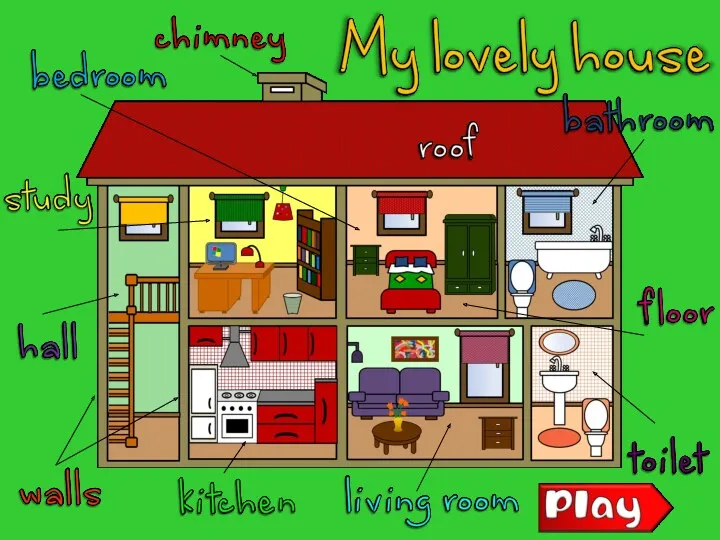 My lovely house game teacher switcher
 An ICT role in key sectors of development of society. Standards in the field of ICT
 Мало Present Simple
 Как написать эссе (письменное высказывание с элементами рассуждения) по английскому языку
 Passive voice in present
 Progress check