- Graphs. A pie chart

Содержание
- 2. a pie chart b bar chart (column chart.) с bar chart d graph
- 3. 1 6 p. m. to 7 p. m. 2 3 a.m. to 4 a.m. 3 7
- 4. 1 The load increases steadily. 2 There is a steady fall in load. 3 There is
- 5. 1 On Sunday, the load does not change between noon and 3 p. m. but on
- 6. Note that the first live verbs are transitive, but reduce and increase can be either transitive
- 7. 1 a From 0 to P the specimen extends in direct proportion to the load applied.
- 8. From 0 to P the specimen (See Figure A) extends in direct proportion to the load
- 9. 1 Ca 0.84%. 2 It falls steadily. 3 The more carbon, the harder the steel. 4
- 10. 1 Steel which contains more than 0.55% carbon 2 More than 1.05%. 3 Mild steel is
- 12. Скачать презентацию

a pie chart
b bar chart (column chart.)
с bar chart
d
a pie chart
b bar chart (column chart.)
с bar chart
d

1 6 p. m. to 7 p. m.
2 3 a.m. to 4 a.m.
3 7
1 6 p. m. to 7 p. m.
2 3 a.m. to 4 a.m.
3 7

1 The load increases steadily.
2 There is a steady fall in load.
3 There is
1 The load increases steadily.
2 There is a steady fall in load.
3 There is

1 On Sunday, the load does not change between noon and 3
1 On Sunday, the load does not change between noon and 3

Note that the first live verbs are transitive, but reduce and
Note that the first live verbs are transitive, but reduce and

1 a From 0 to P the specimen extends in direct
1 a From 0 to P the specimen extends in direct

From 0 to P the specimen (See Figure A) extends in
From 0 to P the specimen (See Figure A) extends in

1 Ca 0.84%.
2 It falls steadily.
3 The more carbon, the harder the steel.
4 It decreases
1 Ca 0.84%.
2 It falls steadily.
3 The more carbon, the harder the steel.
4 It decreases

1 Steel which contains more than 0.55% carbon
2 More than 1.05%.
3 Mild steel is
1 Steel which contains more than 0.55% carbon
2 More than 1.05%.
3 Mild steel is
 Модальный глагол can
 My favorite sportsman
 Present Simple and Present Continuous
 City of Miami
 Books in our life
 Образование множественного числа в английском языке
 Family
 School supplies
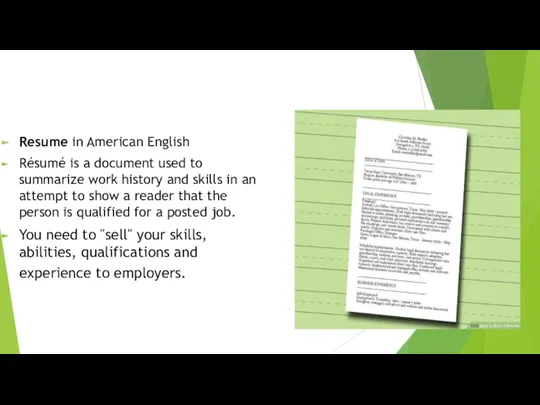 Resume in American English
 Around the town
 Worlds of jobs. Choosing a Career. Урок английского языка. 11 класс
 My Idol Ronaldinho
 Day of week with Disney
 The morphological structure of english words and word-building in english. (Lecture 3-4)
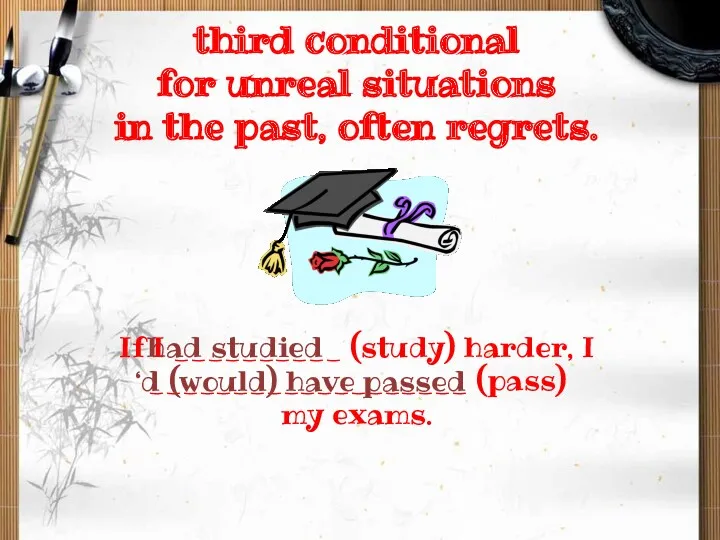 Third conditional for unreal situations in the past, often regrets
 Spotlight-6. Module-2. Lesson 2a
 Epistemology - the doctrine of cognition
 Books and writers
 An Introduction to EAP – Academic Skills in English. Lesson 1
 Hello, dear students!
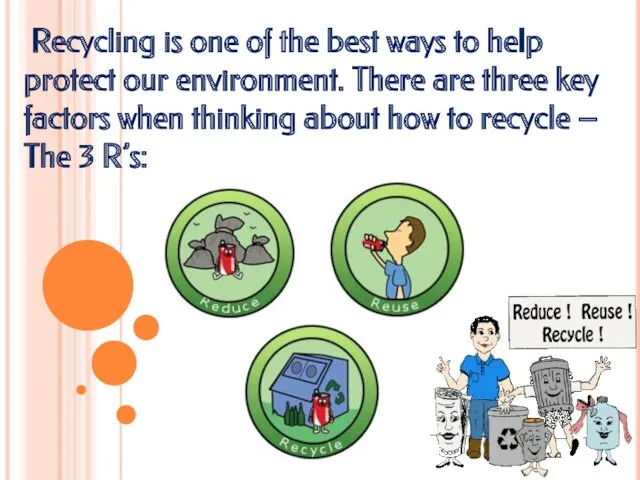 Recycling is one of the best ways to help protect our environment
 Prepositions of time
 Функциональные стили и перевод
 Подготовка к ВПР по английскому языку. Устная часть (7 класс)
 The body
 What are they doing
 Знакомство и представление. Урок 1
 My day