- Preparation of article materials for rating journals

Содержание
- 2. Content Publication types Publication structure Main Elements Title Abstract Data and Methods Results Discussion Miscellaneous Recommendations
- 3. Main Principles Rule 1: A logical path, context, underlying concepts, or results should rest on solid
- 4. Publication types Original research Reviews Systematic review Meta-analysis Case study Opinion Perspective Commentary Letter to the
- 5. Publication: structure Abstract. Offer brief structured summary Introduction. Set the stage, identify significance, novelty, originality; define
- 6. Publication: main elements Title - full and running titles Authorship - roles and affiliation Summaries -
- 7. Publication: main elements Title - full and running titles Summaries - highlights, abstract and conclusions Introduction
- 8. Abstract Outline Fields Disciplines Problem Study design Data source Analysis Results Conclusion 8
- 9. Publication: main elements Data - primary and secondary data sources Methods - order, logic, sequence, notation
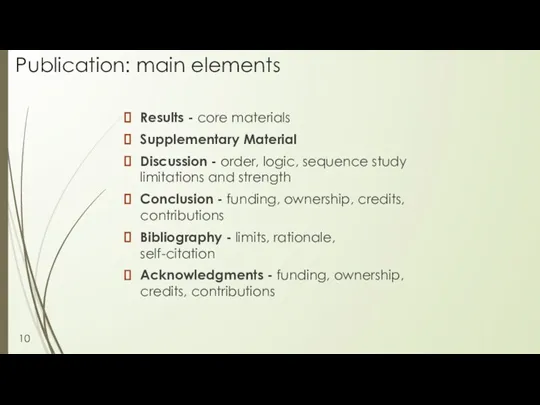
- 10. Publication: main elements Results - core materials Supplementary Material Discussion - order, logic, sequence study limitations
- 11. Use of visuals in a publication Abstract - Graphical Abstract Introduction - Process flow, conceptual mapping
- 12. Schematics, Illustrations, Visuals Process-based Structure-based Figure 1. Schematic of three spatial approaches (S: A, B, and
- 13. Process-based Visuals Time course and cycles -sequence of steps Flow charts - sequence of steps and
- 14. Structure-based Visuals Hierarchy - organization, order, relationships Relationship - properties, qualities, quantities Diagrams - sequence of
- 15. Systematization 15
- 16. Building process- and structure- based graphs: Compilation Relationship Organization Properties Challenges: Complex Take time to understand
- 17. Next steps: Edit, review, seek feedback Repeat 17
- 19. Скачать презентацию
Content
Publication types
Publication structure
Main Elements
Title
Abstract
Data and Methods
Results
Discussion
Miscellaneous
Recommendations
Q&A
Visualization and effective
Content
Publication types
Publication structure
Main Elements
Title
Abstract
Data and Methods
Results
Discussion
Miscellaneous
Recommendations
Q&A
Visualization and effective
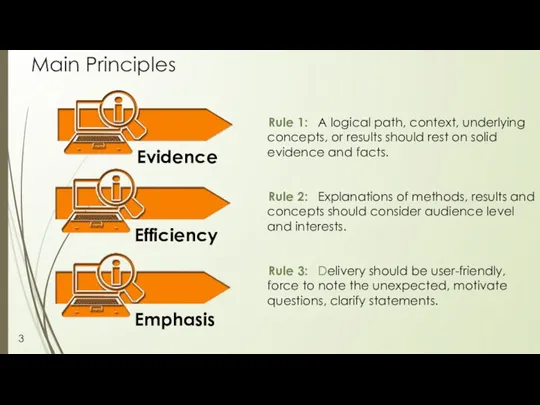
Main Principles
Rule 1: A logical path, context, underlying concepts, or results
Main Principles
Rule 1: A logical path, context, underlying concepts, or results
Publication types
Original research
Reviews
Systematic review
Meta-analysis
Case study
Opinion
Perspective
Commentary
Letter to the Editors
Book
Publication types
Original research
Reviews
Systematic review
Meta-analysis
Case study
Opinion
Perspective
Commentary
Letter to the Editors
Book
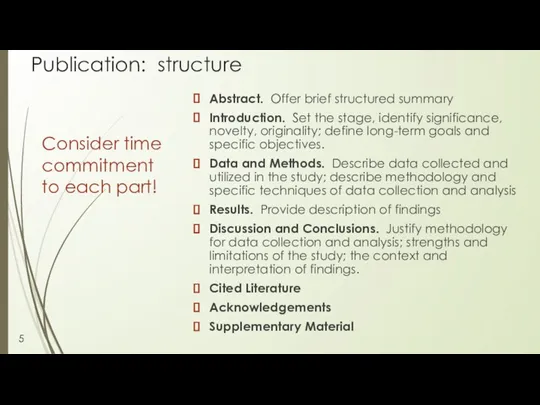
Publication: structure
Abstract. Offer brief structured summary
Introduction. Set the stage, identify significance,
Publication: structure
Abstract. Offer brief structured summary
Introduction. Set the stage, identify significance,
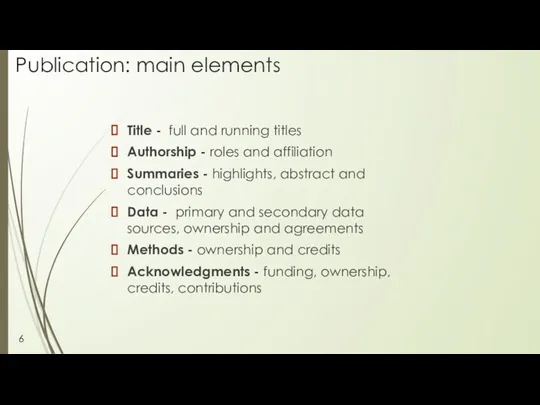
Publication: main elements
Title - full and running titles
Authorship - roles and
Publication: main elements
Title - full and running titles
Authorship - roles and
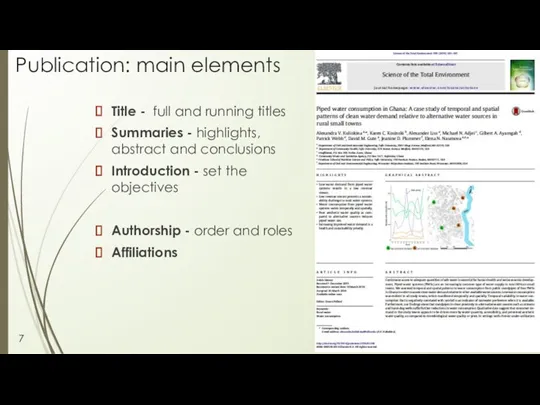
Publication: main elements
Title - full and running titles
Summaries - highlights, abstract
Publication: main elements
Title - full and running titles
Summaries - highlights, abstract
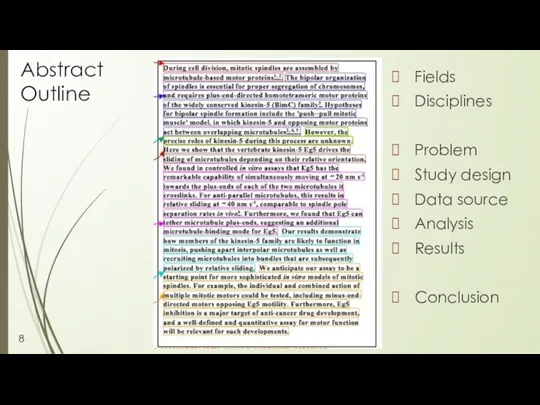
Abstract Outline
Fields
Disciplines
Problem
Study design
Data source
Analysis
Results
Conclusion
8
Abstract Outline
Fields
Disciplines
Problem
Study design
Data source
Analysis
Results
Conclusion
8
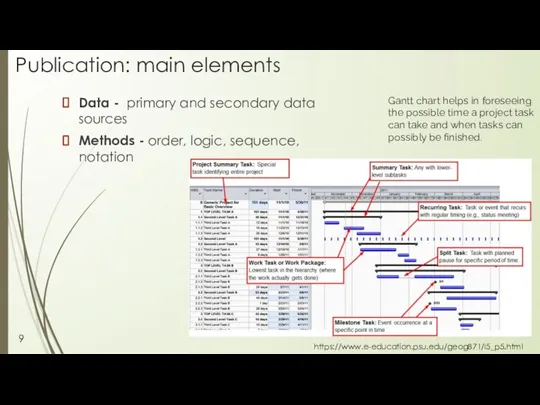
Publication: main elements
Data - primary and secondary data sources
Methods - order, logic,
Publication: main elements
Data - primary and secondary data sources
Methods - order, logic,
Publication: main elements
Results - core materials
Supplementary Material
Discussion - order, logic, sequence study
Publication: main elements
Results - core materials
Supplementary Material
Discussion - order, logic, sequence study
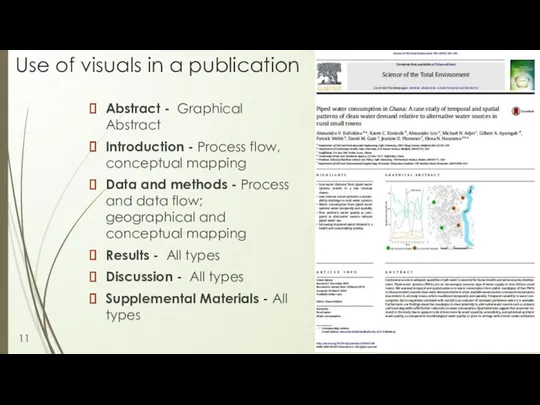
Use of visuals in a publication
Abstract - Graphical Abstract
Introduction - Process
Use of visuals in a publication
Abstract - Graphical Abstract
Introduction - Process
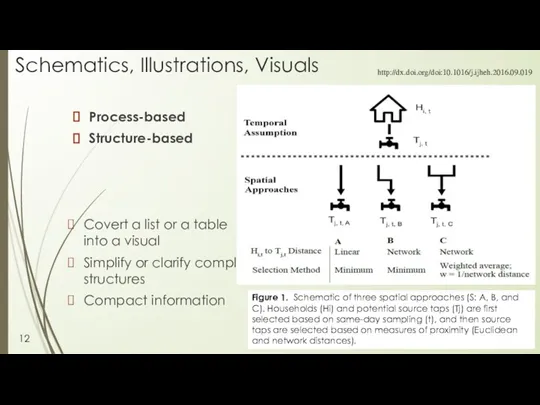
Schematics, Illustrations, Visuals
Process-based
Structure-based
Figure 1. Schematic of three spatial approaches (S: A,
Schematics, Illustrations, Visuals
Process-based
Structure-based
Figure 1. Schematic of three spatial approaches (S: A,
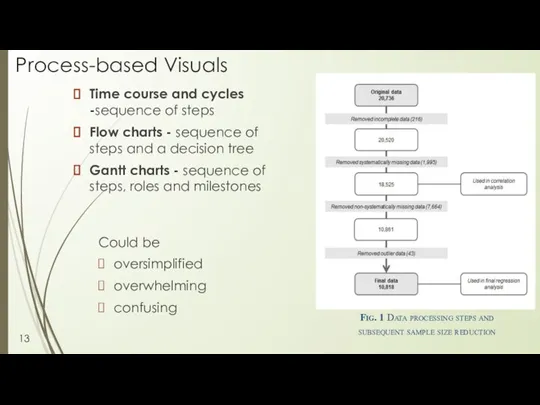
Process-based Visuals
Time course and cycles -sequence of steps
Flow charts -
Process-based Visuals
Time course and cycles -sequence of steps
Flow charts -
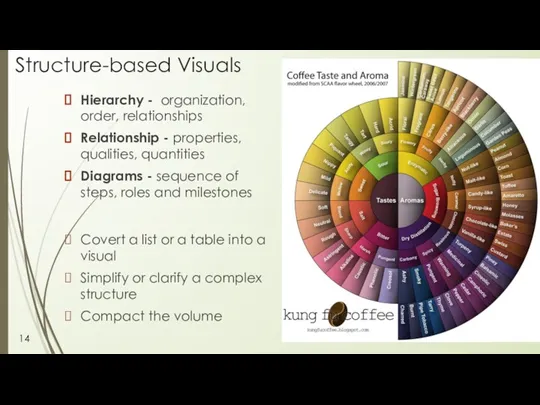
Structure-based Visuals
Hierarchy - organization, order, relationships
Relationship - properties, qualities, quantities
Diagrams -
Structure-based Visuals
Hierarchy - organization, order, relationships
Relationship - properties, qualities, quantities
Diagrams -
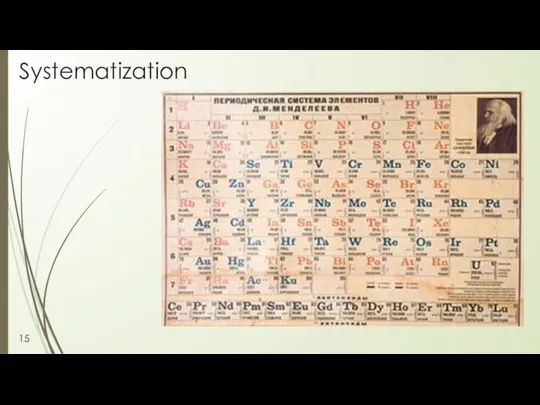
Systematization
15
Systematization
15
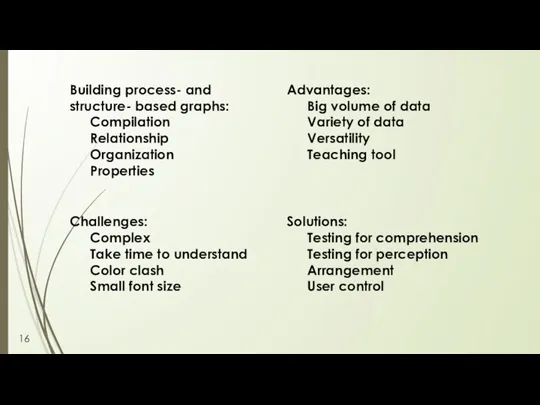
Building process- and structure- based graphs:
Compilation
Relationship
Organization
Properties
Challenges:
Complex
Take time to understand Color clash
Building process- and structure- based graphs:
Compilation
Relationship
Organization
Properties
Challenges:
Complex
Take time to understand Color clash

Next steps:
Edit, review, seek feedback
Repeat
17
Next steps:
Edit, review, seek feedback
Repeat
17
 Months of the year
 Present Simple (Настоящее простое время). Указатели времени
 Предмет истории английского языка. Английский как германский язык. Лекция 1
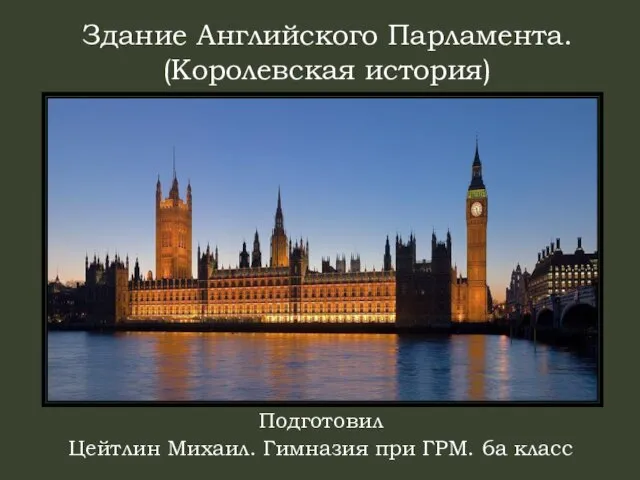 The London Parliament building is known in history as the Palace of Westminster
 Irregular verbs
 Hidden Picture: Berries and сlothes (test)
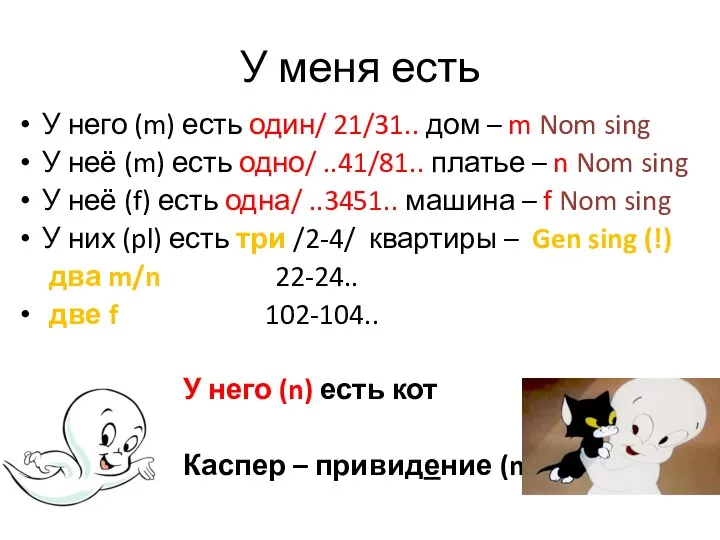 У меня есть
 Much, many or a lot of?
 Finding and Evaluating Academic Sources. Week 1. Lesson 3
 The history of thanksgiving day
 Present indefinite (simple) tense. Настоящее неопределенное (простое) время
 Past Simple ed
 Infinitives
 Wishes I wish I
 Артикли a, an
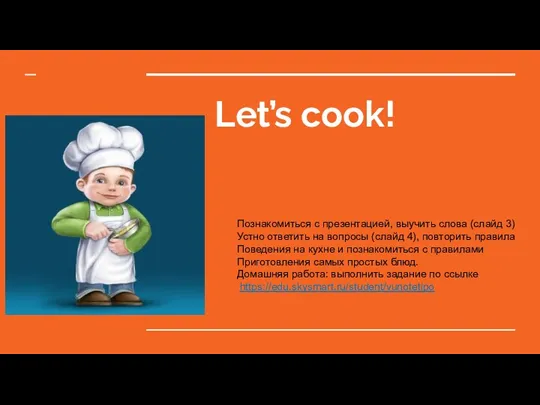 Let’s cook!
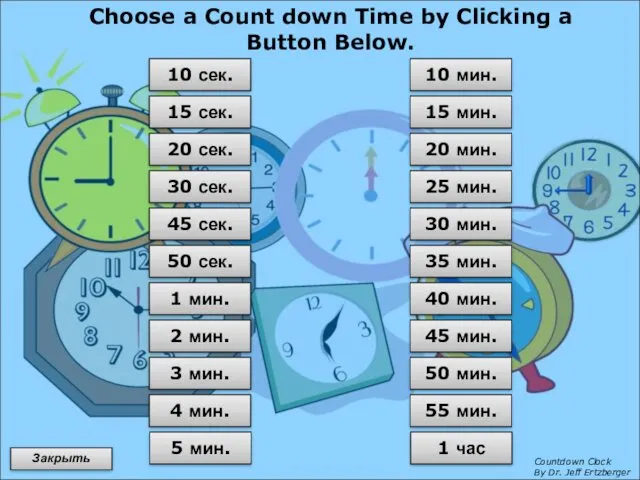 Countdown clock
 Разноцветные ворота. Интегрированный урок английского языка и ИЗО
 Написание заключения
 The Present Continious Tense
 Speakout Pre - Intermediate. Question forms
 Past simple tense
 Тренажёр ОГЭ / ЕГЭ. Pronunciation GHI
 SAT essay is not a typical one
 Fracture Management and Primary Care
 Immunity
 The Origins of Conquest Mentalities and the Nature-Culture Binary
 The United Kingdom of Great Britain and Northern Ireland