- Statistical Terminology

Содержание
- 2. Correlation
- 3. What is correlation? A statistical measurement that shows the relationship between two variables. Example: Height &
- 4. Pearson’s Correlation Coefficient Pearson’s r, which measures a ‘normalized’ covariance (how changes in one value are
- 5. Correlation types Positive correlation An increase in one variable will lead to an increase in the
- 6. Knowledge check Height and weight Vehicle speed and travel time Gasoline prices and global oil production
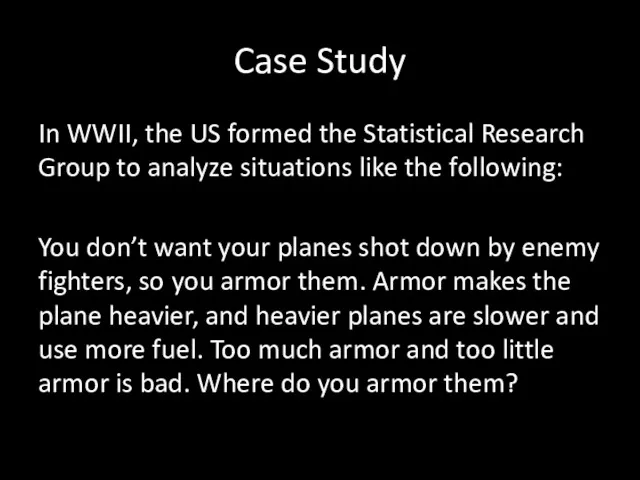
- 7. Case Study In WWII, the US formed the Statistical Research Group to analyze situations like the
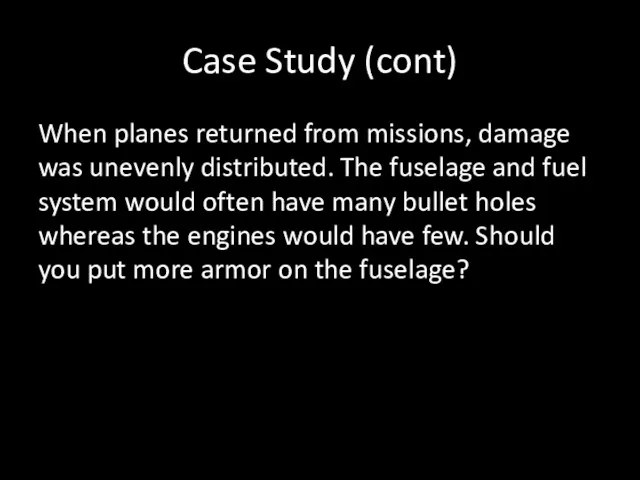
- 8. Case Study (cont) When planes returned from missions, damage was unevenly distributed. The fuselage and fuel
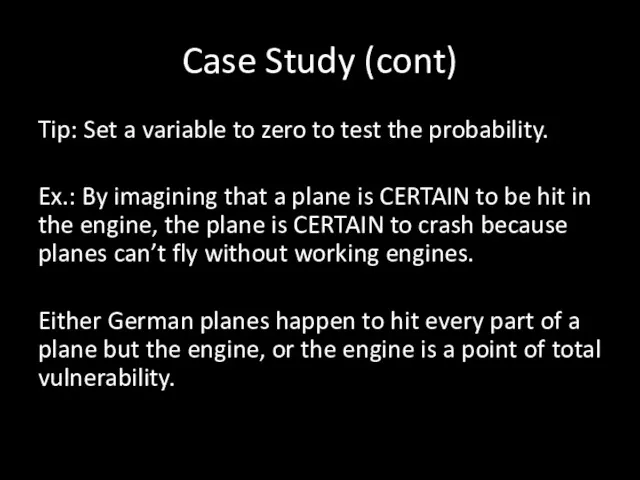
- 9. Case Study (cont) Tip: Set a variable to zero to test the probability. Ex.: By imagining
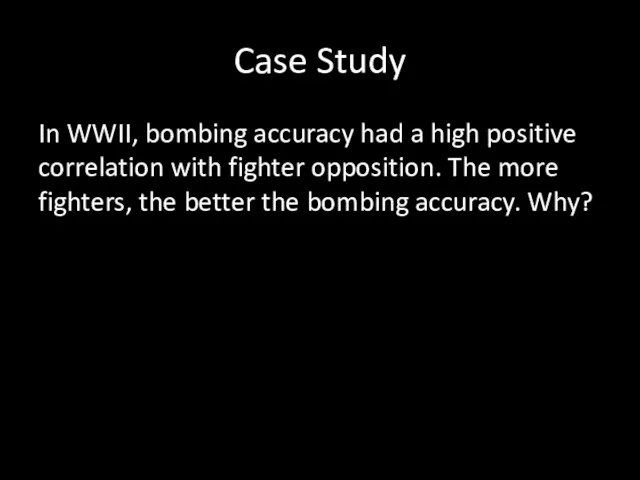
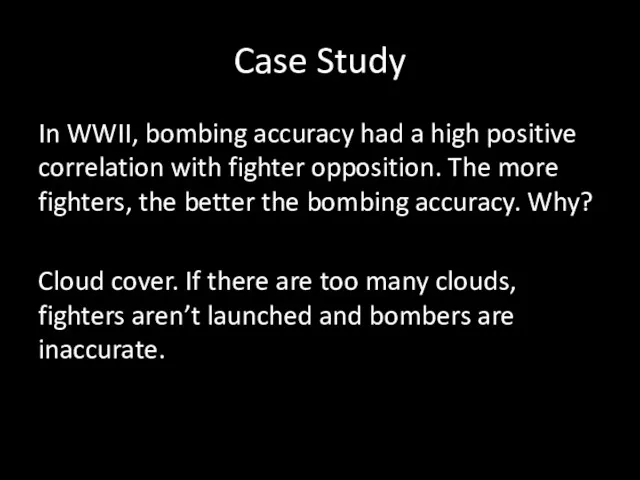
- 10. Case Study In WWII, bombing accuracy had a high positive correlation with fighter opposition. The more
- 11. Case Study In WWII, bombing accuracy had a high positive correlation with fighter opposition. The more
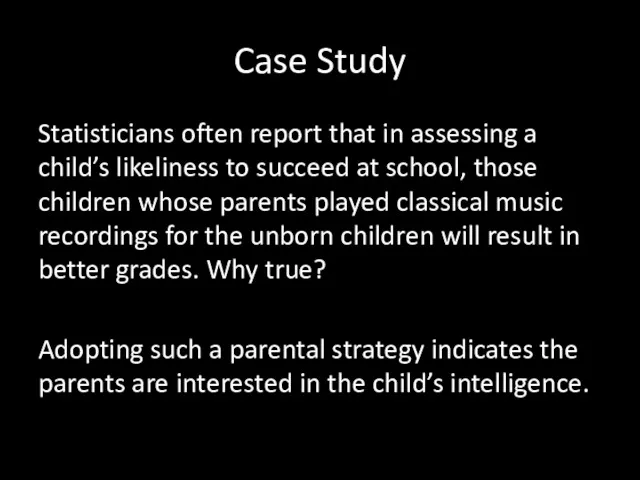
- 12. Case Study Statisticians often report that in assessing a child’s likeliness to succeed at school, those
- 13. Case Study Statisticians often report that in assessing a child’s likeliness to succeed at school, those
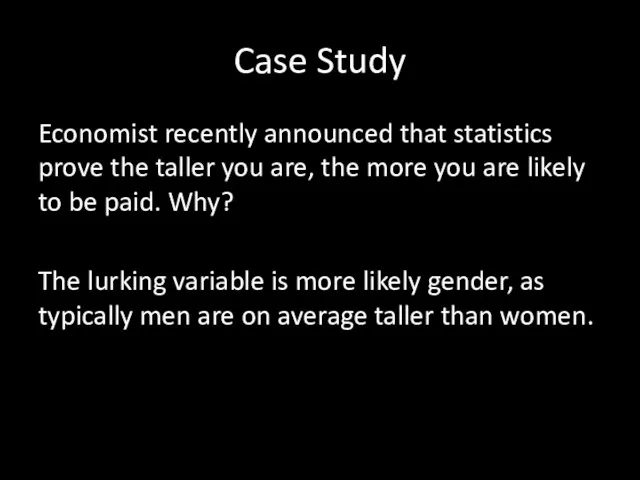
- 14. Case Study Economist recently announced that statistics prove the taller you are, the more you are
- 15. Case Study Economist recently announced that statistics prove the taller you are, the more you are
- 16. Statistical Terminology
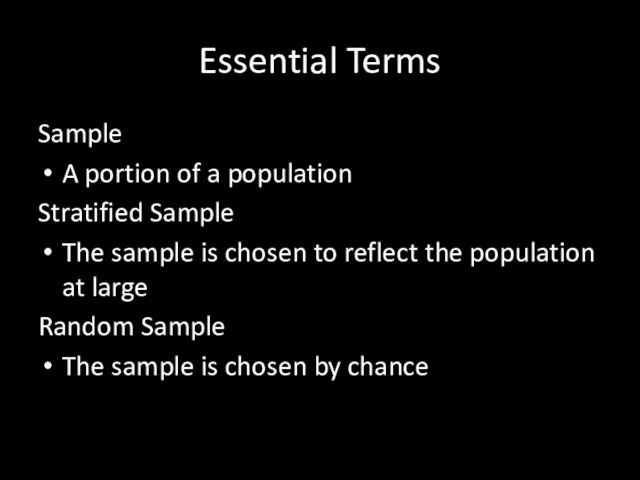
- 17. Essential Terms Sample A portion of a population Stratified Sample The sample is chosen to reflect
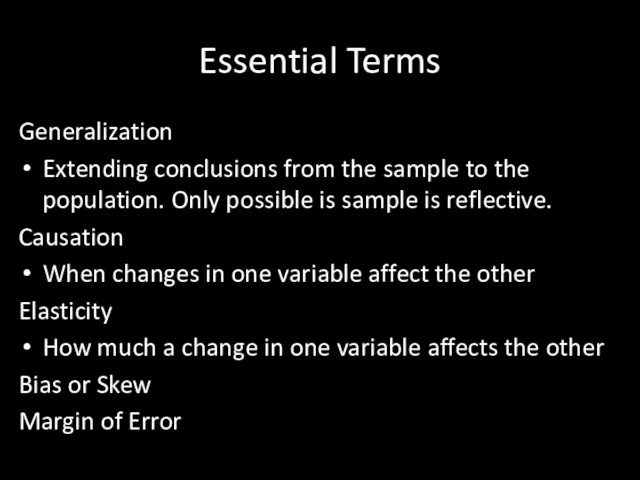
- 18. Essential Terms Generalization Extending conclusions from the sample to the population. Only possible is sample is
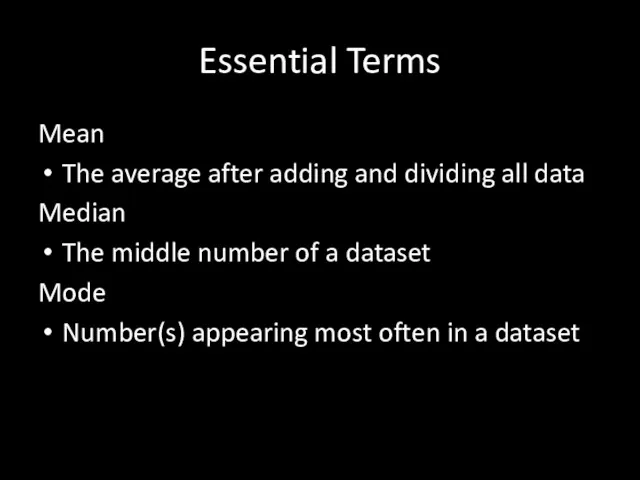
- 19. Essential Terms Mean The average after adding and dividing all data Median The middle number of
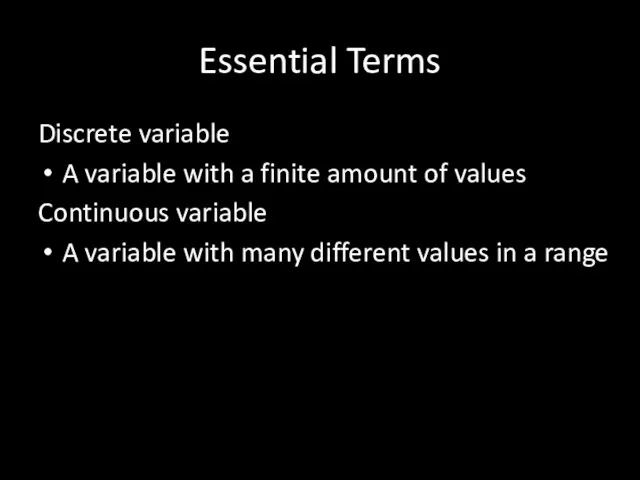
- 20. Essential Terms Discrete variable A variable with a finite amount of values Continuous variable A variable
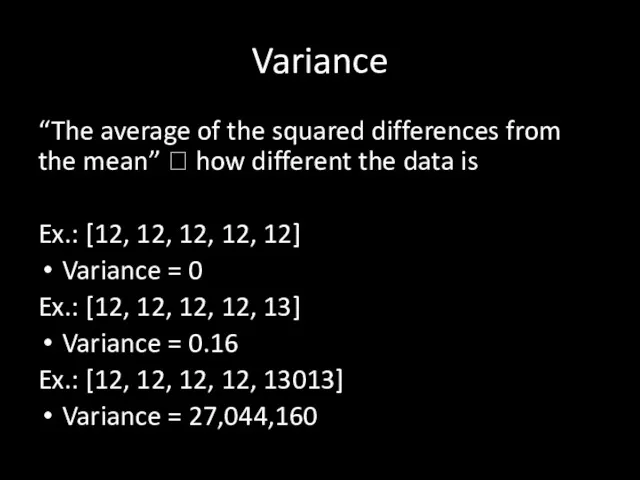
- 21. Variance “The average of the squared differences from the mean” ? how different the data is
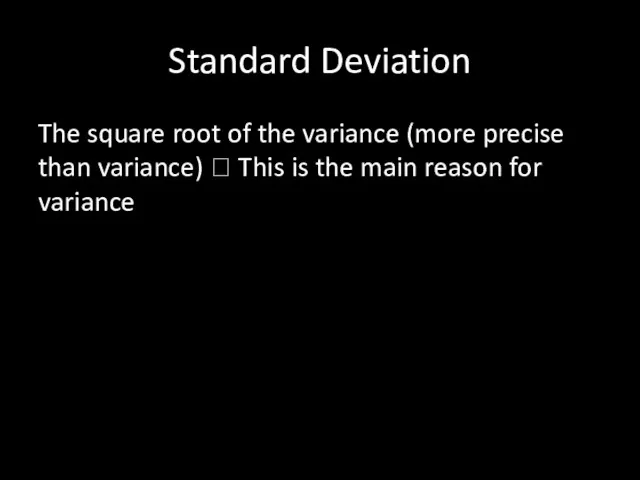
- 22. Standard Deviation The square root of the variance (more precise than variance) ? This is the
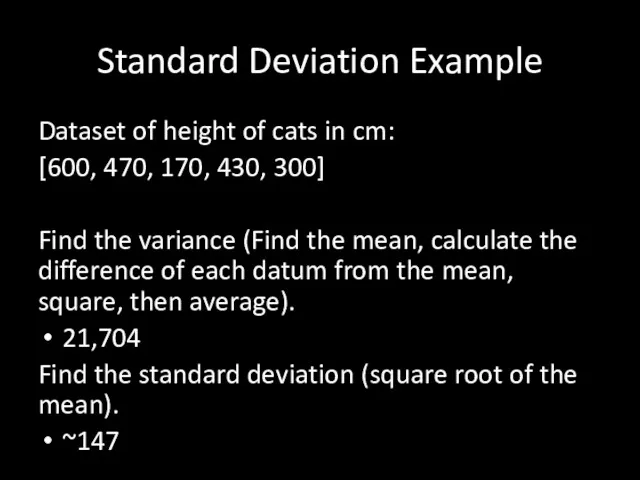
- 23. Standard Deviation Example Dataset of height of cats in cm: [600, 470, 170, 430, 300] Find
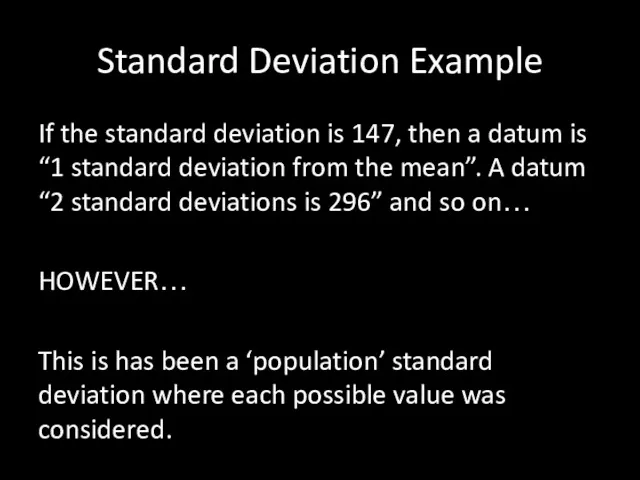
- 24. Standard Deviation Example If the standard deviation is 147, then a datum is “1 standard deviation
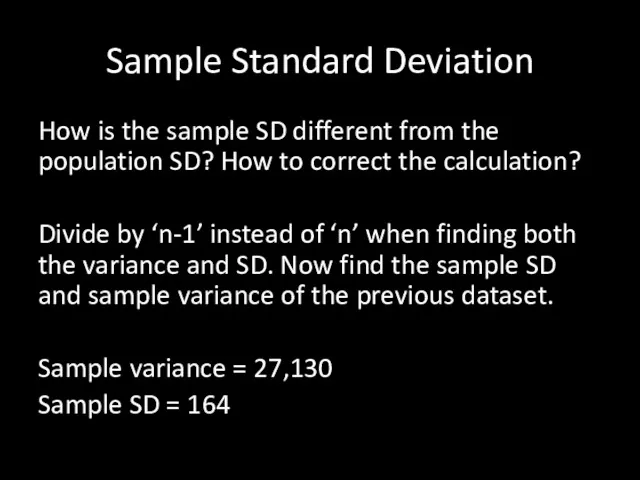
- 25. Sample Standard Deviation How is the sample SD different from the population SD? How to correct
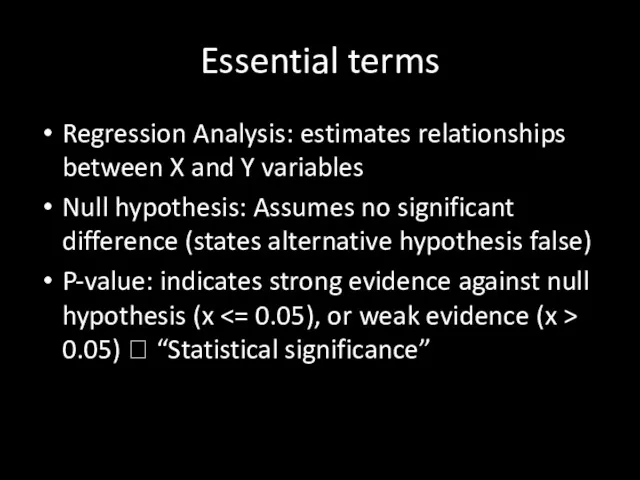
- 26. Essential terms Regression Analysis: estimates relationships between X and Y variables Null hypothesis: Assumes no significant
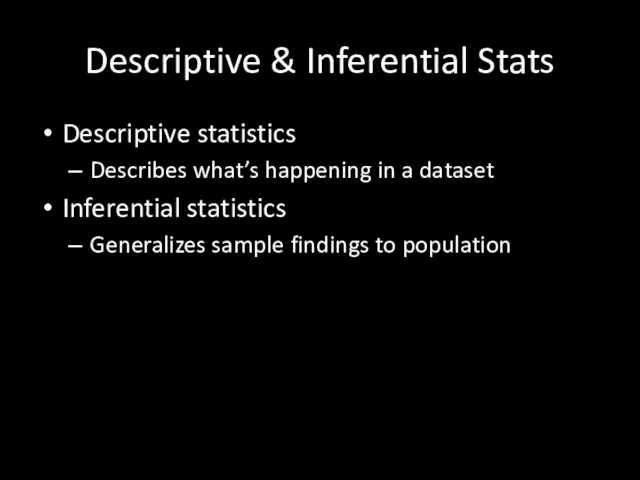
- 27. Descriptive & Inferential Stats Descriptive statistics Describes what’s happening in a dataset Inferential statistics Generalizes sample
- 28. Descriptive & Inferential Stats 50% of all Russian men are named Ivan. 20% of respondents are
- 29. Question Design
- 30. Open-ended vs. Closed-ended Open-ended ? No response options provided Closed-ended ? A list of options provided
- 32. Open-ended vs. Closed-ended Open-ended used in pilot studies to determine most common options Subjective closed-ended ?
- 33. Closed-ended example Form a question asking about a student’s satisfaction with their high school education (hint
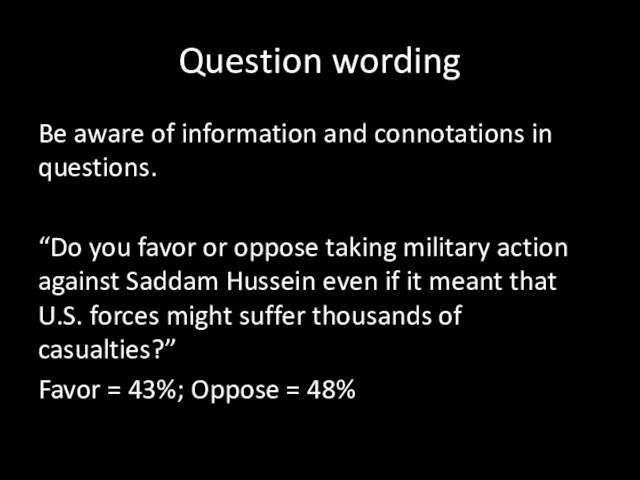
- 34. Question wording Be aware of information and connotations in questions. “Do you favor or oppose taking
- 35. Question wording Be aware of information and connotations in questions. “Do you favor or oppose taking
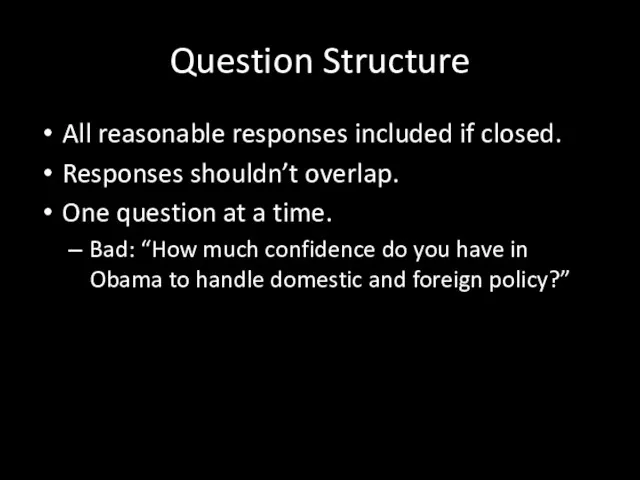
- 36. Question Structure All reasonable responses included if closed. Responses shouldn’t overlap. One question at a time.
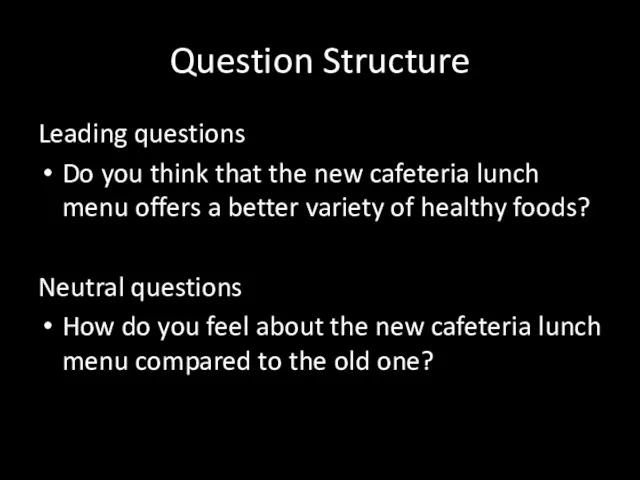
- 37. Question Structure Leading questions Do you think that the new cafeteria lunch menu offers a better
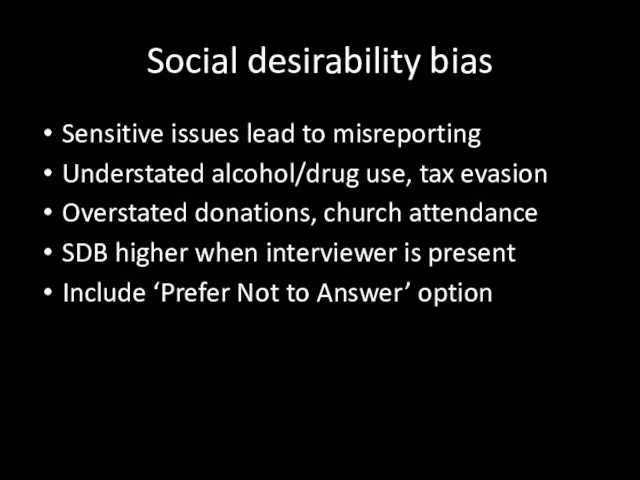
- 38. Social desirability bias Sensitive issues lead to misreporting Understated alcohol/drug use, tax evasion Overstated donations, church
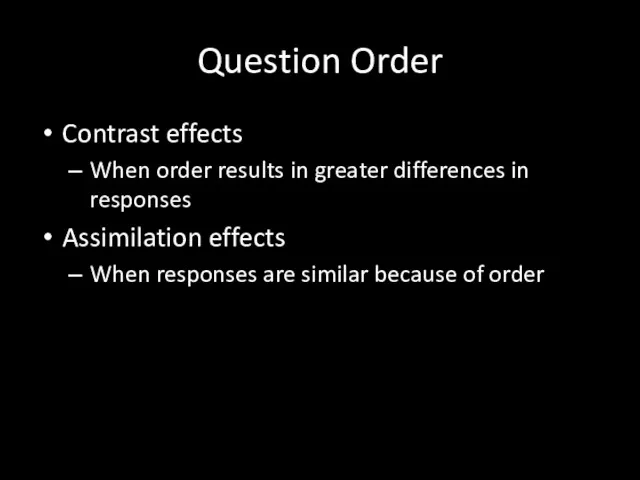
- 39. Question Order Contrast effects When order results in greater differences in responses Assimilation effects When responses
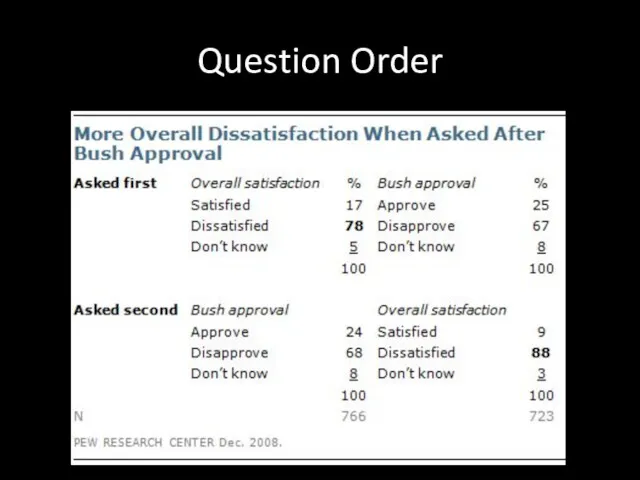
- 40. Question Order
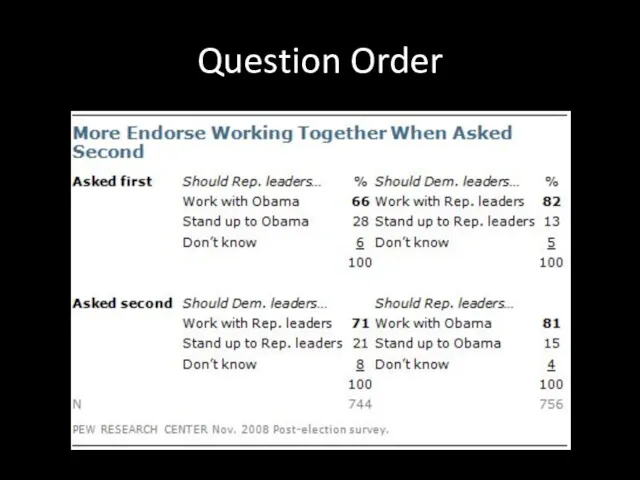
- 41. Question Order
- 42. Question Order
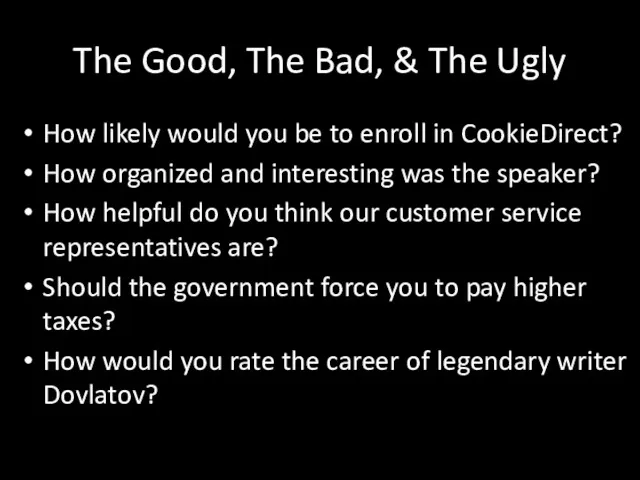
- 43. The Good, The Bad, & The Ugly How likely would you be to enroll in CookieDirect?
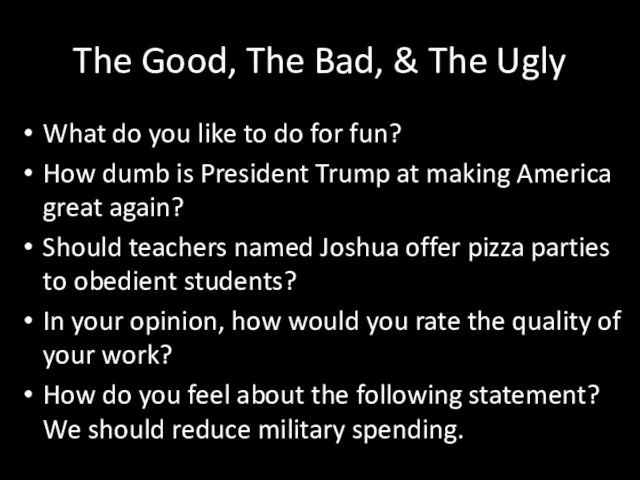
- 44. The Good, The Bad, & The Ugly What do you like to do for fun? How
- 46. Скачать презентацию
Correlation
Correlation
What is correlation?
A statistical measurement that shows the relationship between two
What is correlation?
A statistical measurement that shows the relationship between two
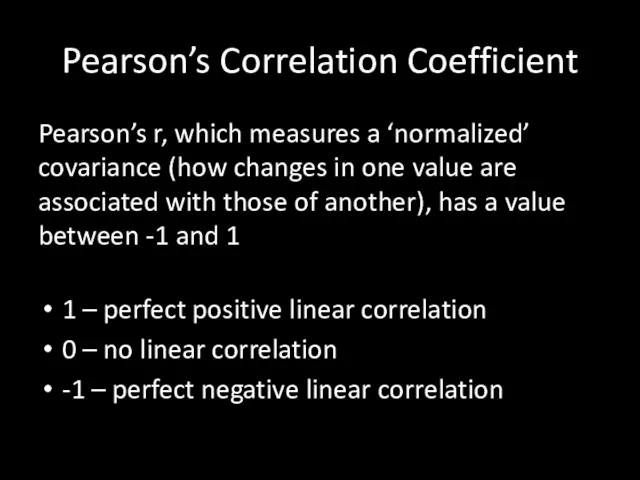
Pearson’s Correlation Coefficient
Pearson’s r, which measures a ‘normalized’ covariance (how changes
Pearson’s Correlation Coefficient
Pearson’s r, which measures a ‘normalized’ covariance (how changes

Correlation types
Positive correlation
An increase in one variable will lead to an
Correlation types
Positive correlation
An increase in one variable will lead to an
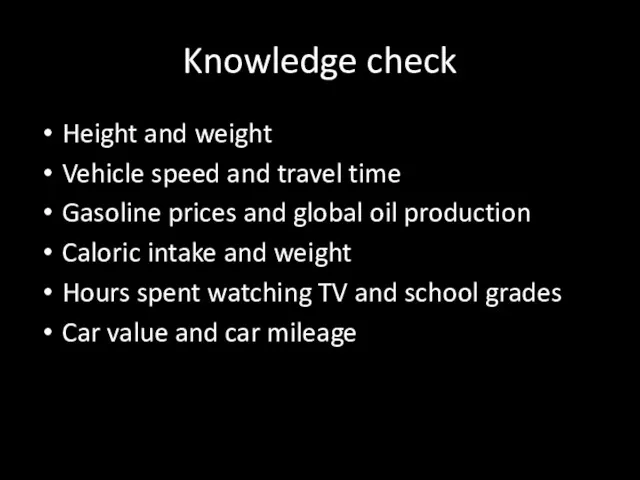
Knowledge check
Height and weight
Vehicle speed and travel time
Gasoline prices and global
Knowledge check
Height and weight
Vehicle speed and travel time
Gasoline prices and global
Case Study
In WWII, the US formed the Statistical Research Group to
Case Study
In WWII, the US formed the Statistical Research Group to
Case Study (cont)
When planes returned from missions, damage was unevenly distributed.
Case Study (cont)
When planes returned from missions, damage was unevenly distributed.
Case Study (cont)
Tip: Set a variable to zero to test the
Case Study (cont)
Tip: Set a variable to zero to test the
Case Study
In WWII, bombing accuracy had a high positive correlation with
Case Study
In WWII, bombing accuracy had a high positive correlation with
Case Study
In WWII, bombing accuracy had a high positive correlation with
Case Study
In WWII, bombing accuracy had a high positive correlation with
Case Study
Statisticians often report that in assessing a child’s likeliness to
Case Study
Statisticians often report that in assessing a child’s likeliness to
Case Study
Statisticians often report that in assessing a child’s likeliness to
Case Study
Statisticians often report that in assessing a child’s likeliness to

Case Study
Economist recently announced that statistics prove the taller you are,
Case Study
Economist recently announced that statistics prove the taller you are,
Case Study
Economist recently announced that statistics prove the taller you are,
Case Study
Economist recently announced that statistics prove the taller you are,
Statistical Terminology
Statistical Terminology
Essential Terms
Sample
A portion of a population
Stratified Sample
The sample is chosen to
Essential Terms
Sample
A portion of a population
Stratified Sample
The sample is chosen to
Essential Terms
Generalization
Extending conclusions from the sample to the population. Only possible
Essential Terms
Generalization
Extending conclusions from the sample to the population. Only possible
Essential Terms
Mean
The average after adding and dividing all data
Median
The middle number
Essential Terms
Mean
The average after adding and dividing all data
Median
The middle number
Essential Terms
Discrete variable
A variable with a finite amount of values
Continuous variable
A
Essential Terms
Discrete variable
A variable with a finite amount of values
Continuous variable
A
Variance
“The average of the squared differences from the mean” ? how
Variance
“The average of the squared differences from the mean” ? how
Standard Deviation
The square root of the variance (more precise than variance)
Standard Deviation
The square root of the variance (more precise than variance)
Standard Deviation Example
Dataset of height of cats in cm:
[600, 470,
Standard Deviation Example
Dataset of height of cats in cm:
[600, 470,
Standard Deviation Example
If the standard deviation is 147, then a datum
Standard Deviation Example
If the standard deviation is 147, then a datum
Sample Standard Deviation
How is the sample SD different from the population
Sample Standard Deviation
How is the sample SD different from the population
Essential terms
Regression Analysis: estimates relationships between X and Y variables
Null hypothesis:
Essential terms
Regression Analysis: estimates relationships between X and Y variables
Null hypothesis:
Descriptive & Inferential Stats
Descriptive statistics
Describes what’s happening in a dataset
Inferential statistics
Generalizes
Descriptive & Inferential Stats
Descriptive statistics
Describes what’s happening in a dataset
Inferential statistics
Generalizes
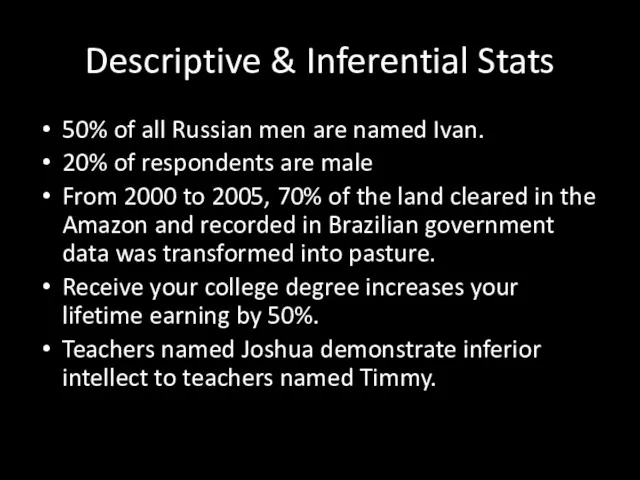
Descriptive & Inferential Stats
50% of all Russian men are named Ivan.
20%
Descriptive & Inferential Stats
50% of all Russian men are named Ivan.
20%

Question Design
Question Design
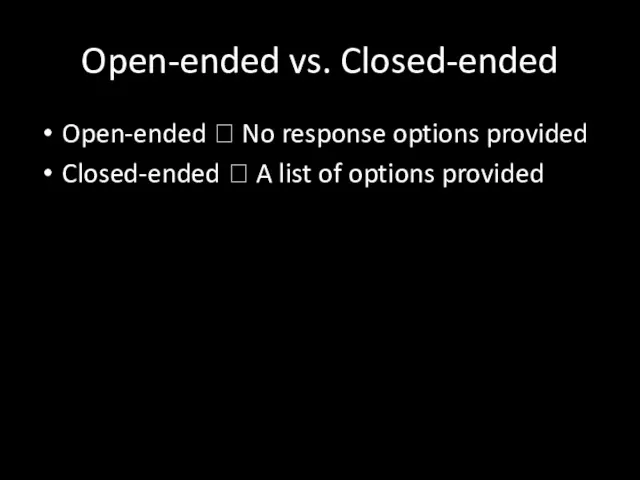
Open-ended vs. Closed-ended
Open-ended ? No response options provided
Closed-ended ? A list
Open-ended vs. Closed-ended
Open-ended ? No response options provided
Closed-ended ? A list


Open-ended vs. Closed-ended
Open-ended used in pilot studies to determine most common
Open-ended vs. Closed-ended
Open-ended used in pilot studies to determine most common
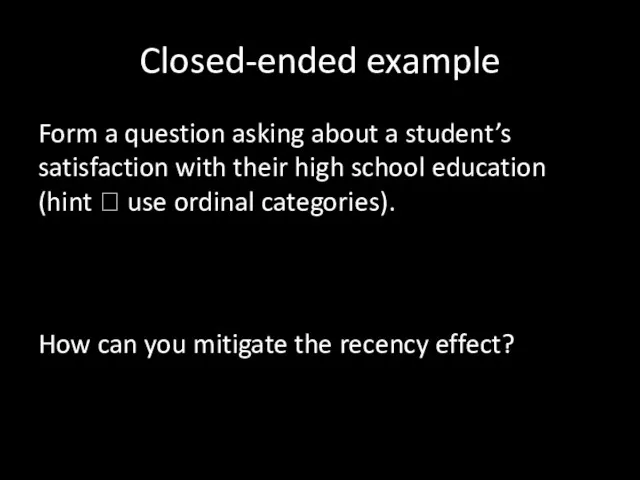
Closed-ended example
Form a question asking about a student’s satisfaction with their
Closed-ended example
Form a question asking about a student’s satisfaction with their
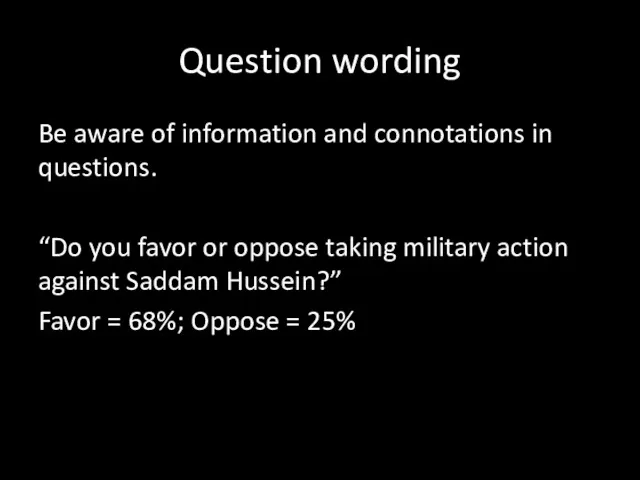
Question wording
Be aware of information and connotations in questions.
“Do you favor
Question wording
Be aware of information and connotations in questions.
“Do you favor
Question wording
Be aware of information and connotations in questions.
“Do you favor
Question wording
Be aware of information and connotations in questions.
“Do you favor
Question Structure
All reasonable responses included if closed.
Responses shouldn’t overlap.
One question at
Question Structure
All reasonable responses included if closed.
Responses shouldn’t overlap.
One question at
Question Structure
Leading questions
Do you think that the new cafeteria lunch menu
Question Structure
Leading questions
Do you think that the new cafeteria lunch menu
Social desirability bias
Sensitive issues lead to misreporting
Understated alcohol/drug use, tax evasion
Overstated
Social desirability bias
Sensitive issues lead to misreporting
Understated alcohol/drug use, tax evasion
Overstated
Question Order
Contrast effects
When order results in greater differences in responses
Assimilation effects
When
Question Order
Contrast effects
When order results in greater differences in responses
Assimilation effects
When

Question Order
Question Order
Question Order
Question Order
Question Order
Question Order
The Good, The Bad, & The Ugly
How likely would you be
The Good, The Bad, & The Ugly
How likely would you be
The Good, The Bad, & The Ugly
What do you like to
The Good, The Bad, & The Ugly
What do you like to
 Countable and uncountable nouns
 Loving dogs and other pets 1.11
 Sweden national dish. Meat boals
 Вводный курс английского языка
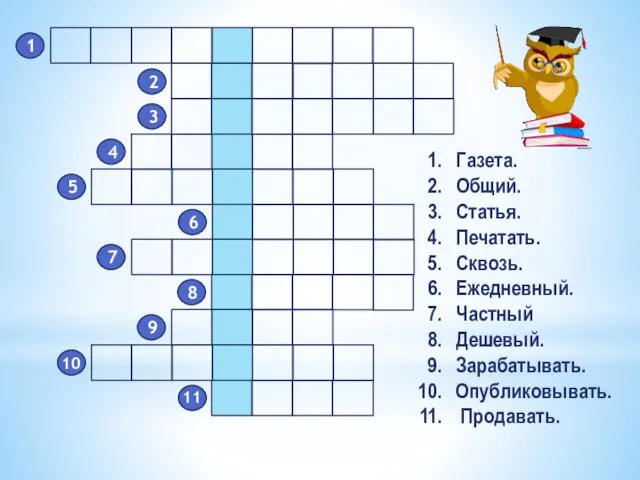 Crossword to lesson
 This Is London
 Past tenses
 Singular and Plural. One and More. 6 класс
 Subjunctive mood Сослагательное наклонение
 Past simple теnse
 Online safety
 High school culture
 Numbers
 Причастные обороты в английском языке
 Singular and plurals
 Portfolio
 Present Continuous Tense
 Now I Know
 Chall-2-KET exam work on mistakes
 Cheburashka. Present Simple
 Foreign language 2015. How to make money in the Stock Market
 Личное письмо
 Travelling and Transport
 Business Letter Formats
 Pet. Writing & listening
 Brilliant-2, for verbs animals and colours
 Nielsen career opportunities
 Korolev Sergey Pavlovich