- Genetic code

Содержание
- 2. The Genetic Code
- 3. The Reading Frames
- 4. tRNA (clover leaf shape with four strands folded, finally L-shape)
- 5. tRNA and mRNA pairing
- 6. DNA yields more phylogenetic information than proteins. The nucleotide sequences of a pair of homologous genes
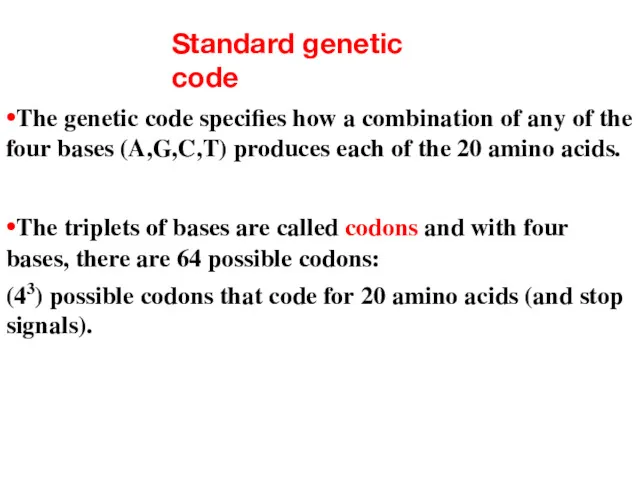
- 8. Standard genetic code •The genetic code specifies how a combination of any of the four bases
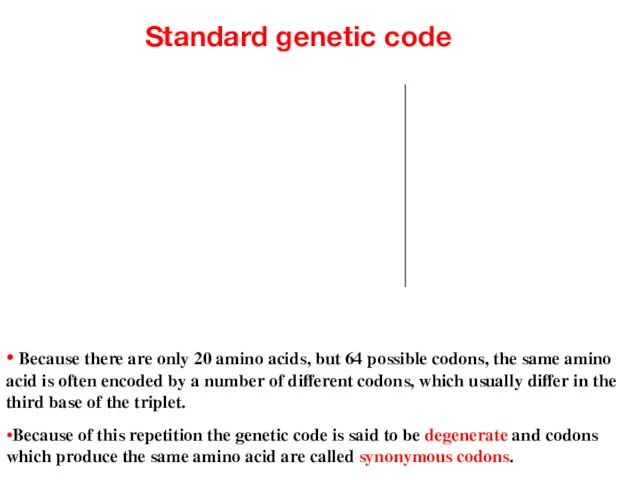
- 9. Standard genetic code • Because there are only 20 amino acids, but 64 possible codons, the
- 10. Important properties inherent to the standard genetic code
- 11. Synonymous vs nonsynonymous substitutions • Nondegenerate sites: are codon position where mutations always result in amino
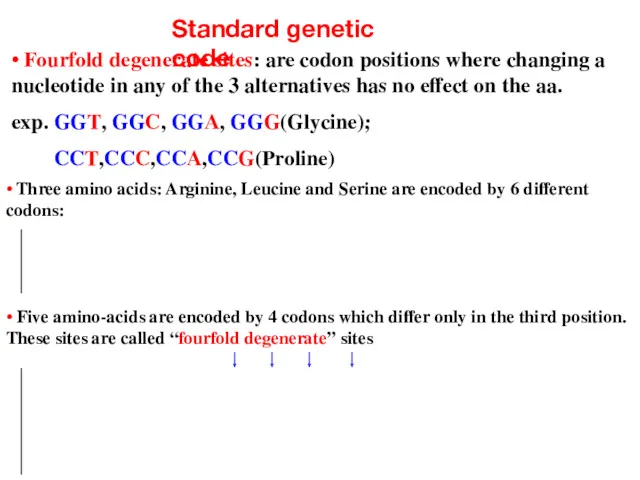
- 12. Standard genetic code • Three amino acids: Arginine, Leucine and Serine are encoded by 6 different
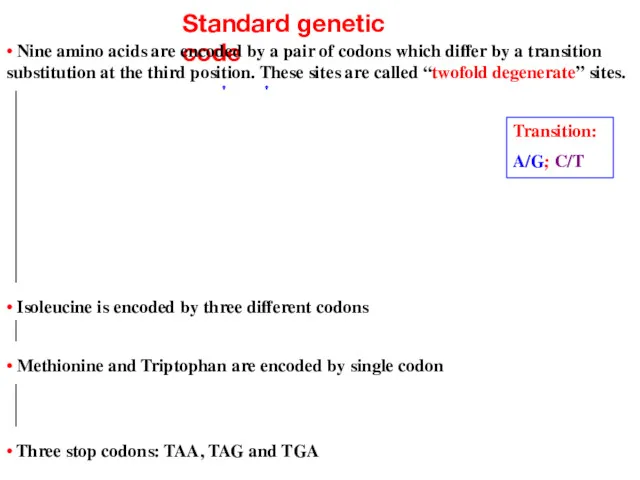
- 13. Standard genetic code • Nine amino acids are encoded by a pair of codons which differ
- 14. Nucleotide substitutions in protein coding genes can be divided into : • synonymous (or silent) substitutions
- 15. • Estimation of synonymous and nonsynonymous substitution rates is important in understanding the dynamics of molecular
- 16. Codon usage • If nucleotide substitution occurs at random at each nucleotide site, every nucleotide site
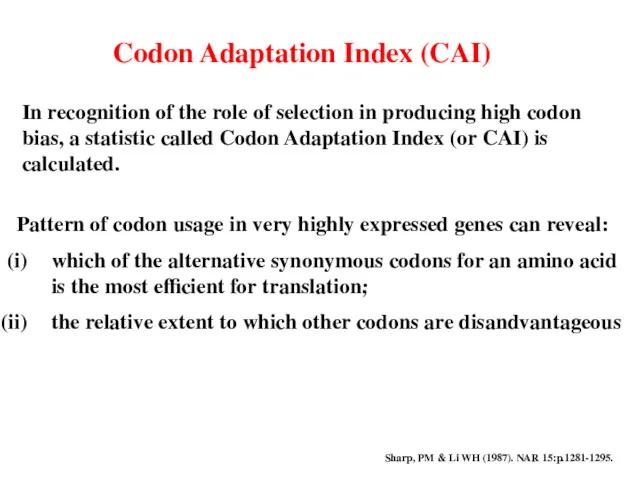
- 17. Codon Adaptation Index (CAI) In recognition of the role of selection in producing high codon bias,
- 18. RSCU • Relative Synonymous Codon Usage : a statistical measure of codon usage bias RSCU =
- 19. wij = RSCUij/RSCIimax = Xij/Ximax where RSCUimax and Ximax are RSCU and X values for the
- 20. Codon Adaptation Index
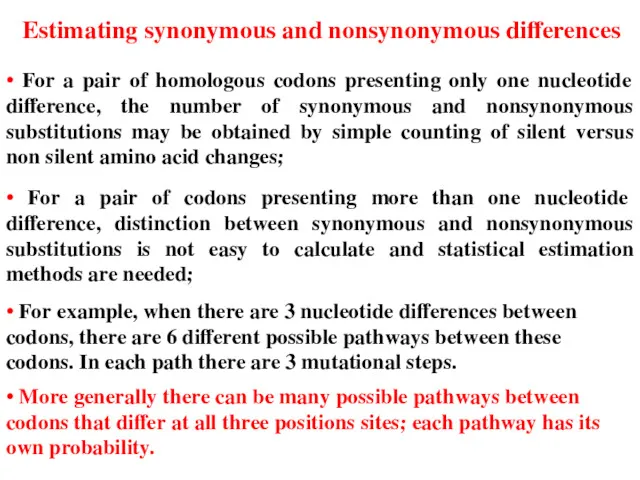
- 21. • For a pair of homologous codons presenting only one nucleotide difference, the number of synonymous
- 22. • Observed nucleotide differences between 2 homologous sequences are classified into 4 categories: synonymous transitions, synonymous
- 23. •Codon 1: GAA --> GAC ;1 nuc. diff., 1 nonsynonymous difference; •Codon 2: GTT --> GTC
- 24. Evolutionary Distance estimation between 2 sequences The simplest problem is the estimation of the number of
- 25. Evolutionary Distance estimation In general the genetic code affords fewer opportunities for nonsynonymous changes than for
- 26. Evolutionary Distance estimation • Fundamental for the study of protein evolution and useful for constructing phylogenetic
- 27. • Ziheng Yang & Rasmus Nielsen (2000) Estimating synonymous and nonsynonymous substitution rates under realistic evolutionary
- 28. Purifying selection: Most of the time selection eliminates deleterious mutations, keeping the protein as it is.
- 29. Negative (purifying) selection eliminates disadvantageous mutations i.e. inhibits protein evolution. (explains why dN Positive selection is
- 30. Mutational saturation Mutational saturation in DNA and protein sequences occurs when sites have undergone multiple mutations
- 31. • PAML: Phylogenetic Analysis by Maximum Likelihood (PAML) http://abacus.gene.ucl.ac.uk/software/paml.html -> yn00 similar results than ML (Yang
- 32. Relative Rate Test For determining the relative rate of substitution in species 1 and 2, we
- 33. Yang & Nielsen, Esimating Synonymous and Nonsynonymous Substitution Rates Under Realistic Evolutionary Models Mol. Biol. Evol.
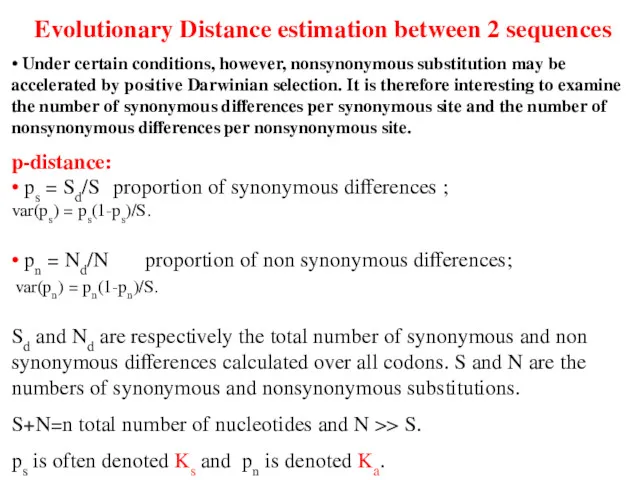
- 34. Evolutionary Distance estimation between 2 sequences • Under certain conditions, however, nonsynonymous substitution may be accelerated
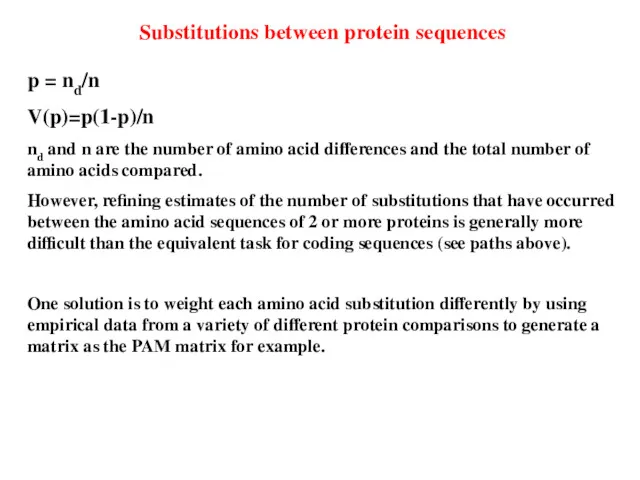
- 35. Substitutions between protein sequences p = nd/n V(p)=p(1-p)/n nd and n are the number of amino
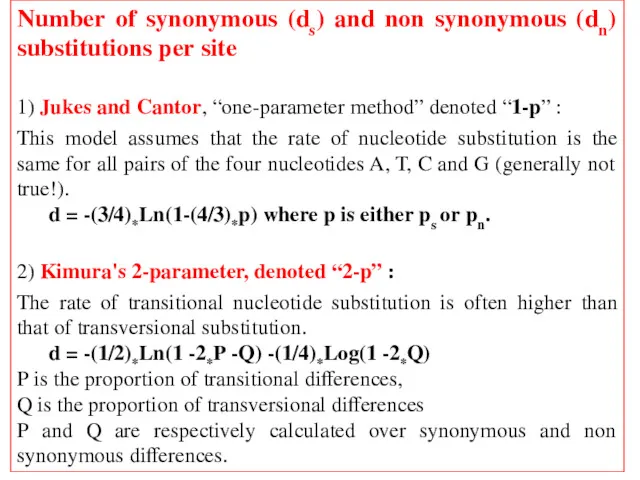
- 36. Number of synonymous (ds) and non synonymous (dn) substitutions per site 1) Jukes and Cantor, “one-parameter
- 37. • Example: yn00 in PAML. • Protein sequences in a family and corresponding DNA sequences
- 38. 1. Alignment of a family protein sequences using clustalW 2. Alignment of corresponding DNA sequences using
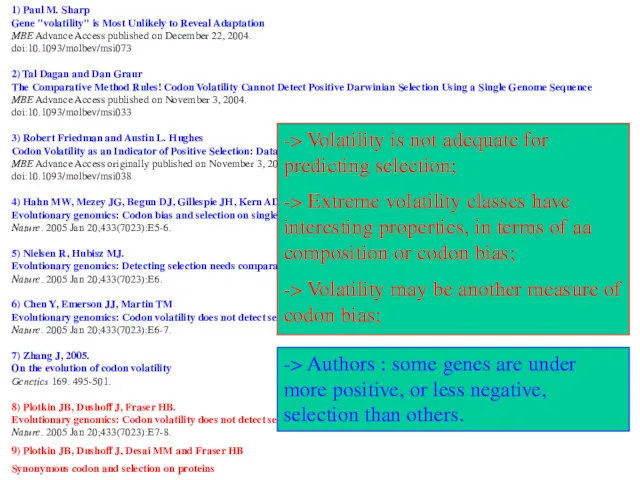
- 39. • Most of the genes are under purifying selection • Only few genes might be under
- 40. • Codon volatility
- 41. A new concept: codons volatility (Plotkin et al. 2004. nature 428. p.942-945). • New method recently
- 42. Detecting Selection • If a protein coding region of a nucleotide sequence has undergone an excess
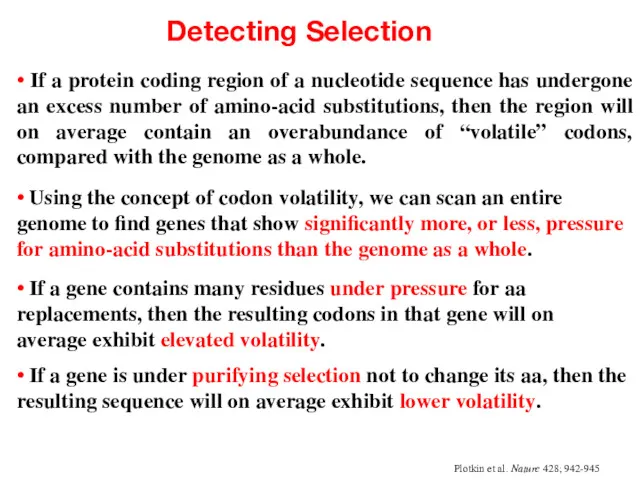
- 43. Plotkin et al. 2004. Nature 428. p.942-945
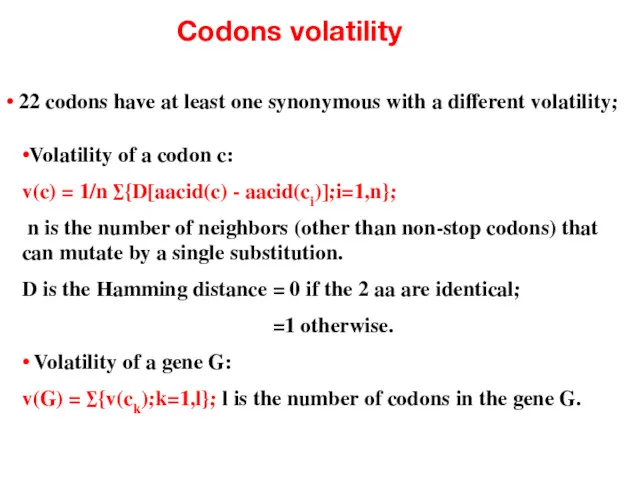
- 44. Codons volatility • 22 codons have at least one synonymous with a different volatility; •Volatility of
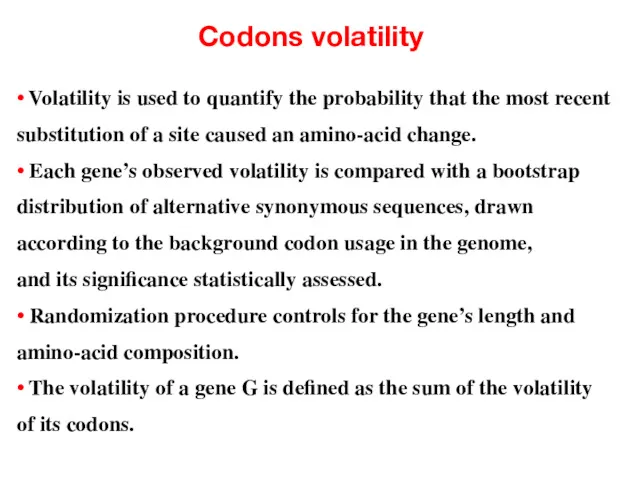
- 45. Codons volatility • Volatility is used to quantify the probability that the most recent substitution of
- 46. Codons volatility Volatility p-value of G: • The observed v(G) is compared with a bootstrap distribution
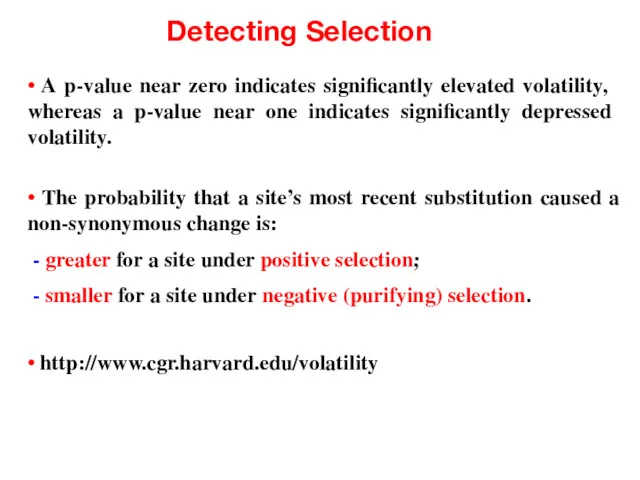
- 47. Detecting Selection • A p-value near zero indicates significantly elevated volatility, whereas a p-value near one
- 48. 1) Paul M. Sharp Gene "volatility" is Most Unlikely to Reveal Adaptation MBE Advance Access published
- 49. Codon Volatility (simple substitution model): Codons and volatility under simple substitution model
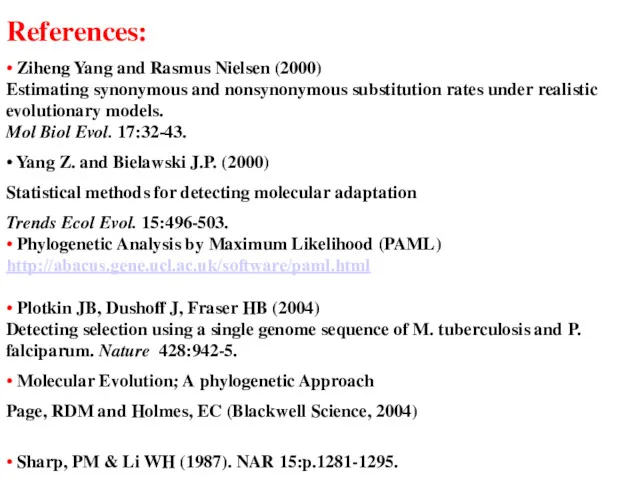
- 50. References: • Ziheng Yang and Rasmus Nielsen (2000) Estimating synonymous and nonsynonymous substitution rates under realistic
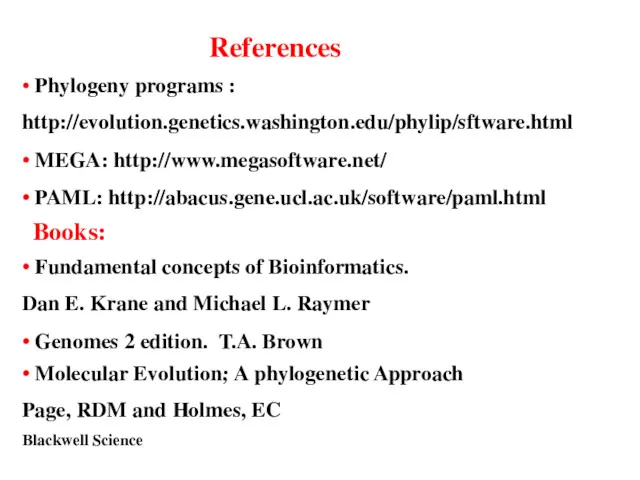
- 51. References • MEGA: http://www.megasoftware.net/ • PAML: http://abacus.gene.ucl.ac.uk/software/paml.html • Fundamental concepts of Bioinformatics. Dan E. Krane and
- 52. Molecular evolution: Definitions Purifying (negative) selection • A consequence of gene “drift” through random mutations, is
- 53. Neutral theory • Majority of evolution at the molecular level is caused by random genetic “drift”
- 54. Positive selection • Positive selection is a darwinian selection fixing advantageous mutations. The term is used
- 55. Molecular evolution • We observe and try to decode the process of molecular evolution from the
- 57. Скачать презентацию
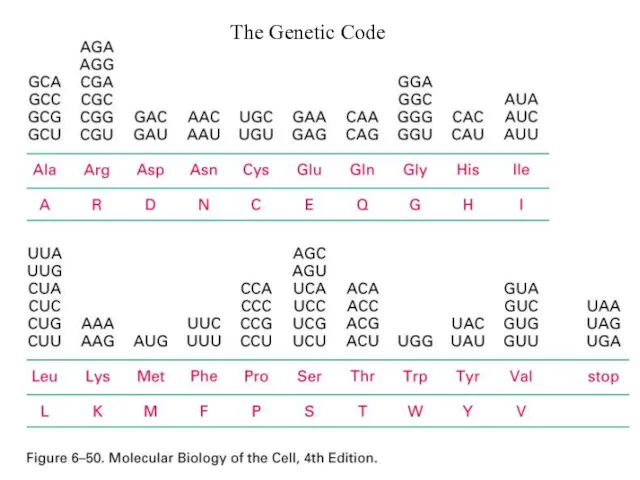
The Genetic Code
The Genetic Code

The Reading Frames
The Reading Frames

tRNA (clover leaf shape with four strands folded, finally L-shape)
tRNA (clover leaf shape with four strands folded, finally L-shape)

tRNA and mRNA pairing
tRNA and mRNA pairing
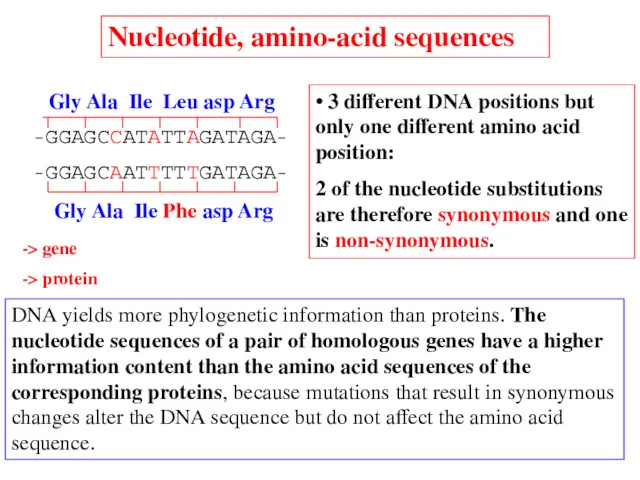
DNA yields more phylogenetic information than proteins. The nucleotide sequences of
DNA yields more phylogenetic information than proteins. The nucleotide sequences of

Standard genetic code
•The genetic code specifies how a combination of any
Standard genetic code
•The genetic code specifies how a combination of any
Standard genetic code
• Because there are only 20 amino acids, but
Standard genetic code
• Because there are only 20 amino acids, but
Important properties inherent to
the standard genetic code
Important properties inherent to
the standard genetic code

Synonymous vs nonsynonymous substitutions
• Nondegenerate sites: are codon position where
Synonymous vs nonsynonymous substitutions
• Nondegenerate sites: are codon position where
Standard genetic code
• Three amino acids: Arginine, Leucine and Serine are
Standard genetic code
• Three amino acids: Arginine, Leucine and Serine are
Standard genetic code
• Nine amino acids are encoded by a pair
Standard genetic code
• Nine amino acids are encoded by a pair
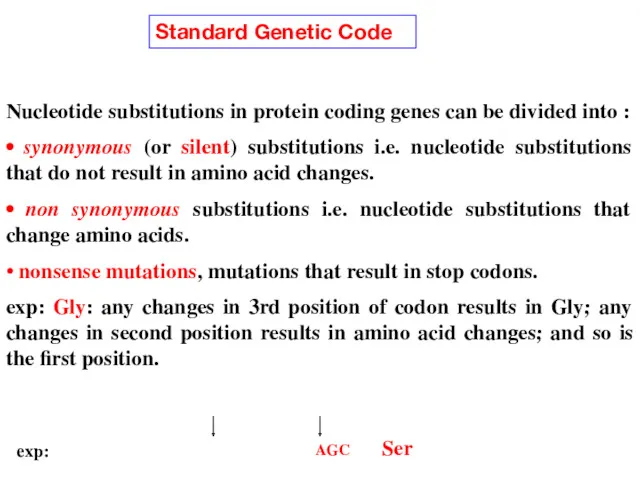
Nucleotide substitutions in protein coding genes can be divided into :
•
Nucleotide substitutions in protein coding genes can be divided into :
•

• Estimation of synonymous and nonsynonymous substitution rates is important in
• Estimation of synonymous and nonsynonymous substitution rates is important in
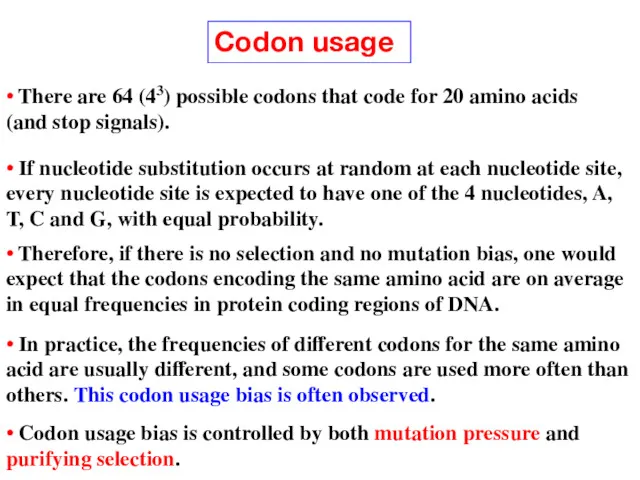
Codon usage
• If nucleotide substitution occurs at random at each
Codon usage
• If nucleotide substitution occurs at random at each
Codon Adaptation Index (CAI)
In recognition of the role of selection in
Codon Adaptation Index (CAI)
In recognition of the role of selection in

RSCU
• Relative Synonymous Codon Usage :
a statistical measure of codon
RSCU
• Relative Synonymous Codon Usage :
a statistical measure of codon

wij = RSCUij/RSCIimax = Xij/Ximax
where RSCUimax and Ximax are RSCU
wij = RSCUij/RSCIimax = Xij/Ximax
where RSCUimax and Ximax are RSCU

Codon Adaptation Index
Codon Adaptation Index
• For a pair of homologous codons presenting only one nucleotide
• For a pair of homologous codons presenting only one nucleotide
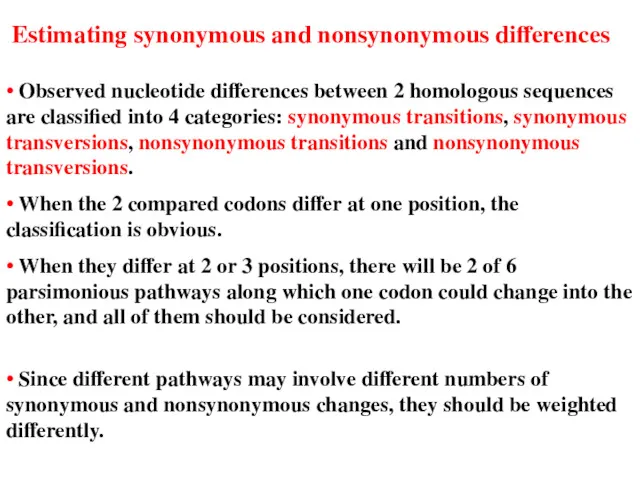
• Observed nucleotide differences between 2 homologous sequences are classified into
• Observed nucleotide differences between 2 homologous sequences are classified into
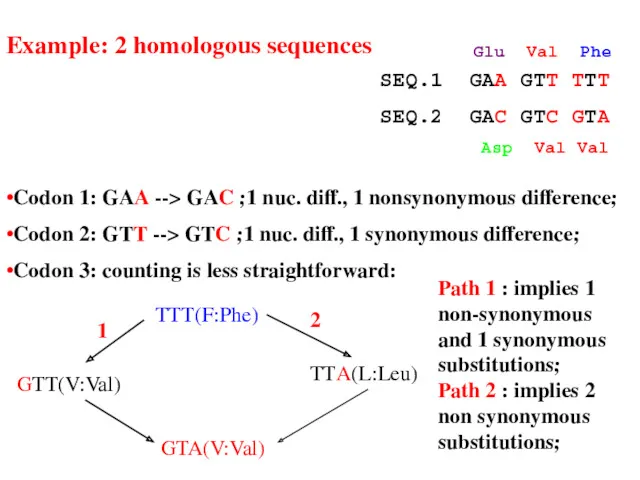
•Codon 1: GAA --> GAC ;1 nuc. diff., 1 nonsynonymous difference;
•Codon
•Codon 1: GAA --> GAC ;1 nuc. diff., 1 nonsynonymous difference;
•Codon

Evolutionary Distance estimation between 2 sequences
The simplest problem is the estimation
Evolutionary Distance estimation between 2 sequences
The simplest problem is the estimation

Evolutionary Distance estimation
In general the genetic code affords fewer opportunities for
Evolutionary Distance estimation
In general the genetic code affords fewer opportunities for

Evolutionary Distance estimation
• Fundamental for the study of protein evolution and
Evolutionary Distance estimation
• Fundamental for the study of protein evolution and

• Ziheng Yang & Rasmus Nielsen (2000)
Estimating synonymous and nonsynonymous substitution
• Ziheng Yang & Rasmus Nielsen (2000)
Estimating synonymous and nonsynonymous substitution
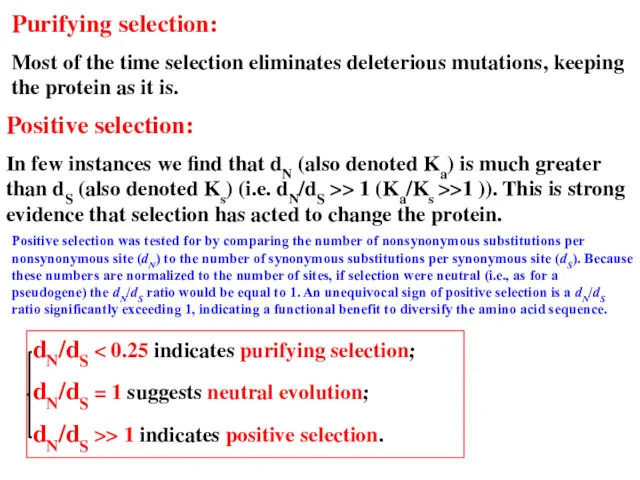
Purifying selection:
Most of the time selection eliminates deleterious mutations, keeping the
Purifying selection:
Most of the time selection eliminates deleterious mutations, keeping the
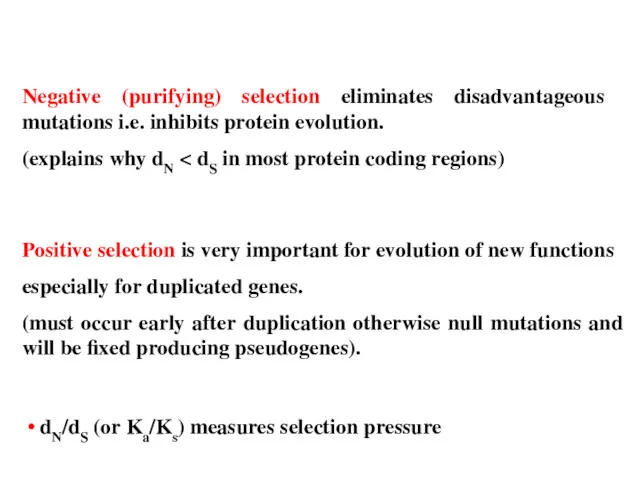
Negative (purifying) selection eliminates disadvantageous mutations i.e. inhibits protein evolution.
(explains why
Negative (purifying) selection eliminates disadvantageous mutations i.e. inhibits protein evolution.
(explains why

Mutational saturation
Mutational saturation in DNA and protein sequences occurs when sites
Mutational saturation
Mutational saturation in DNA and protein sequences occurs when sites

• PAML: Phylogenetic Analysis by Maximum Likelihood (PAML)
http://abacus.gene.ucl.ac.uk/software/paml.html
-> yn00 similar
• PAML: Phylogenetic Analysis by Maximum Likelihood (PAML)
http://abacus.gene.ucl.ac.uk/software/paml.html
-> yn00 similar
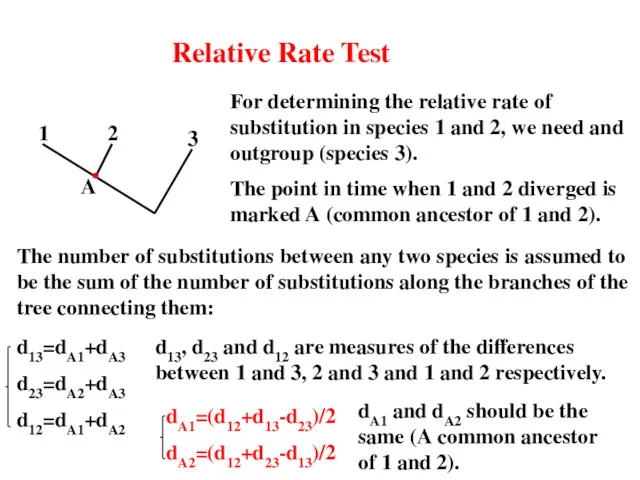
Relative Rate Test
For determining the relative rate of substitution in species
Relative Rate Test
For determining the relative rate of substitution in species
Yang & Nielsen,
Esimating Synonymous and Nonsynonymous Substitution Rates Under Realistic
Yang & Nielsen,
Esimating Synonymous and Nonsynonymous Substitution Rates Under Realistic
Evolutionary Distance estimation between 2 sequences
• Under certain conditions, however, nonsynonymous
Evolutionary Distance estimation between 2 sequences
• Under certain conditions, however, nonsynonymous
Substitutions between protein sequences
p = nd/n
V(p)=p(1-p)/n
nd and n are the number
Substitutions between protein sequences
p = nd/n
V(p)=p(1-p)/n
nd and n are the number
Number of synonymous (ds) and non synonymous (dn) substitutions per site
1)
Number of synonymous (ds) and non synonymous (dn) substitutions per site
1)

• Example: yn00 in PAML.
• Protein sequences in a family
and corresponding
• Example: yn00 in PAML.
• Protein sequences in a family
and corresponding

1. Alignment of a family protein sequences using clustalW
2. Alignment of
1. Alignment of a family protein sequences using clustalW
2. Alignment of

• Most of the genes are under purifying selection
• Only few
• Most of the genes are under purifying selection
• Only few

• Codon volatility
• Codon volatility

A new concept: codons volatility
(Plotkin et al. 2004. nature 428.
A new concept: codons volatility
(Plotkin et al. 2004. nature 428.
Detecting Selection
• If a protein coding region of a nucleotide sequence
Detecting Selection
• If a protein coding region of a nucleotide sequence

Plotkin et al. 2004.
Nature 428. p.942-945
Plotkin et al. 2004.
Nature 428. p.942-945
Codons volatility
• 22 codons have at least one synonymous with a
Codons volatility
• 22 codons have at least one synonymous with a
Codons volatility
• Volatility is used to quantify the probability that the
Codons volatility
• Volatility is used to quantify the probability that the

Codons volatility
Volatility p-value of G:
• The observed v(G) is compared with
Codons volatility
Volatility p-value of G:
• The observed v(G) is compared with
Detecting Selection
• A p-value near zero indicates significantly elevated volatility, whereas
Detecting Selection
• A p-value near zero indicates significantly elevated volatility, whereas
1) Paul M. Sharp
Gene "volatility" is Most Unlikely to Reveal
1) Paul M. Sharp
Gene "volatility" is Most Unlikely to Reveal
Codon Volatility (simple substitution model):
Codons and volatility under simple substitution model
Codon Volatility (simple substitution model):
Codons and volatility under simple substitution model
References:
• Ziheng Yang and Rasmus Nielsen (2000)
Estimating synonymous and nonsynonymous substitution
References:
• Ziheng Yang and Rasmus Nielsen (2000)
Estimating synonymous and nonsynonymous substitution
References
• MEGA: http://www.megasoftware.net/
• PAML: http://abacus.gene.ucl.ac.uk/software/paml.html
• Fundamental concepts of Bioinformatics.
Dan E.
References
• MEGA: http://www.megasoftware.net/
• PAML: http://abacus.gene.ucl.ac.uk/software/paml.html
• Fundamental concepts of Bioinformatics.
Dan E.
Molecular evolution: Definitions
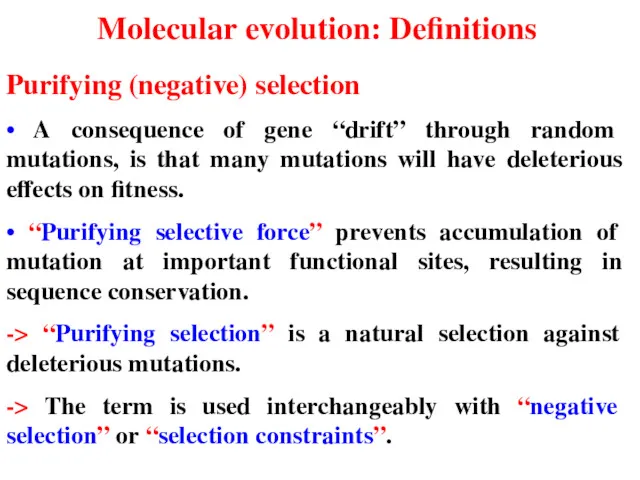
Purifying (negative) selection
• A consequence of gene “drift” through
Molecular evolution: Definitions
Purifying (negative) selection
• A consequence of gene “drift” through
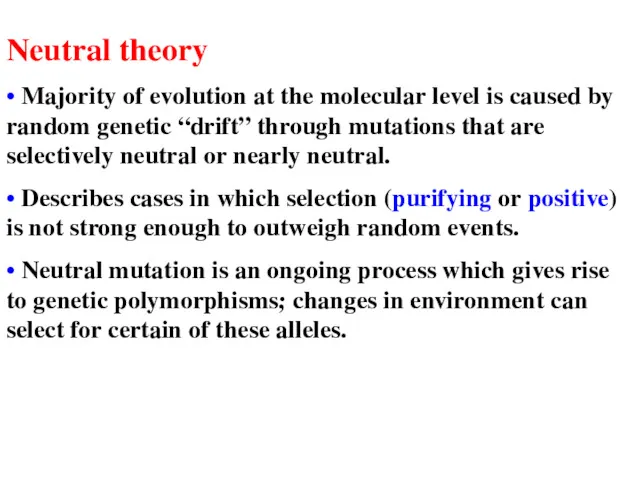
Neutral theory
• Majority of evolution at the molecular level is caused
Neutral theory
• Majority of evolution at the molecular level is caused
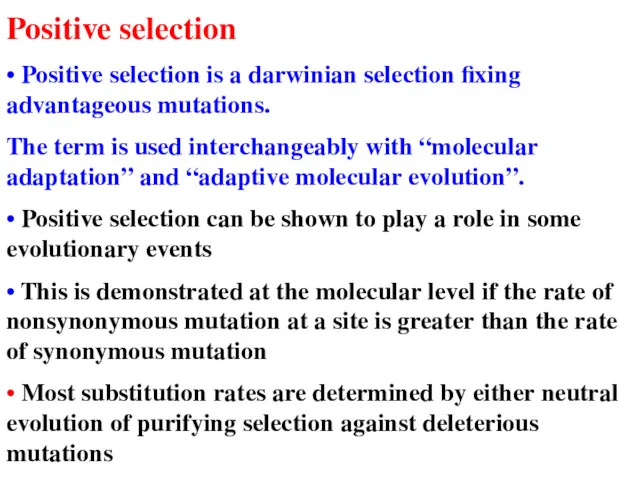
Positive selection
• Positive selection is a darwinian selection fixing advantageous mutations.
The
Positive selection
• Positive selection is a darwinian selection fixing advantageous mutations.
The
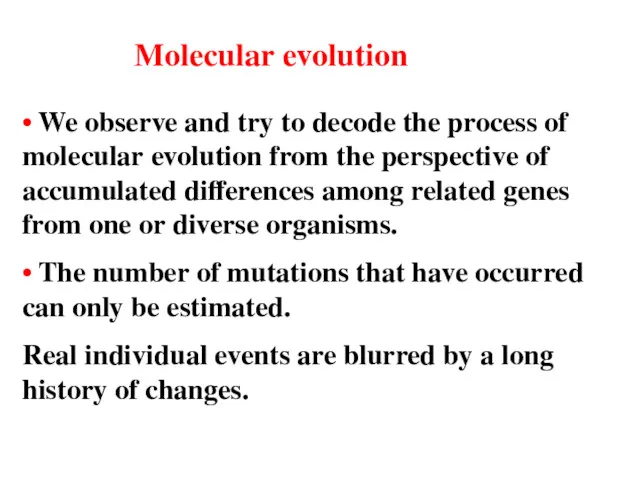
Molecular evolution
• We observe and try to decode the process of
Molecular evolution
• We observe and try to decode the process of
 Мейоз. Редукционное деление клеток
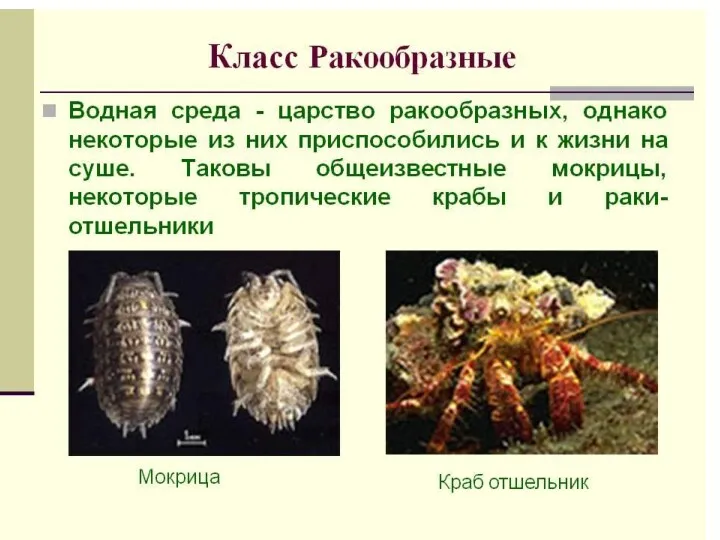 Класс Ракообразные
 Тренажёр Растительный мир, природоведение 5 класс
 Кормовая и сахарная свёкла
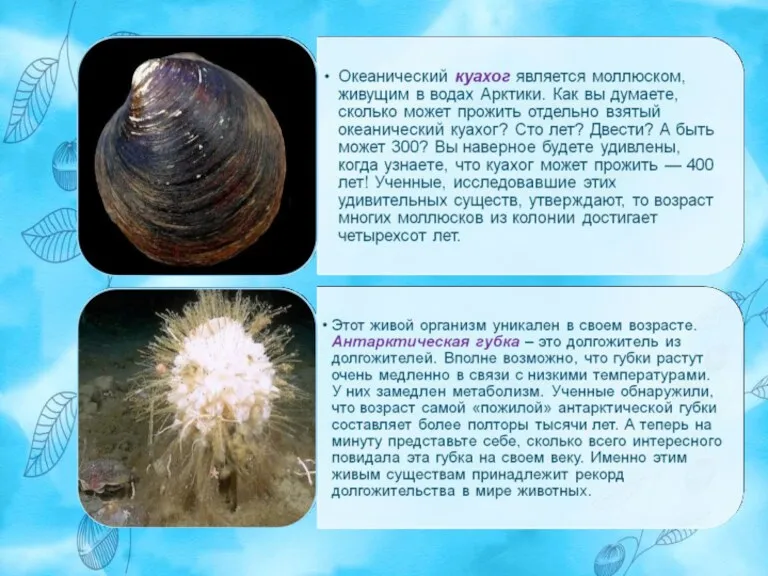 Периодизация и продолжительность жизни животных
 Нуклеиновые кислоты
 Различия Русской пегой и Русской гончих
 Хрящевые и костные рыбы
 Происхождение древних пресмыкающихся
 Химический элемент фосфор. Фосфор в составе ДНК и РНК
 Презентация к уроку биологии Закономерности изменчивости: мутационная изменчивость 9класс
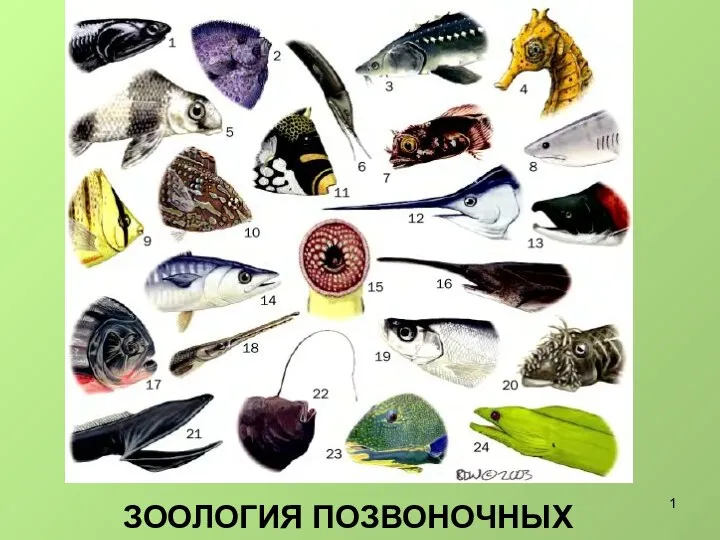 Класс костные рыбы
 Разновидности комнатных растений. Комнатные растения в интерьере квартиры
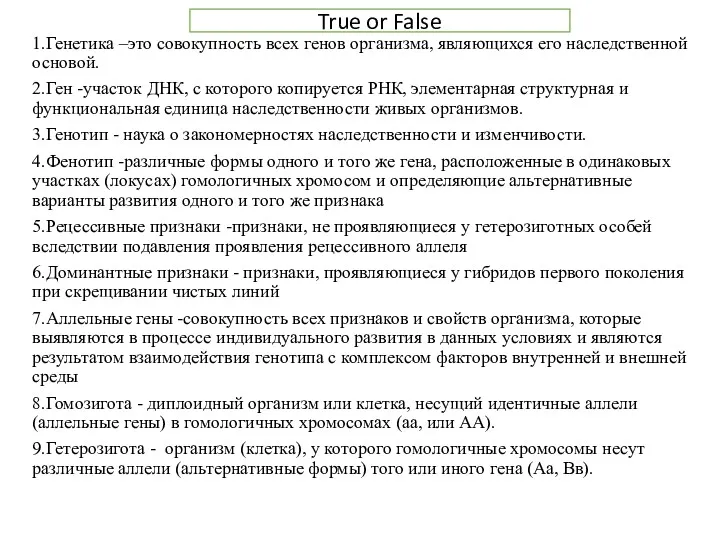 True or False
 Группы крови
 Абиотические факторы окружающей среды
 Презентация Органы кровообращения
 Нутриціологія. Вступ до нутриціології. Лекція № 1
 Кругосветное путешествие Ч. Дарвина
 Экологические группы птиц 1
 Лекция №4 Содержание и уход за собаками
 Кожно-мышечная чувствительность. Обоняние. Вкус
 Кислотно-основное состояние
 презентация Позвоночные животные
 Собственно соединительные ткани
 Борьба за существование
 Основы экологической биоэнергетики
 Умови проростання насіння