- Business Statistics

Содержание
- 2. Brief Introduction of the lecturer Shirley SHAO Bachelor of Finance, Liaoning University Master of Finance, University
- 3. In Today’s Business World You Cannot Escape From Data In today’s digital world ever increasing amounts
- 4. Each Business Person Faces A Choice Of How To Deal With This Explosion Of Data They
- 5. Statistics Is Evolving So Businesses Can Use The Vast Amount Of Data Available The emerging field
- 6. What is Meant by Statistics? Statistics is the science of collecting, organizing, presenting, analyzing, and interpreting
- 7. Why Study Statistics? Numerical information is everywhere •2.5 EB bytes of data is created every day.
- 8. Why Study Statistics? Today, there are 1.8 billion young people between the ages of 10 and
- 9. Why Study Statistics? Every month, 10 million young people reach working age. It’s a staggering number.
- 10. Why Study Statistics? We are finding ourselves at a time in the world when the world
- 11. Who Uses Statistics? A teacher? A researcher? A coach? A businessman? A government policy maker? etc...
- 12. Who Uses Statistics? Statistical techniques are used extensively by marketing, accounting, finance, quality control, consumers, professional
- 13. How shall we learn for this lesson ? 1. To get the principal knowledge through the
- 14. Business Statistics(6th Edition) (美)莱文,克雷比尔,贝伦森, 中国人民大学出版社,2017. 1. Class Participation 10% 2. Test 10% 3. Homework/ Quiz 10%
- 15. SMART
- 16. Chap 1- Copyright ©2013 Pearson Education, Inc. publishing as Prentice Hall Business Statistics: A First Course
- 17. Chap 1- Copyright ©2013 Pearson Education, Inc. publishing as Prentice Hall Learning Objectives In this chapter
- 18. GOALS 1.Understand why we study statistics. 2.Explain what is meant by descriptive statistics and inferential statistics.
- 19. Chap 1- Copyright ©2013 Pearson Education, Inc. publishing as Prentice Hall In Business, Statistics Helps Transform
- 20. Slide 1- Copyright © 2011 Pearson Education, Inc. Which is correct? The data is . .
- 21. Slide 1- Copyright © 2011 Pearson Education, Inc. Which of the following is not a step
- 22. Slide 1- Copyright © 2011 Pearson Education, Inc. Statistics can be used for Assessing risk Predicting
- 23. Slide 1- Copyright © 2011 Pearson Education, Inc. Statistics is a way of reasoning. True False
- 24. Slide 1- Copyright © 2011 Pearson Education, Inc. Statistics helps us make sense of this so
- 25. Slide 1- Copyright © 2011 Pearson Education, Inc. Which of the following is not an objective
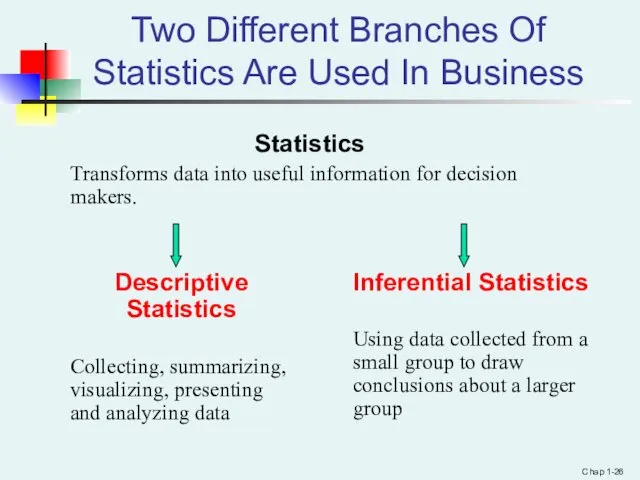
- 26. Chap 1- Two Different Branches Of Statistics Are Used In Business Statistics Transforms data into useful
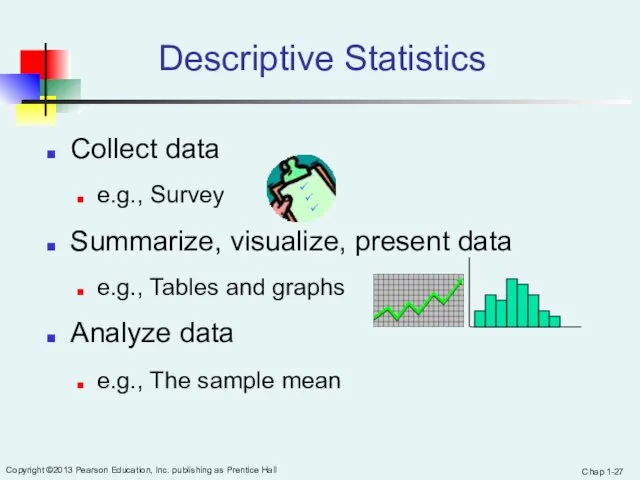
- 27. Chap 1- Copyright ©2013 Pearson Education, Inc. publishing as Prentice Hall Descriptive Statistics Collect data e.g.,
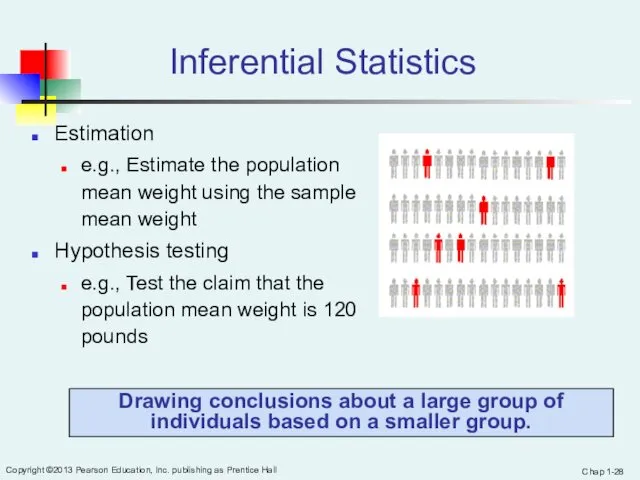
- 28. Chap 1- Copyright ©2013 Pearson Education, Inc. publishing as Prentice Hall Inferential Statistics Estimation e.g., Estimate
- 29. Chap 1- Copyright ©2013 Pearson Education, Inc. publishing as Prentice Hall Understanding Statistics Enhances A Person’s
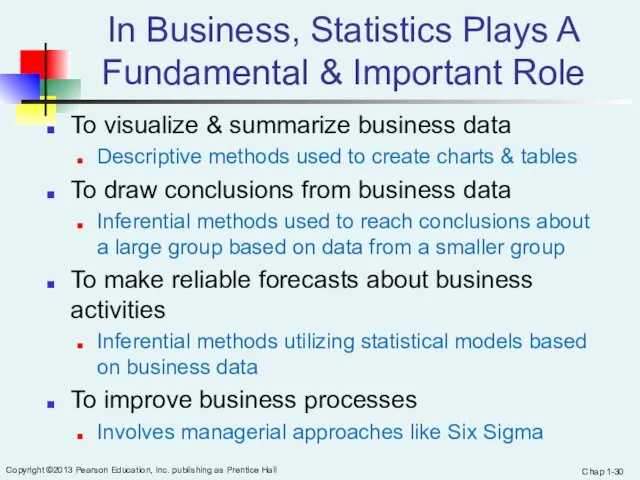
- 30. Chap 1- Copyright ©2013 Pearson Education, Inc. publishing as Prentice Hall In Business, Statistics Plays A
- 31. Chap 1- Copyright ©2013 Pearson Education, Inc. publishing as Prentice Hall Two Trends Are Driving The
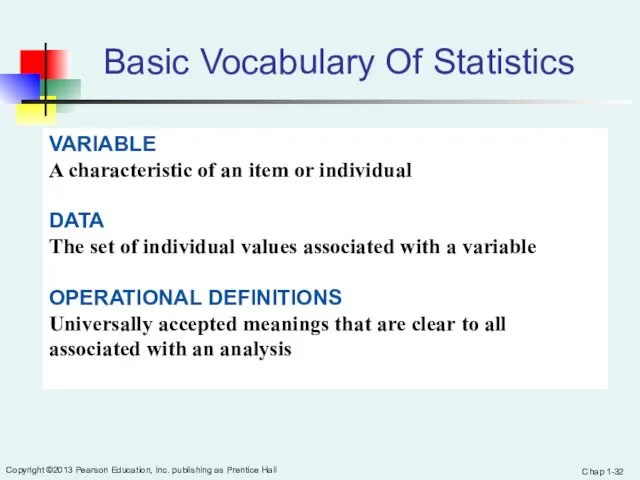
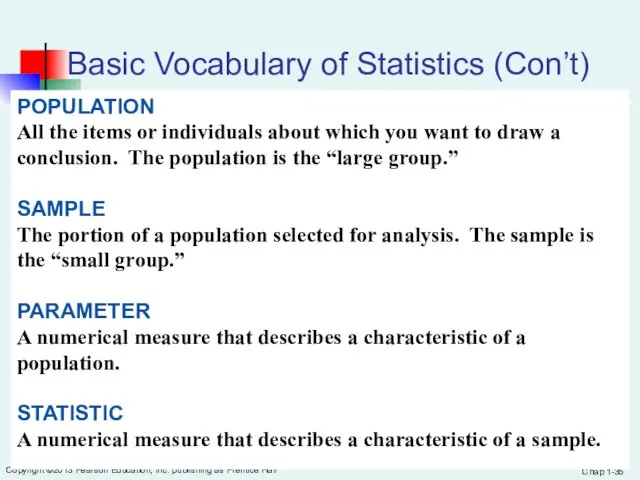
- 32. Chap 1- Copyright ©2013 Pearson Education, Inc. publishing as Prentice Hall Basic Vocabulary Of Statistics
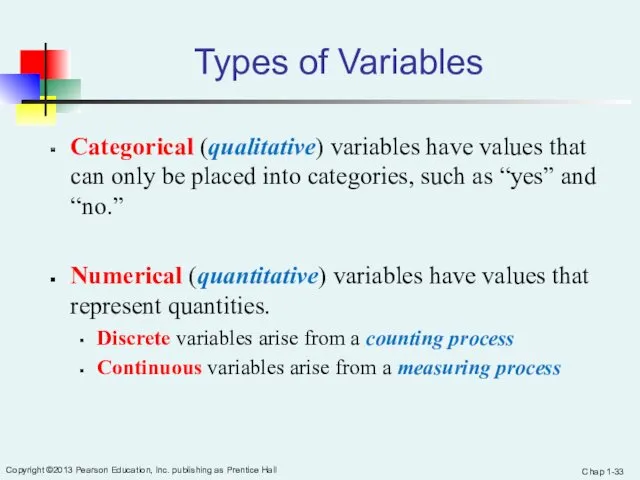
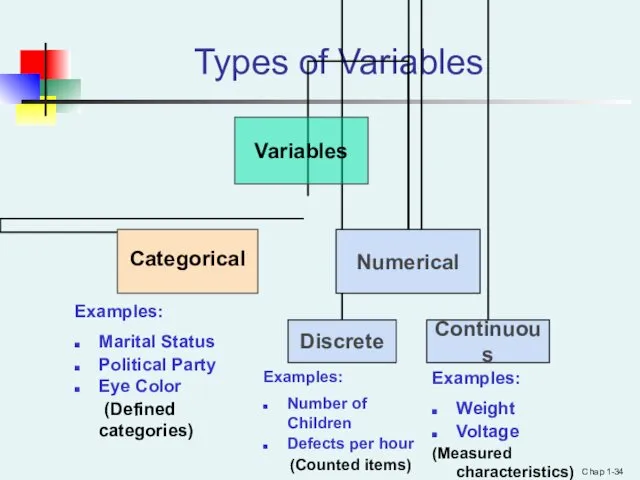
- 33. Chap 1- Copyright ©2013 Pearson Education, Inc. publishing as Prentice Hall Types of Variables Categorical (qualitative)
- 34. Chap 1- Types of Variables Examples: Marital Status Political Party Eye Color (Defined categories) Examples: Number
- 35. Chap 1- Copyright ©2013 Pearson Education, Inc. publishing as Prentice Hall Basic Vocabulary of Statistics (Con’t)
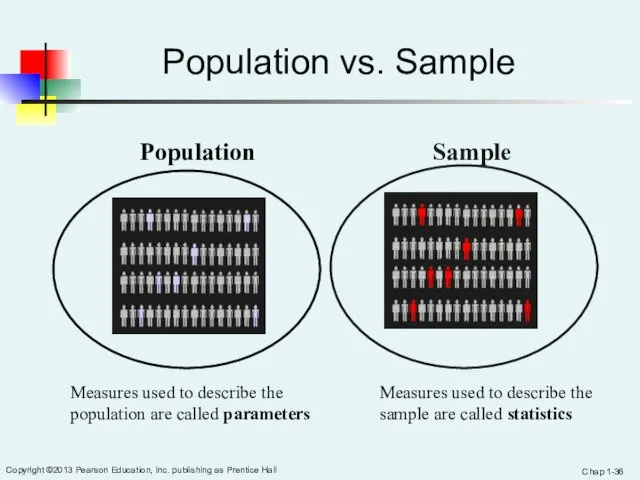
- 36. Chap 1- Copyright ©2013 Pearson Education, Inc. publishing as Prentice Hall Population vs. Sample Population Sample
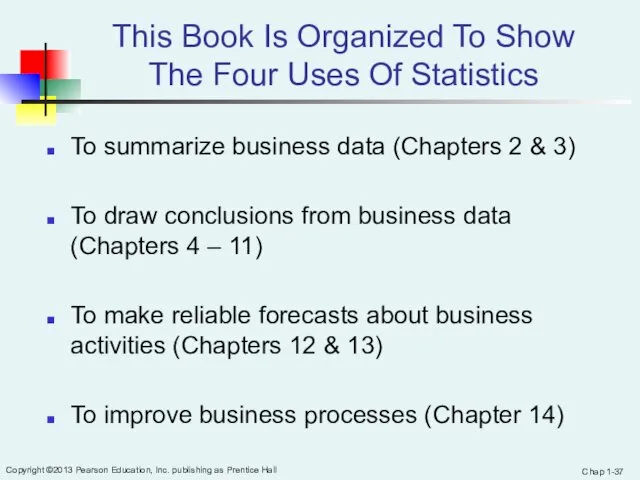
- 37. Chap 1- Copyright ©2013 Pearson Education, Inc. publishing as Prentice Hall This Book Is Organized To
- 38. Slide 1- Copyright © 2011 Pearson Education, Inc. What are data? A bunch of numbers Values
- 39. Slide 2- Copyright © 2011 Pearson Education, Inc. Variables that are numbers are always quantitative. True
- 40. Slide 2- Copyright © 2011 Pearson Education, Inc. Individuals who answer a survey are called: Subjects
- 41. Slide 2- Copyright © 2011 Pearson Education, Inc. The SPCA collects data about the dogs they
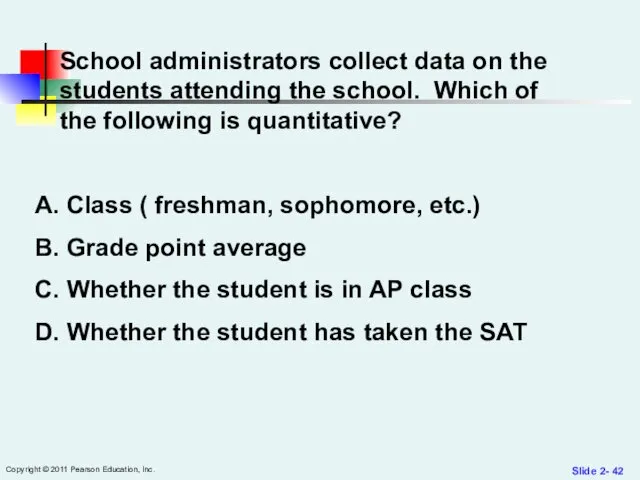
- 42. Slide 2- Copyright © 2011 Pearson Education, Inc. School administrators collect data on the students attending
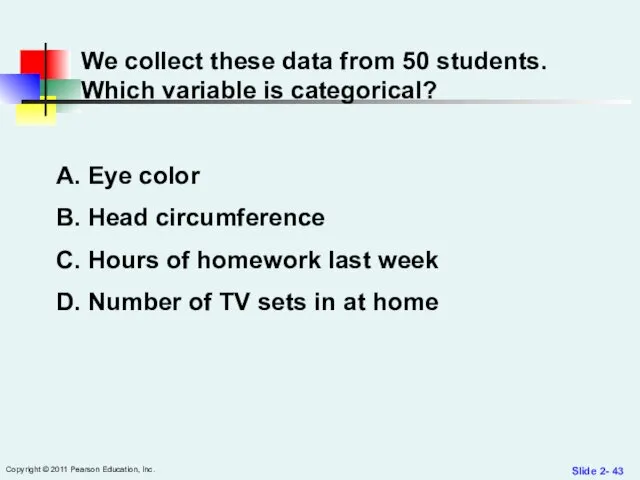
- 43. Slide 2- Copyright © 2011 Pearson Education, Inc. We collect these data from 50 students. Which
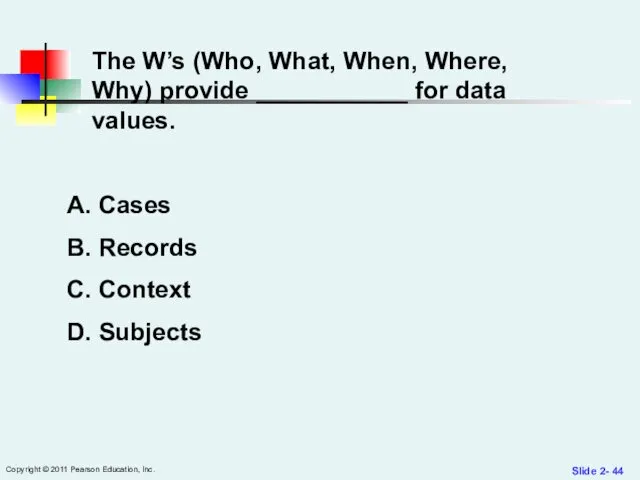
- 44. Slide 2- Copyright © 2011 Pearson Education, Inc. The W’s (Who, What, When, Where, Why) provide
- 45. Chap 1- Copyright ©2013 Pearson Education, Inc. publishing as Prentice Hall Chapter Summary In this chapter
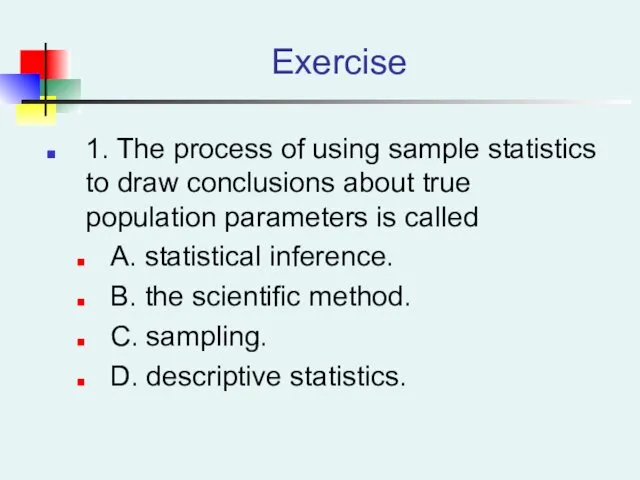
- 46. Exercise 1. The process of using sample statistics to draw conclusions about true population parameters is
- 47. 2. Those methods involving the collection, presentation, and characterization of a set of data in order
- 48. 3. The collection and summarization of the socioeconomic and physical characteristics of the employees of a
- 49. 4. The estimation of the population average family expenditure on food based on the sample average
- 50. 5. The universe or "totality of items or things" under consideration is called A. a sample.
- 51. 6. The portion of the universe that has been selected for analysis is called A. a
- 52. 7. A summary measure that is computed to describe a characteristic from only a sample of
- 53. 8. A summary measure that is computed to describe a characteristic of an entire population is
- 54. 9. Which of the following is most likely a population as opposed to a sample? A.
- 55. 10. Which of the following is most likely a parameter as opposed to a statistic? A.
- 56. 11. Which of the following is not an element of descriptive statistical problems? A. An inference
- 57. 12. A study is under way in Yosemite National Forest to determine the adult height of
- 58. 13. A study is under way in Yosemite National Forest… Identify the variable of interest in
- 60. Скачать презентацию
Brief Introduction of the lecturer
Shirley SHAO
Bachelor of Finance, Liaoning University
Master of
Brief Introduction of the lecturer
Shirley SHAO
Bachelor of Finance, Liaoning University
Master of
In Today’s Business World You Cannot Escape From Data
In today’s digital
In Today’s Business World You Cannot Escape From Data
In today’s digital
Each Business Person Faces A Choice Of How To Deal With
Each Business Person Faces A Choice Of How To Deal With
Statistics Is Evolving So Businesses Can Use The Vast Amount Of
Statistics Is Evolving So Businesses Can Use The Vast Amount Of
What is Meant by Statistics?
Statistics is the science of collecting, organizing,
What is Meant by Statistics?
Statistics is the science of collecting, organizing,
Why Study Statistics?
Numerical information is everywhere
•2.5 EB bytes of data is
Why Study Statistics?
Numerical information is everywhere
•2.5 EB bytes of data is
Why Study Statistics?
Today, there are 1.8 billion young people between the
Why Study Statistics?
Today, there are 1.8 billion young people between the
Why Study Statistics?
Every month, 10 million young people reach working age.
Why Study Statistics?
Every month, 10 million young people reach working age.
Why Study Statistics?
We are finding ourselves at a time in the
Why Study Statistics?
We are finding ourselves at a time in the
Who Uses Statistics?
A teacher?
A researcher?
A coach?
A businessman?
A government policy maker?
etc...
Chap 1-
Who Uses Statistics?
A teacher?
A researcher?
A coach?
A businessman?
A government policy maker?
etc...
Chap 1-
Who Uses Statistics?
Statistical techniques are used extensively by marketing, accounting, finance,
Who Uses Statistics?
Statistical techniques are used extensively by marketing, accounting, finance,
How
shall we learn for this lesson ?
1. To get the
How
shall we learn for this lesson ?
1. To get the
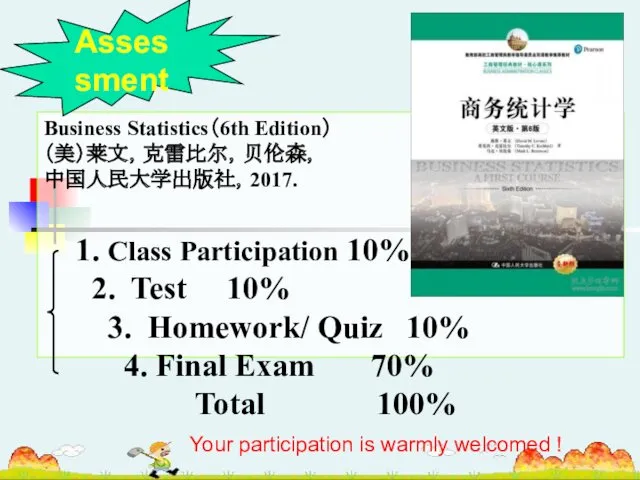
Business Statistics(6th Edition)
(美)莱文,克雷比尔,贝伦森,
中国人民大学出版社,2017.
1. Class Participation 10%
2. Test 10%
Business Statistics(6th Edition)
(美)莱文,克雷比尔,贝伦森,
中国人民大学出版社,2017.
1. Class Participation 10%
2. Test 10%
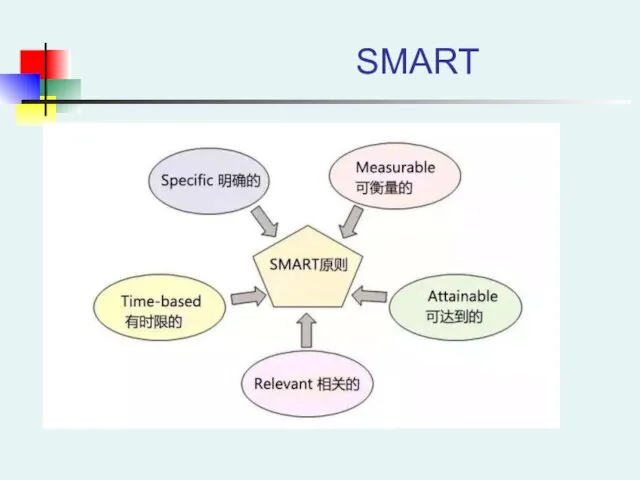
SMART
SMART
Chap 1-
Copyright ©2013 Pearson Education, Inc. publishing as Prentice Hall
Business
Chap 1-
Copyright ©2013 Pearson Education, Inc. publishing as Prentice Hall
Business
Chap 1-
Copyright ©2013 Pearson Education, Inc. publishing as Prentice Hall
Learning
Chap 1-
Copyright ©2013 Pearson Education, Inc. publishing as Prentice Hall
Learning
GOALS
1.Understand why we study statistics.
2.Explain what is meant by descriptive statistics
GOALS
1.Understand why we study statistics.
2.Explain what is meant by descriptive statistics
Chap 1-
Copyright ©2013 Pearson Education, Inc. publishing as Prentice Hall
In
Chap 1-
Copyright ©2013 Pearson Education, Inc. publishing as Prentice Hall
In
Slide 1-
Copyright © 2011 Pearson Education, Inc.
Which is correct?
The
Slide 1-
Copyright © 2011 Pearson Education, Inc.
Which is correct?
The
Slide 1-
Copyright © 2011 Pearson Education, Inc.
Which of the following
Slide 1-
Copyright © 2011 Pearson Education, Inc.
Which of the following
Slide 1-
Copyright © 2011 Pearson Education, Inc.
Statistics can be used
Slide 1-
Copyright © 2011 Pearson Education, Inc.
Statistics can be used
Slide 1-
Copyright © 2011 Pearson Education, Inc.
Statistics is a way
Slide 1-
Copyright © 2011 Pearson Education, Inc.
Statistics is a way
Slide 1-
Copyright © 2011 Pearson Education, Inc.
Statistics helps us make
Slide 1-
Copyright © 2011 Pearson Education, Inc.
Statistics helps us make
Slide 1-
Copyright © 2011 Pearson Education, Inc.
Which of the following
Slide 1-
Copyright © 2011 Pearson Education, Inc.
Which of the following
Chap 1-
Two Different Branches Of Statistics Are Used In Business
Statistics
Transforms
Chap 1-
Two Different Branches Of Statistics Are Used In Business
Statistics
Transforms
Chap 1-
Copyright ©2013 Pearson Education, Inc. publishing as Prentice Hall
Descriptive
Chap 1-
Copyright ©2013 Pearson Education, Inc. publishing as Prentice Hall
Descriptive
Chap 1-
Copyright ©2013 Pearson Education, Inc. publishing as Prentice Hall
Inferential
Chap 1-
Copyright ©2013 Pearson Education, Inc. publishing as Prentice Hall
Inferential
Chap 1-
Copyright ©2013 Pearson Education, Inc. publishing as Prentice Hall
Understanding
Chap 1-
Copyright ©2013 Pearson Education, Inc. publishing as Prentice Hall
Understanding
Chap 1-
Copyright ©2013 Pearson Education, Inc. publishing as Prentice Hall
In
Chap 1-
Copyright ©2013 Pearson Education, Inc. publishing as Prentice Hall
In
Chap 1-
Copyright ©2013 Pearson Education, Inc. publishing as Prentice Hall
Two
Chap 1-
Copyright ©2013 Pearson Education, Inc. publishing as Prentice Hall
Two
Chap 1-
Copyright ©2013 Pearson Education, Inc. publishing as Prentice Hall
Basic
Chap 1-
Copyright ©2013 Pearson Education, Inc. publishing as Prentice Hall
Basic
Chap 1-
Copyright ©2013 Pearson Education, Inc. publishing as Prentice Hall
Types
Chap 1-
Copyright ©2013 Pearson Education, Inc. publishing as Prentice Hall
Types
Chap 1-
Types of Variables
Examples:
Marital Status
Political Party
Eye Color
(Defined categories)
Examples:
Number of Children
Defects
Chap 1-
Types of Variables
Examples:
Marital Status
Political Party
Eye Color
(Defined categories)
Examples:
Number of Children
Defects
Chap 1-
Copyright ©2013 Pearson Education, Inc. publishing as Prentice Hall
Basic
Chap 1-
Copyright ©2013 Pearson Education, Inc. publishing as Prentice Hall
Basic
Chap 1-
Copyright ©2013 Pearson Education, Inc. publishing as Prentice Hall
Population
Chap 1-
Copyright ©2013 Pearson Education, Inc. publishing as Prentice Hall
Population
Chap 1-
Copyright ©2013 Pearson Education, Inc. publishing as Prentice Hall
This
Chap 1-
Copyright ©2013 Pearson Education, Inc. publishing as Prentice Hall
This
Slide 1-
Copyright © 2011 Pearson Education, Inc.
What are data?
Slide 1-
Copyright © 2011 Pearson Education, Inc.
What are data?
Slide 2-
Copyright © 2011 Pearson Education, Inc.
Variables that are
Slide 2-
Copyright © 2011 Pearson Education, Inc.
Variables that are
Slide 2-
Copyright © 2011 Pearson Education, Inc.
Individuals who answer
Slide 2-
Copyright © 2011 Pearson Education, Inc.
Individuals who answer
Slide 2-
Copyright © 2011 Pearson Education, Inc.
The SPCA collects
Slide 2-
Copyright © 2011 Pearson Education, Inc.
The SPCA collects
Slide 2-
Copyright © 2011 Pearson Education, Inc.
School administrators collect
Slide 2-
Copyright © 2011 Pearson Education, Inc.
School administrators collect
Slide 2-
Copyright © 2011 Pearson Education, Inc.
We collect these
Slide 2-
Copyright © 2011 Pearson Education, Inc.
We collect these
Slide 2-
Copyright © 2011 Pearson Education, Inc.
The W’s (Who,
Slide 2-
Copyright © 2011 Pearson Education, Inc.
The W’s (Who,
Chap 1-
Copyright ©2013 Pearson Education, Inc. publishing as Prentice Hall
Chapter
Chap 1-
Copyright ©2013 Pearson Education, Inc. publishing as Prentice Hall
Chapter
Exercise
1. The process of using sample statistics to draw conclusions about
Exercise
1. The process of using sample statistics to draw conclusions about
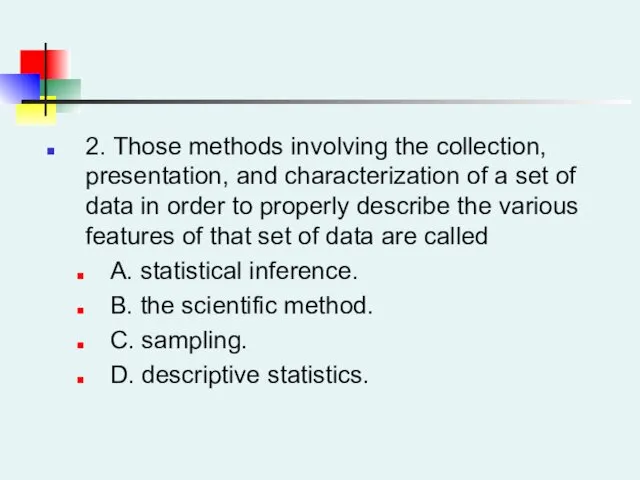
2. Those methods involving the collection, presentation, and characterization of a
2. Those methods involving the collection, presentation, and characterization of a
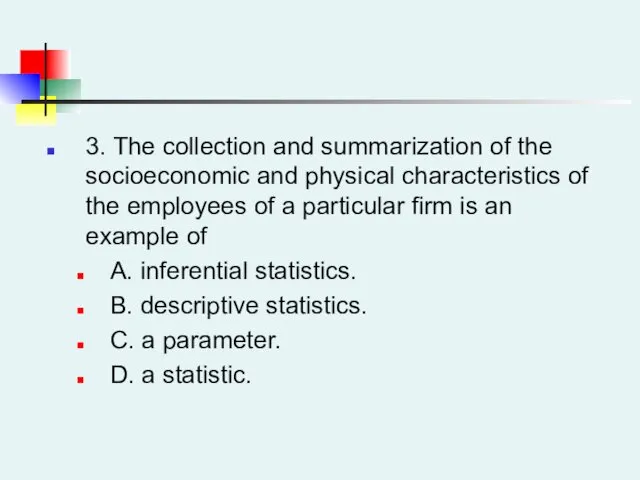
3. The collection and summarization of the socioeconomic and physical characteristics
3. The collection and summarization of the socioeconomic and physical characteristics
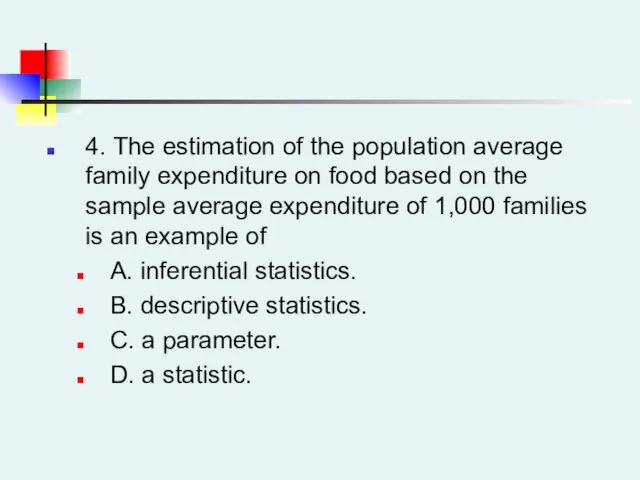
4. The estimation of the population average family expenditure on food
4. The estimation of the population average family expenditure on food
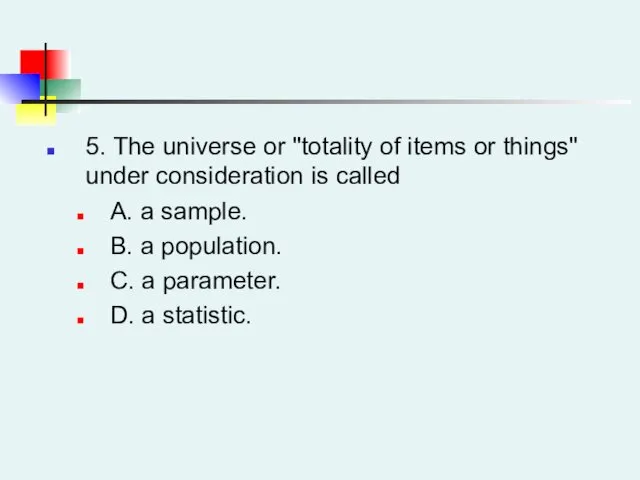
5. The universe or "totality of items or things" under consideration
5. The universe or "totality of items or things" under consideration
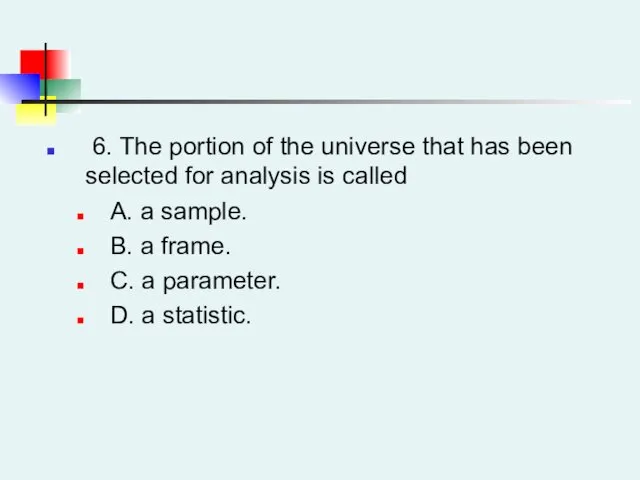
6. The portion of the universe that has been selected
6. The portion of the universe that has been selected
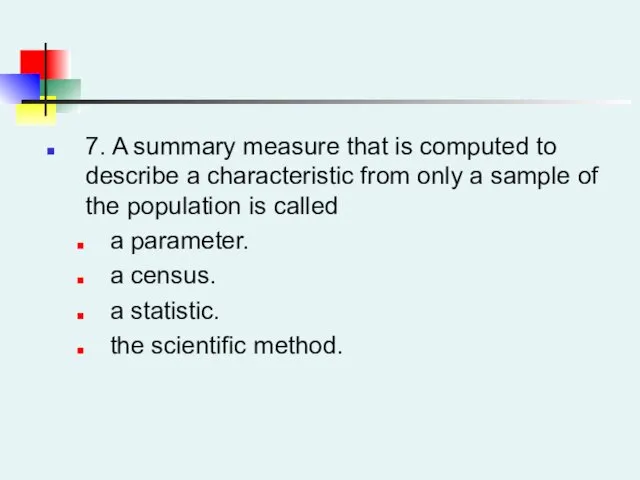
7. A summary measure that is computed to describe a characteristic
7. A summary measure that is computed to describe a characteristic
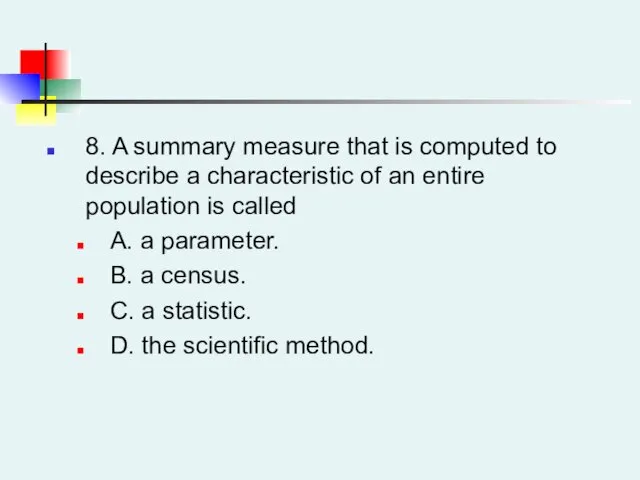
8. A summary measure that is computed to describe a characteristic
8. A summary measure that is computed to describe a characteristic
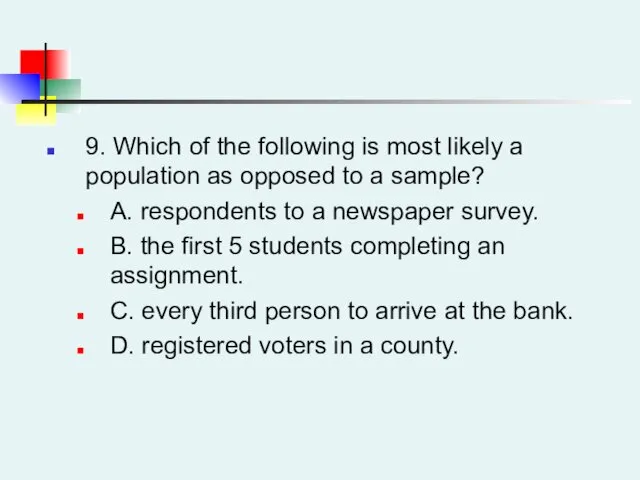
9. Which of the following is most likely a population as
9. Which of the following is most likely a population as
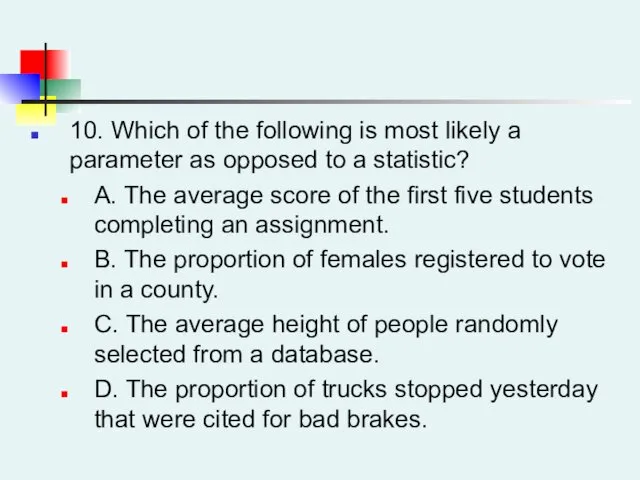
10. Which of the following is most likely a parameter as
10. Which of the following is most likely a parameter as
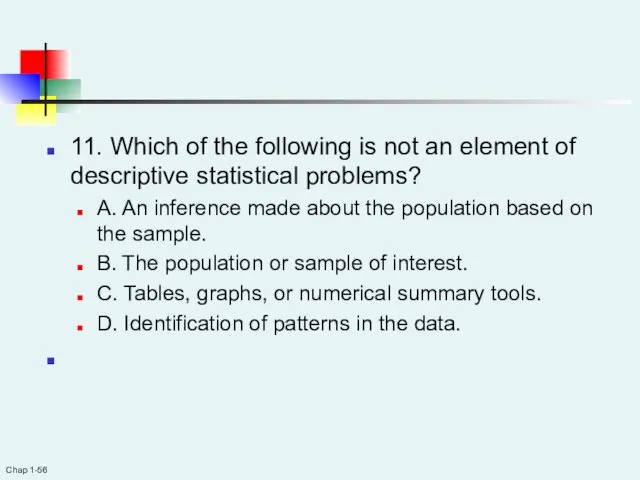
11. Which of the following is not an element of descriptive
11. Which of the following is not an element of descriptive
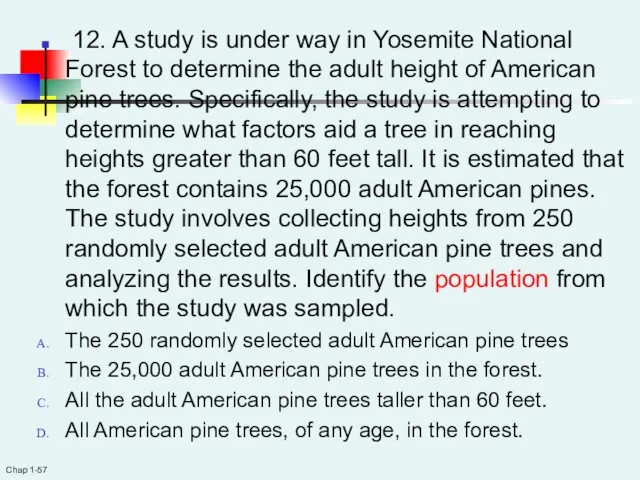
12. A study is under way in Yosemite National Forest
12. A study is under way in Yosemite National Forest
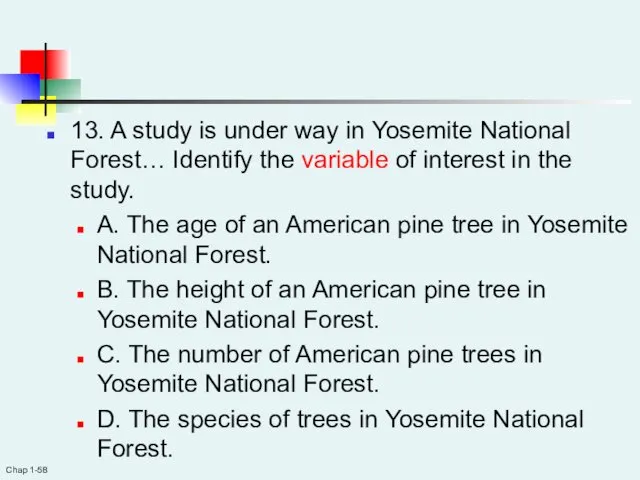
13. A study is under way in Yosemite National Forest… Identify
13. A study is under way in Yosemite National Forest… Identify
 Global case challenge de Mexico. Develop a product strategy for the international entry
 Выбор франшизы в сфере оказания услуг курения кальяна в Москве и Подмосковье
 Полезные обеды в офис
 Формирование кадровой политики для малых отелей (на примере ООО Отель Виноградово)
 Прохождение курса в Like-центре. Цель на время прохождения курса
 Sustainability as a business model
 Бизнес-план малого предприятия Мини-пекарня <<Счастье есть>>
 TNT РОССИЯ партнерство
 Коммерциализация IT проектов
 Agri Frontier Limited is an agri investment and agribusiness advisory firm
 Бизнес-план. Разведение перепелов
 Бизнес-план организации ветеринарной клиники. Подбор помещения
 Бизнес-отчет дилера GEA
 Федеральная программа Ты - предприниматель
 Организация гостиничного обслуживания
 Академия Маленьких Принцесс
 Стратегия вашего успеха
 Предпринимательство и предпринимательская деятельность
 Разработка комплекса мероприятий по совершенствованию технологий обслуживания VIP-гостей гостиницы Холидей Инн Лесная
 Companies. Types of companies. Company performance
 Поддержка в условиях санкций
 Организация и ведение бизнеса
 Гостиницы Японии (Токио)
 Кав’ярня на 30 місць
 Бизнес-жоспар Туристік компания
 Средства размещения туристов и их особенности
 Бизнес-план ООО Food_Like
 Курорты Европы. Бальнеологические курорты Венгрии