- Market performance report Business Excellence Russia

Содержание
- 2. Key highlights: Overall market In Jan-Jul 2020, Russian pharmaceutical market grew by + 14% in value
- 3. Ключевые выводы Рынок в целом С начала 2020 года российский фармацевтический рынок вырос на 14% в
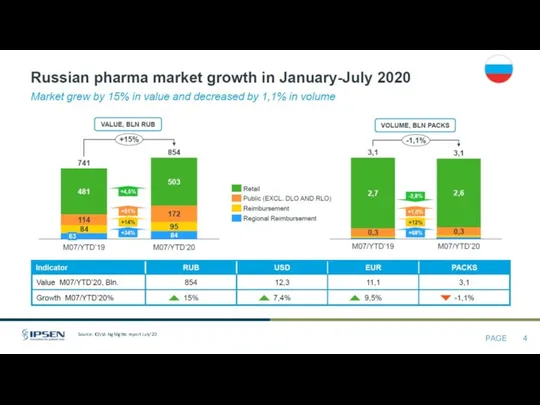
- 4. Source: IQVIA highlights report July’20
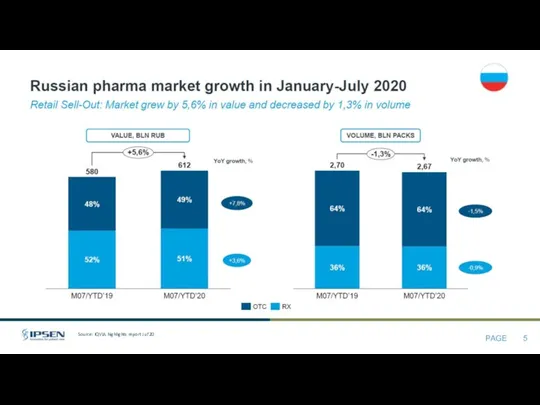
- 5. Source: IQVIA highlights report Jul’20
- 6. Ipsen place on the market In MAT Jul’20 Ipsen overperformed Rompharm, Geropharm and gained 54th place
- 7. Ipsen place on the market – with aesthetic With aesthetic business Ipsen is being in TOP-50.
- 8. Ipsen MS evolution Jul 20 MAT Dynamic shows the improvement of SC market share. CHC share
- 9. Ipsen vs Russian market growth In Jul Ipsen is growing same as market with 4%. Market
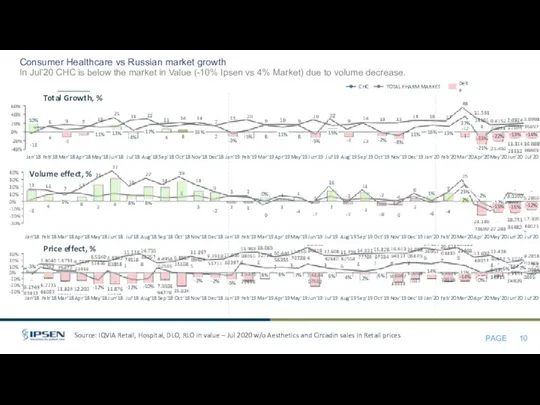
- 10. Consumer Healthcare vs Russian market growth In Jul’20 CHC is below the market in Value (-10%
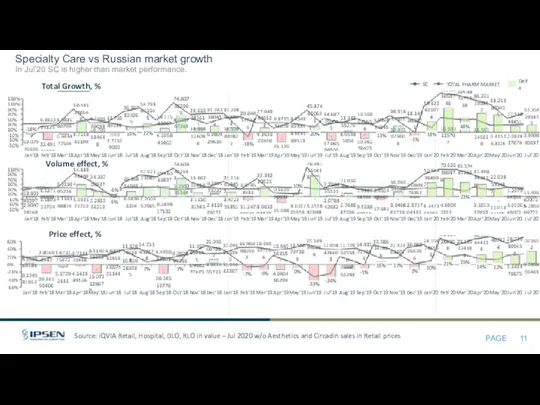
- 11. Specialty Care vs Russian market growth In Jul’20 SC is higher than market performance. Aug’18 19%
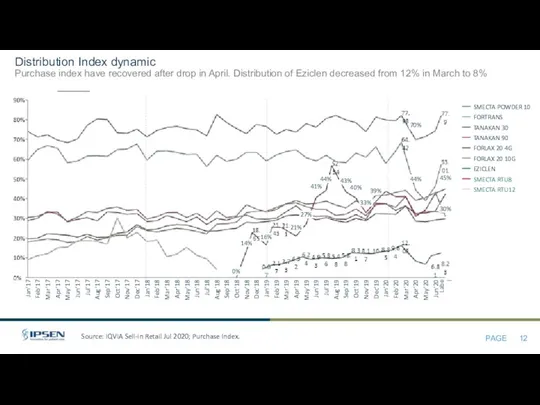
- 12. Distribution Index dynamic Purchase index have recovered after drop in April. Distribution of Eziclen decreased from
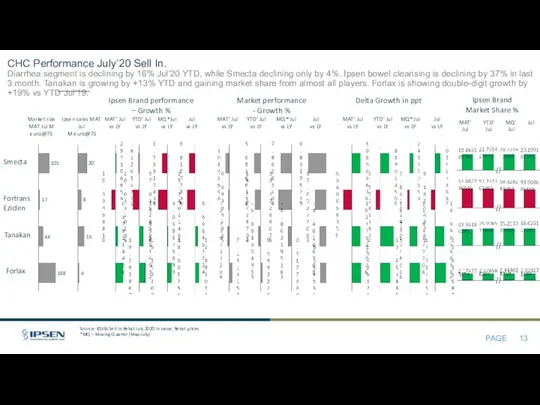
- 13. Ipsen Brand Market Share % YTD’ Jul MQ’ Jul MQ*’Jul vs LY CHC Performance July’20 Sell
- 14. Smecta retail performance Smecta gained +2.1 pts MS in MAT’Jul 20 vs LY but decreased in
- 15. Smecta regional performance. In last 3 month sales of Smecta have decreased by 18%-30% decline, following
- 16. Source: IQVIA Shipments Database, value Smecta RQ Performance by employees (Medical line) May'20-Jul'20 Please find details
- 17. Source: IQVIA Shipments Database, value Smecta RQ Performance by employees (Pharm & Mix lines) May'20-Jul'20 Mix
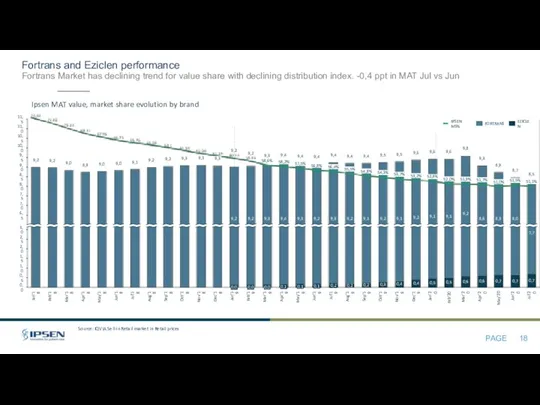
- 18. Fortrans and Eziclen performance Fortrans Market has declining trend for value share with declining distribution index.
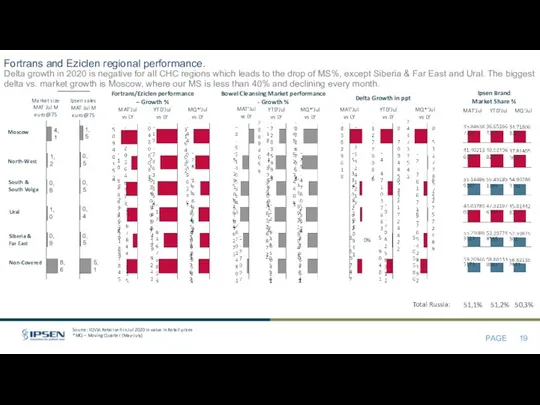
- 19. Fortrans and Eziclen regional performance. Delta growth in 2020 is negative for all CHC regions which
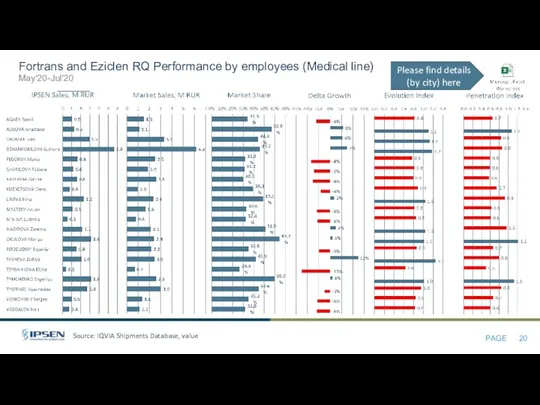
- 20. Source: IQVIA Shipments Database, value Fortrans and Eziclen RQ Performance by employees (Medical line) May'20-Jul'20 Please
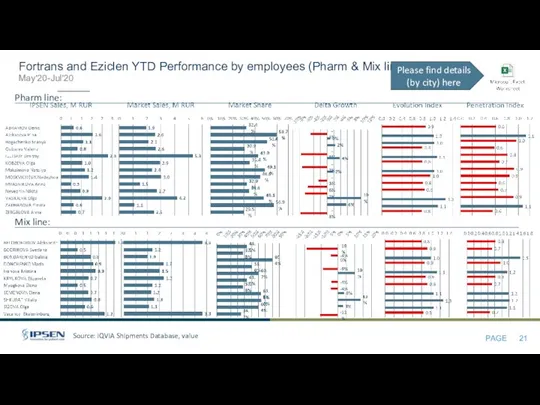
- 21. Source: IQVIA Shipments Database, value Fortrans and Eziclen YTD Performance by employees (Pharm & Mix lines)
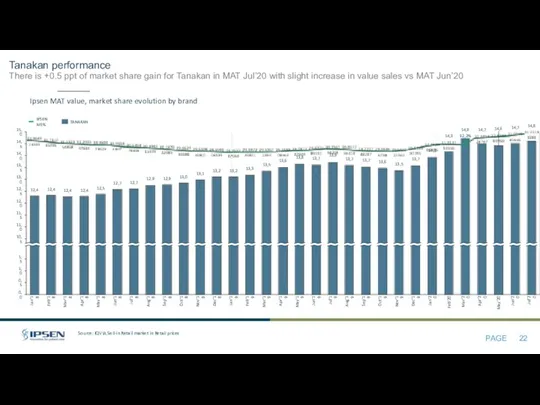
- 22. Tanakan performance There is +0.5 ppt of market share gain for Tanakan in MAT Jul’20 with
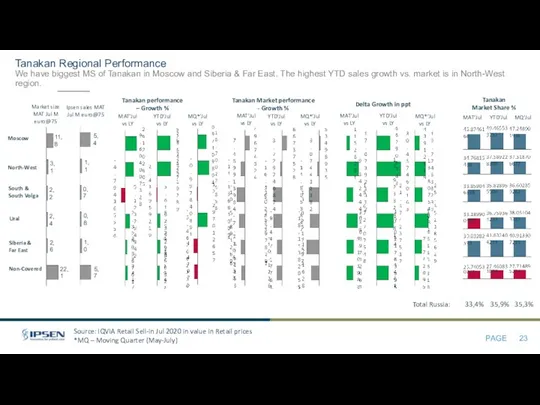
- 23. Tanakan Regional Performance We have biggest MS of Tanakan in Moscow and Siberia & Far East.
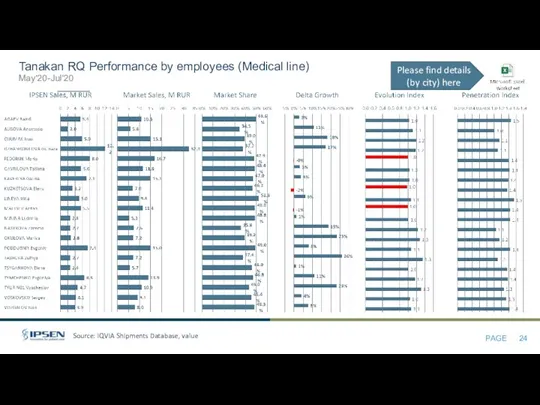
- 24. Source: IQVIA Shipments Database, value Tanakan RQ Performance by employees (Medical line) May'20-Jul'20 Please find details
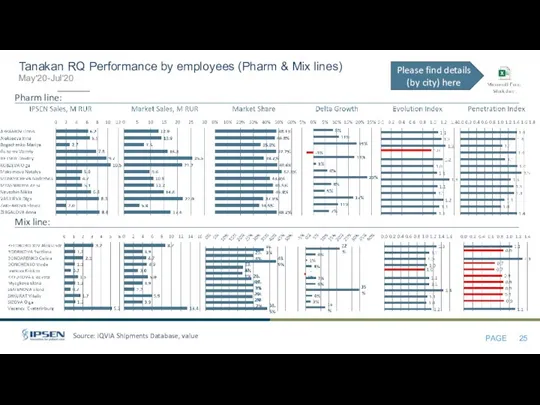
- 25. Source: IQVIA Shipments Database, value Tanakan RQ Performance by employees (Pharm & Mix lines) May'20-Jul'20 Mix
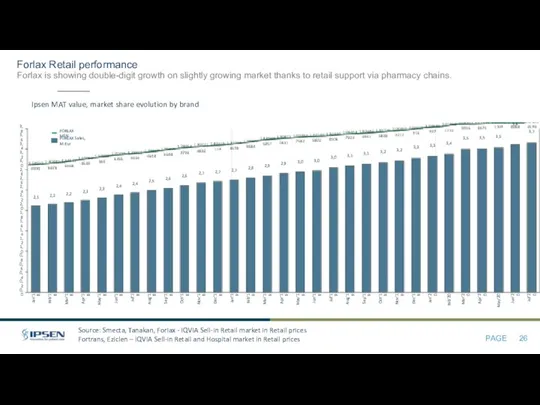
- 26. Forlax Retail performance Forlax is showing double-digit growth on slightly growing market thanks to retail support
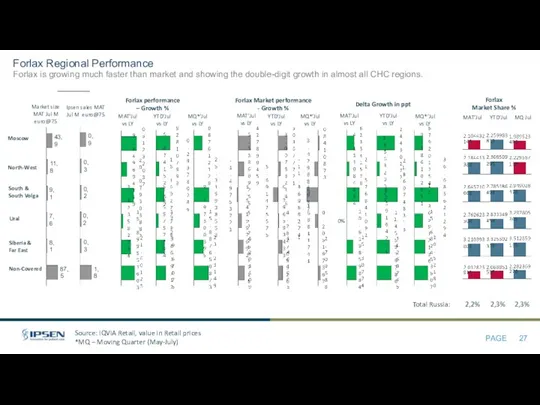
- 27. Forlax Regional Performance Forlax is growing much faster than market and showing the double-digit growth in
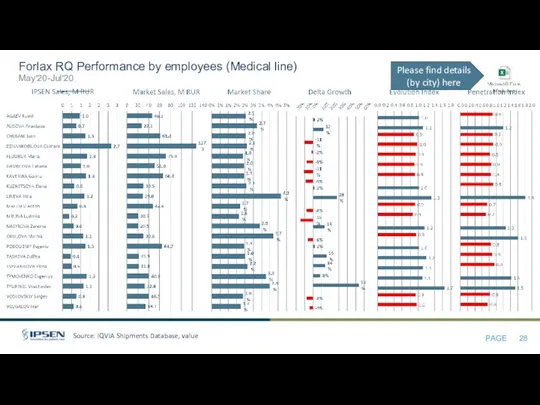
- 28. Source: IQVIA Shipments Database, value Forlax RQ Performance by employees (Medical line) May'20-Jul'20 Please find details
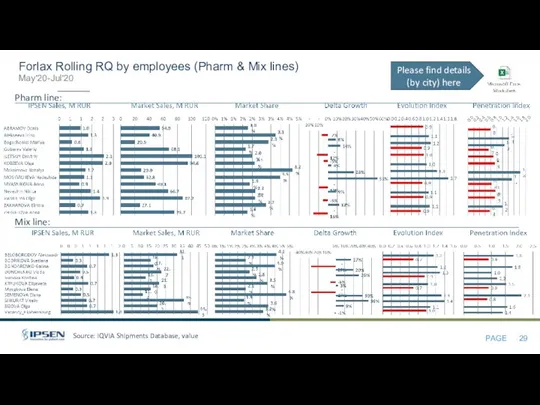
- 29. Source: IQVIA Shipments Database, value Forlax Rolling RQ by employees (Pharm & Mix lines) May'20-Jul'20 Mix
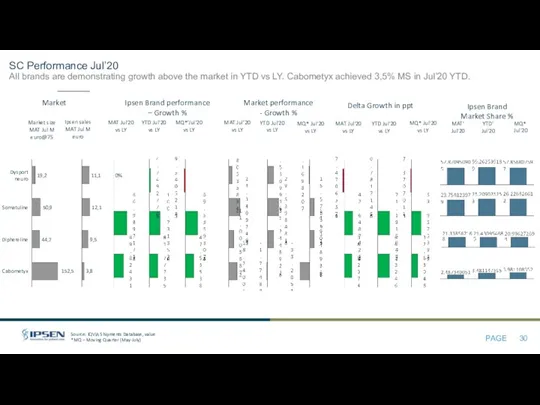
- 30. SC Performance Jul’20 All brands are demonstrating growth above the market in YTD vs LY. Cabometyx
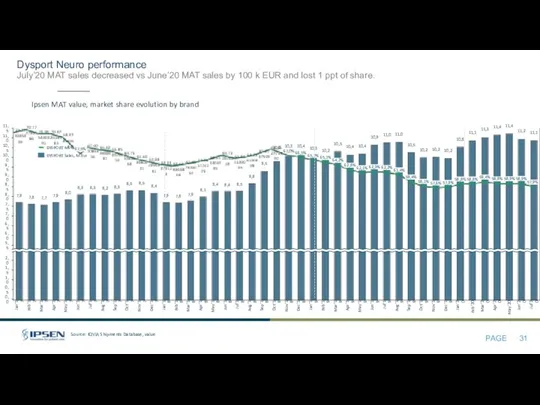
- 31. Dysport Neuro performance July’20 MAT sales decreased vs June’20 MAT sales by 100 k EUR and
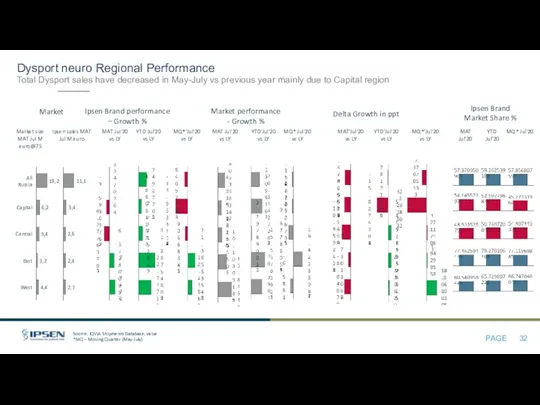
- 32. MQ*’Jul'20 vs LY Ipsen Brand performance – Growth % Market performance - Growth % Delta Growth
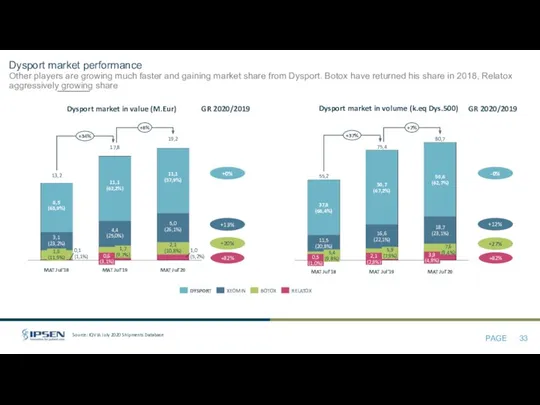
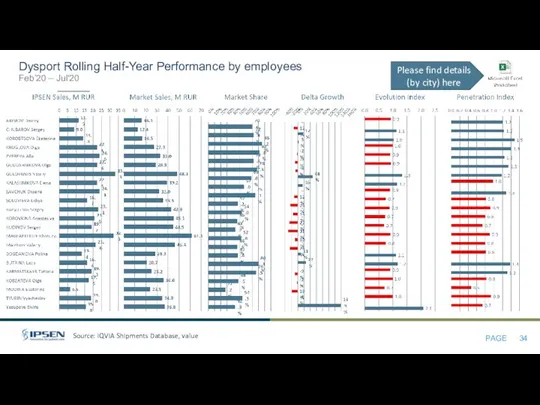
- 33. Dysport market performance Other players are growing much faster and gaining market share from Dysport. Botox
- 34. Source: IQVIA Shipments Database, value Dysport Rolling Half-Year Performance by employees Feb’20 – Jul'20 Please find
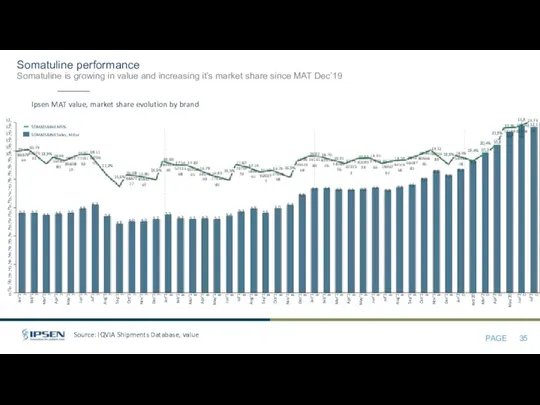
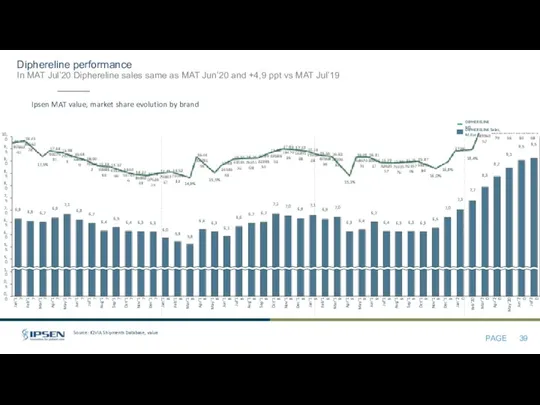
- 35. Somatuline performance Somatuline is growing in value and increasing it’s market share since MAT Dec’19 Source:
- 36. MQ*’Jul'20 vs LY Ipsen Brand performance – Growth % Market performance - Growth % Delta Growth
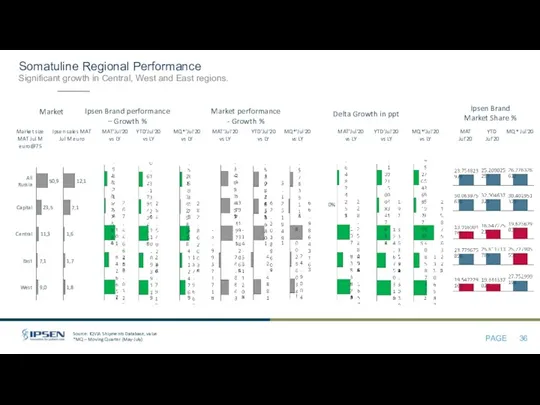
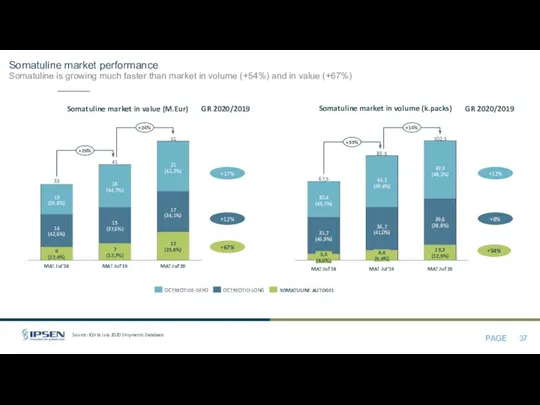
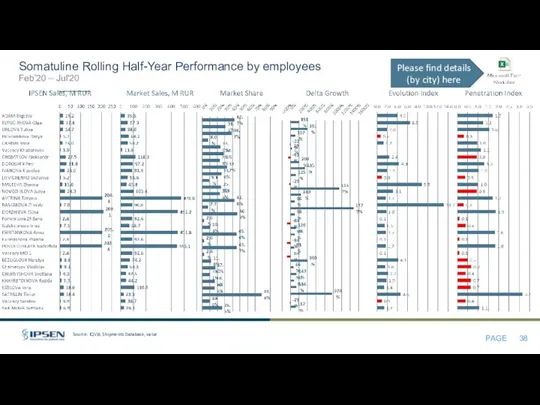
- 37. Somatuline market performance Somatuline is growing much faster than market in volume (+54%) and in value
- 38. Source: IQVIA Shipments Database, value Somatuline Rolling Half-Year Performance by employees Feb’20 – Jul'20 Please find
- 39. Diphereline performance In MAT Jul’20 Diphereline sales same as MAT Jun’20 and +4,9 ppt vs MAT
- 40. MQ*’Jul'20 vs LY Ipsen Brand performance – Growth % Market performance - Growth % Delta Growth
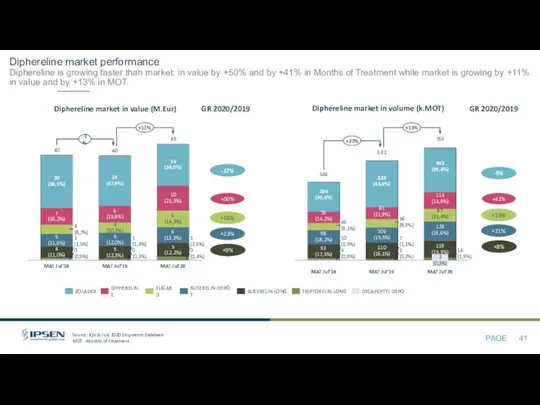
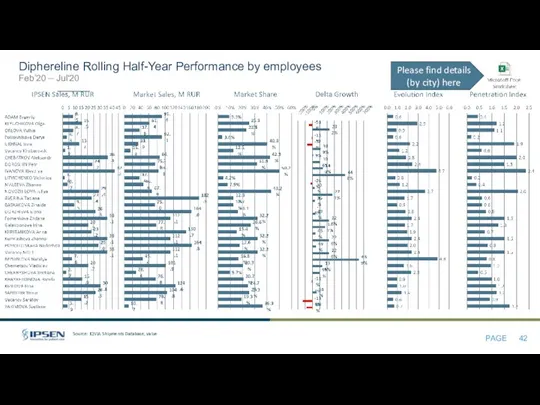
- 41. Diphereline market performance Diphereline is growing faster than market: in value by +50% and by +41%
- 42. Source: IQVIA Shipments Database, value Diphereline Rolling Half-Year Performance by employees Feb’20 – Jul'20 Please find
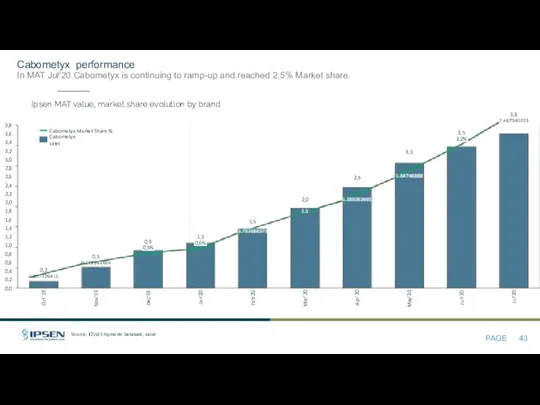
- 43. Cabometyx performance In MAT Jul’20 Cabometyx is continuing to ramp-up and reached 2,5% Market share. Ipsen
- 44. 19,6 (12,8%) 6,2 10,1 41,6 (32,2%) 30,4 (23,6%) 10,4 8,6 18,6 (14,4%) 5,8 3,7 3,7 0,0
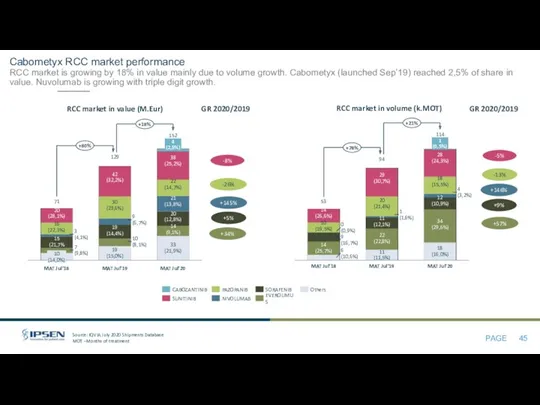
- 45. Cabometyx RCC market performance RCC market is growing by 18% in value mainly due to volume
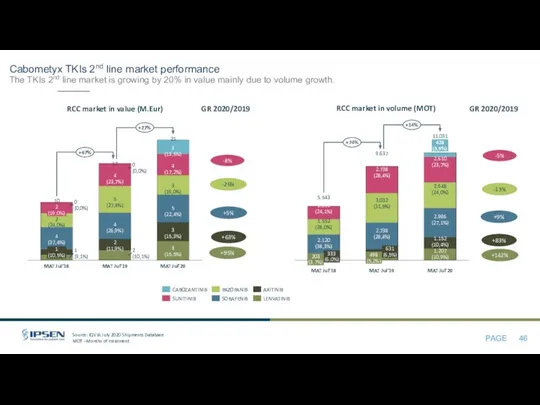
- 46. Cabometyx TKIs 2nd line market performance The TKIs 2nd line market is growing by 20% in
- 47. 24,5 1,0 25,0 23,0 19,5 24,0 20,5 0,5 20,0 0,0 1,5 3,0 3,5 23,5 21,5 4,0
- 48. 2,2 0,8 3,0 0,2 1,2 0,0 3,2 0,6 0,4 1,0 2,4 1,4 2,8 2,6 1,6 1,8
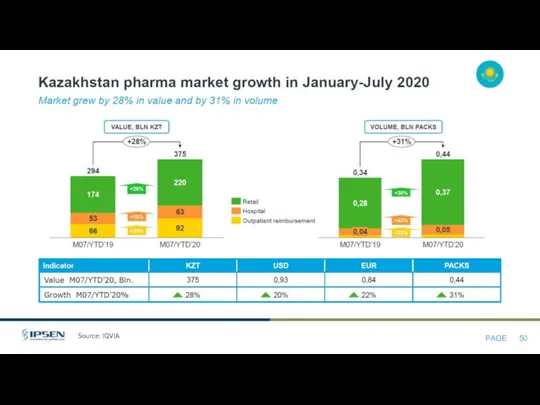
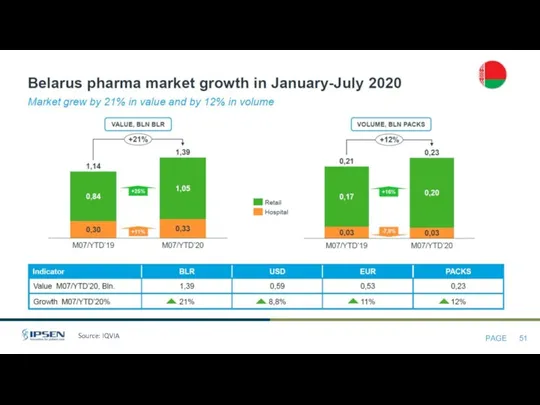
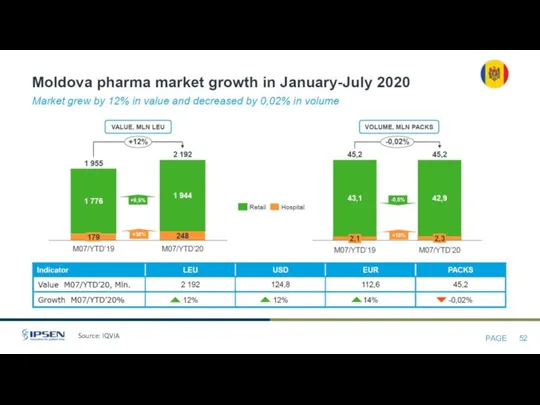
- 49. CIS Countries
- 50. Source: IQVIA
- 51. Source: IQVIA
- 52. Source: IQVIA
- 53. Appendix
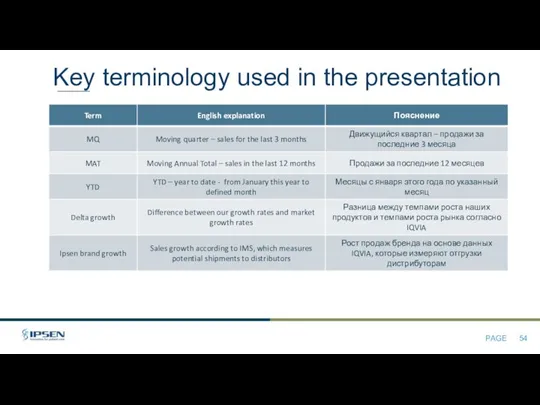
- 54. Key terminology used in the presentation
- 56. Скачать презентацию
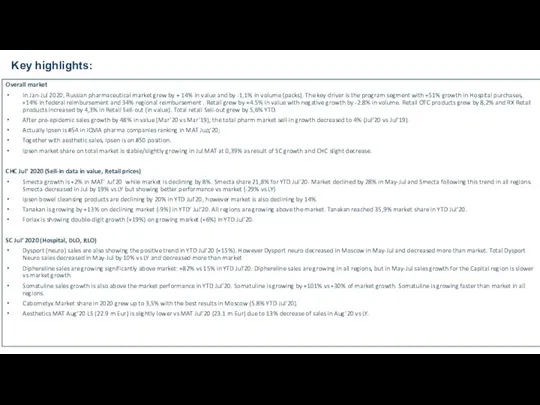
Key highlights:
Overall market
In Jan-Jul 2020, Russian pharmaceutical market grew by + 14% in
Key highlights:
Overall market
In Jan-Jul 2020, Russian pharmaceutical market grew by + 14% in
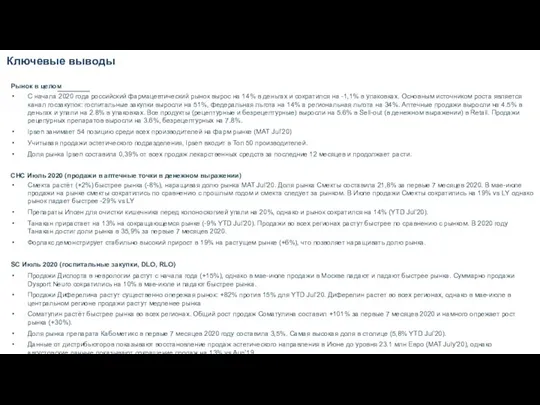
Ключевые выводы
Рынок в целом
С начала 2020 года российский фармацевтический рынок вырос на 14%
Ключевые выводы
Рынок в целом
С начала 2020 года российский фармацевтический рынок вырос на 14%
Source: IQVIA highlights report July’20
Source: IQVIA highlights report July’20
Source: IQVIA highlights report Jul’20
Source: IQVIA highlights report Jul’20
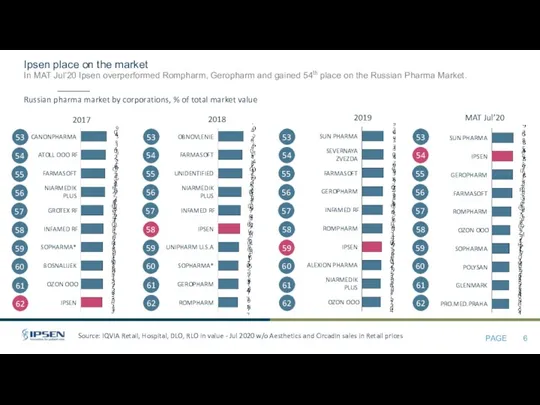
Ipsen place on the market
In MAT Jul’20 Ipsen overperformed Rompharm, Geropharm and gained
Ipsen place on the market In MAT Jul’20 Ipsen overperformed Rompharm, Geropharm and gained
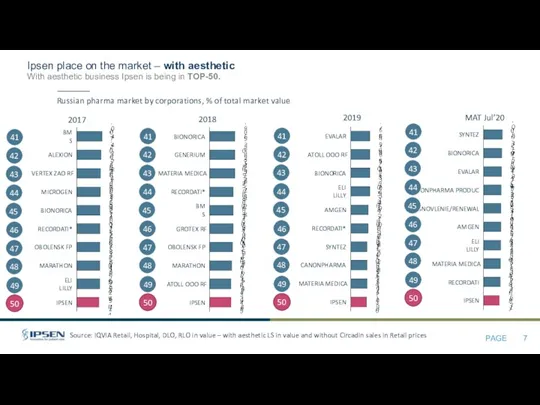
Ipsen place on the market – with aesthetic
With aesthetic business Ipsen is being
Ipsen place on the market – with aesthetic With aesthetic business Ipsen is being
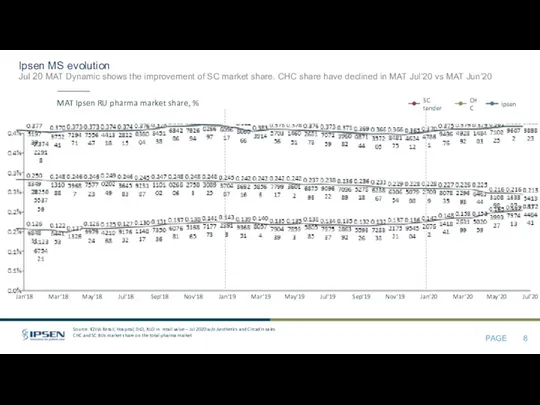
Ipsen MS evolution
Jul 20 MAT Dynamic shows the improvement of SC market share.
Ipsen MS evolution Jul 20 MAT Dynamic shows the improvement of SC market share.
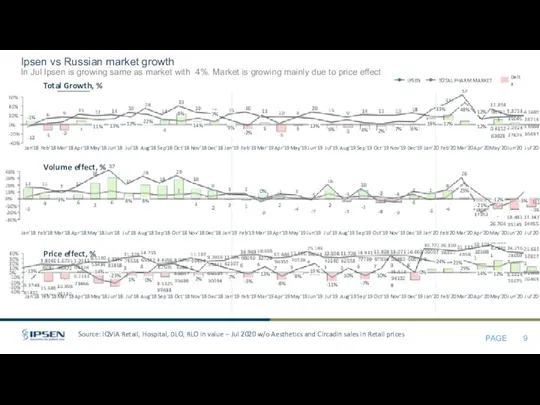
Ipsen vs Russian market growth
In Jul Ipsen is growing same as market with
Ipsen vs Russian market growth In Jul Ipsen is growing same as market with
Consumer Healthcare vs Russian market growth
In Jul’20 CHC is below the market in
Consumer Healthcare vs Russian market growth In Jul’20 CHC is below the market in
Specialty Care vs Russian market growth
In Jul’20 SC is higher than market performance.
Aug’18
19%
Mar’20
Dec’18
18%
Mar’18
-18%
Oct’18
Jan’18
May’18
Feb’18
Apr’18
Jul’20
Jun’18
-18%
Jul’18
22%
Jan’19
Sep’18
Jun’19
Nov’18
Feb’19
13%
Mar’19
Apr’19
May’19
Feb’20
20%
Jan’20
Jul’19
Aug’19
Sep’19
Oct’19
Nov’19
-1%
Dec’19
48%
Apr’20
May’20
Jun’20
SC
TOTAL
Distribution Index dynamic
Purchase index have recovered after drop in April. Distribution of Eziclen
Distribution Index dynamic Purchase index have recovered after drop in April. Distribution of Eziclen
Ipsen Brand
Market Share %
YTD’
Jul
MQ’
Jul
MQ*’Jul
vs LY
CHC Performance July’20 Sell In.
Diarrhea segment
Ipsen Brand
Market Share %
YTD’
Jul
MQ’
Jul
MQ*’Jul
vs LY
CHC Performance July’20 Sell In. Diarrhea segment
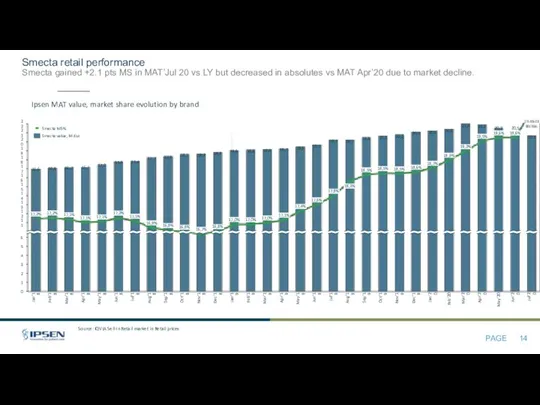
Smecta retail performance
Smecta gained +2.1 pts MS in MAT’Jul 20 vs LY but
Smecta retail performance Smecta gained +2.1 pts MS in MAT’Jul 20 vs LY but
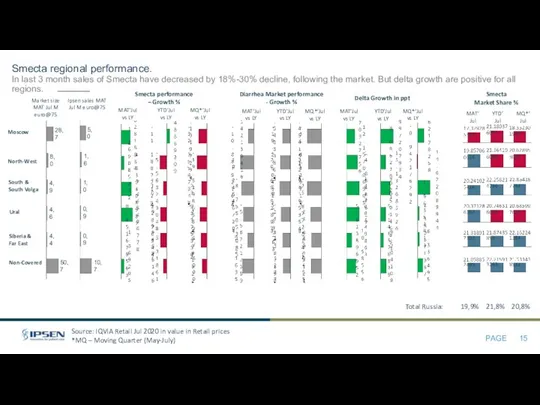
Smecta regional performance.
In last 3 month sales of Smecta have decreased by 18%-30%
Smecta regional performance. In last 3 month sales of Smecta have decreased by 18%-30%
Source: IQVIA Shipments Database, value
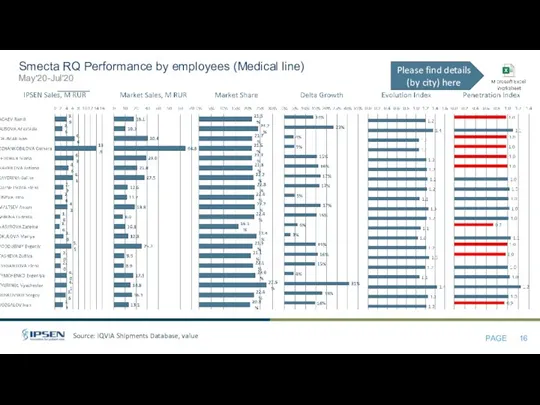
Smecta RQ Performance by employees (Medical line)
May'20-Jul'20
Please find details
Source: IQVIA Shipments Database, value
Smecta RQ Performance by employees (Medical line)
May'20-Jul'20
Please find details
Source: IQVIA Shipments Database, value
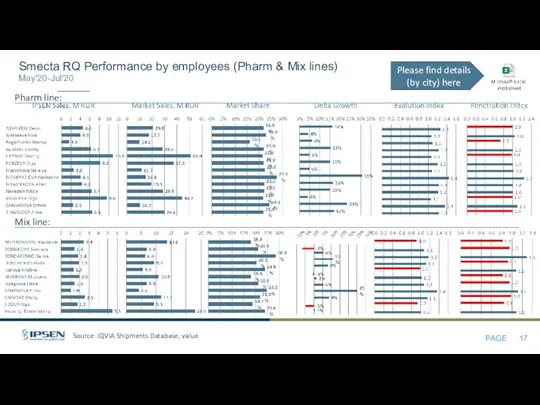
Smecta RQ Performance by employees (Pharm & Mix lines)
May'20-Jul'20
Mix
Source: IQVIA Shipments Database, value
Smecta RQ Performance by employees (Pharm & Mix lines)
May'20-Jul'20
Mix
Fortrans and Eziclen performance
Fortrans Market has declining trend for value share with
Fortrans and Eziclen performance Fortrans Market has declining trend for value share with
Fortrans and Eziclen regional performance.
Delta growth in 2020 is negative for all CHC
Fortrans and Eziclen regional performance. Delta growth in 2020 is negative for all CHC
Source: IQVIA Shipments Database, value
Fortrans and Eziclen RQ Performance by employees (Medical line)
May'20-Jul'20
Please
Source: IQVIA Shipments Database, value
Fortrans and Eziclen RQ Performance by employees (Medical line)
May'20-Jul'20
Please
Source: IQVIA Shipments Database, value
Fortrans and Eziclen YTD Performance by employees (Pharm &
Source: IQVIA Shipments Database, value
Fortrans and Eziclen YTD Performance by employees (Pharm &
Tanakan performance
There is +0.5 ppt of market share gain for Tanakan in MAT
Tanakan performance There is +0.5 ppt of market share gain for Tanakan in MAT
Tanakan Regional Performance
We have biggest MS of Tanakan in Moscow and Siberia &
Tanakan Regional Performance We have biggest MS of Tanakan in Moscow and Siberia &
Source: IQVIA Shipments Database, value
Tanakan RQ Performance by employees (Medical line)
May'20-Jul'20
Please find details
Source: IQVIA Shipments Database, value
Tanakan RQ Performance by employees (Medical line)
May'20-Jul'20
Please find details
Source: IQVIA Shipments Database, value
Tanakan RQ Performance by employees (Pharm & Mix lines)
May'20-Jul'20
Mix
Source: IQVIA Shipments Database, value
Tanakan RQ Performance by employees (Pharm & Mix lines)
May'20-Jul'20
Mix
Forlax Retail performance
Forlax is showing double-digit growth on slightly growing market thanks to
Forlax Retail performance Forlax is showing double-digit growth on slightly growing market thanks to
Forlax Regional Performance
Forlax is growing much faster than market and showing the double-digit
Forlax Regional Performance Forlax is growing much faster than market and showing the double-digit
Source: IQVIA Shipments Database, value
Forlax RQ Performance by employees (Medical line)
May'20-Jul'20
Please find details
Source: IQVIA Shipments Database, value
Forlax RQ Performance by employees (Medical line)
May'20-Jul'20
Please find details
Source: IQVIA Shipments Database, value
Forlax Rolling RQ by employees (Pharm & Mix lines)
May'20-Jul'20
Mix
Source: IQVIA Shipments Database, value
Forlax Rolling RQ by employees (Pharm & Mix lines)
May'20-Jul'20
Mix
SC Performance Jul’20
All brands are demonstrating growth above the market in YTD vs
SC Performance Jul’20 All brands are demonstrating growth above the market in YTD vs
Dysport Neuro performance
July’20 MAT sales decreased vs June’20 MAT sales by 100 k
Dysport Neuro performance July’20 MAT sales decreased vs June’20 MAT sales by 100 k
MQ*’Jul'20
vs LY
Ipsen Brand performance
– Growth %
Market performance
- Growth %
Delta Growth
MQ*’Jul'20
vs LY
Ipsen Brand performance
– Growth %
Market performance
- Growth %
Delta Growth
Dysport market performance
Other players are growing much faster and gaining market share from
Dysport market performance Other players are growing much faster and gaining market share from
Source: IQVIA Shipments Database, value
Dysport Rolling Half-Year Performance by employees
Feb’20 – Jul'20
Please find
Source: IQVIA Shipments Database, value
Dysport Rolling Half-Year Performance by employees
Feb’20 – Jul'20
Please find
Somatuline performance
Somatuline is growing in value and increasing it’s market share since MAT
Somatuline performance Somatuline is growing in value and increasing it’s market share since MAT
MQ*’Jul'20
vs LY
Ipsen Brand performance
– Growth %
Market performance
- Growth %
Delta Growth
MQ*’Jul'20
vs LY
Ipsen Brand performance
– Growth %
Market performance
- Growth %
Delta Growth
Somatuline market performance
Somatuline is growing much faster than market in volume (+54%) and
Somatuline market performance Somatuline is growing much faster than market in volume (+54%) and
Source: IQVIA Shipments Database, value
Somatuline Rolling Half-Year Performance by employees
Feb’20 – Jul'20
Please find
Source: IQVIA Shipments Database, value
Somatuline Rolling Half-Year Performance by employees
Feb’20 – Jul'20
Please find
Diphereline performance
In MAT Jul’20 Diphereline sales same as MAT Jun’20 and +4,9 ppt
Diphereline performance In MAT Jul’20 Diphereline sales same as MAT Jun’20 and +4,9 ppt
MQ*’Jul'20
vs LY
Ipsen Brand performance
– Growth %
Market performance
- Growth %
Delta Growth
MQ*’Jul'20
vs LY
Ipsen Brand performance
– Growth %
Market performance
- Growth %
Delta Growth
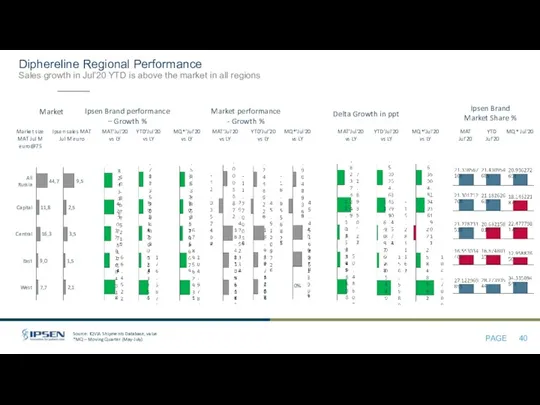
Diphereline market performance
Diphereline is growing faster than market: in value by +50% and
Diphereline market performance Diphereline is growing faster than market: in value by +50% and
Source: IQVIA Shipments Database, value
Diphereline Rolling Half-Year Performance by employees
Feb’20 – Jul'20
Please find
Source: IQVIA Shipments Database, value
Diphereline Rolling Half-Year Performance by employees
Feb’20 – Jul'20
Please find
Cabometyx performance
In MAT Jul’20 Cabometyx is continuing to ramp-up and reached 2,5% Market
Cabometyx performance In MAT Jul’20 Cabometyx is continuing to ramp-up and reached 2,5% Market
19,6
(12,8%)
6,2
10,1
41,6
(32,2%)
30,4
(23,6%)
10,4
8,6
18,6
(14,4%)
5,8
3,7
3,7
0,0
(0,0%)
MAT Jul’19
38,4
(25,2%)
3,8
(2,5%)
22,4
(14,7%)
21,0
13,9
11,4
7,2
4,6
MAT Jul’20
129,0
152,5
+18%
RCC market, M.Eur MAT
East
Central
Capital
All Russia
West
Cabometyx market share by region, YTD Jul’20
Source:
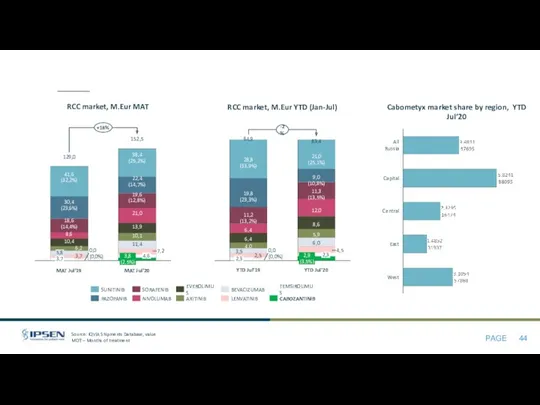
Cabometyx RCC market performance
RCC market is growing by 18% in value mainly due
Cabometyx RCC market performance RCC market is growing by 18% in value mainly due
Cabometyx TKIs 2nd line market performance
The TKIs 2nd line market is growing by
Cabometyx TKIs 2nd line market performance The TKIs 2nd line market is growing by
24,5
1,0
25,0
23,0
19,5
24,0
20,5
0,5
20,0
0,0
1,5
3,0
3,5
23,5
21,5
4,0
2,0
22,0
21,0
18,5
2,5
22,5
19,0
0,5
17,5
2,6
0,8
17,9
2,3
9,1%
23,1
21,3
Oct’19
Sep’18
May’18
22,7
20,8
0,6
2,0
1,5
Jan’17
9,5%
21,0
Feb’17
0,8
2,6
17,6
17,5
17,5
1,8
Mar’17
19,2
Apr’17
2,0
2,6
2,6
May’17
17,9
2,1
1,7
Jun’17
18,2
0,6
2,2
Jul’17
-7,6%
18,7
18,3
19,3
Aug’17
2,4
Sep’17
1,3
18,6
0,2
2,4
Oct’17
18,8
2,4
Nov’17
Feb’20
18,4
2,4
Dec’17
18,5
2,4
Jan’18
21,8
18,6
9,7%
May’19
2,4
Feb’18
Aug’20
18,7
2,5
Mar’18
19,2
0,4
Apr’18
9,1%
24,8
2,6
19,4
13,4%
2,6
Jun’18
8,3%
22,5
19,5
1,7
2,6
Jul’18
6,8%
22,0
19,2
19,4
0,4
2,6
0,4
Aug’18
19,2
2,5
19,4
1,0
2,6
0,0
Oct’18
1,8%
19,0
1,8
0,1
Nov’18
21,0
21,8
19,9
2,6
1,5
0,1
Dec’18
19,9
20,2
Jan’19
9,1%
Mar’19
20,1
9,5%
0,3
Feb’19
2,5
20,8
2,3
Apr’19
20,9
2,2
21,8
21,1
21,0
22,1
2,0
0,9
Jun’19
2,0
1,0
0,3
Jul’19
21,5
1,9
1,2
Aug’19
14,3%
22,1
21,8
1,7
Sep’19
22,0
21,8
1,4
1,8
Nov’19
9,0%
1,1
1,7
Dec’19
8,9%
21,9
1,1
Jan’20
8,0%
1,8
5,3%
1,9
24,7
Mar’20
-5,0%
Apr’20
19,9
1,7
21,2
May’20
21,0
20,5
1,7
Jun’20
1,8
Jul’20
19,3
19,6
20,0
20,1
20,4
20,6
20,9
1,6
21,1
22,0
22,1
21,7
22,0
21,6
22,6
22,7
22,9
23,5
23,7
23,9
24,0
24,3
24,5
24,8
24,9
24,8
24,7
24,8
-6,6%
22,9
1,8
20,6
22,0
3,2%
4,7%
8,4%
8,2%
11,2%
8,9%
11,5%
-5,7%
-4,7%
21,0
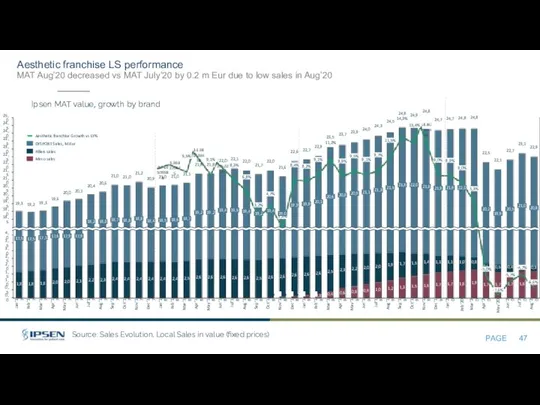
Aesthetic franchise LS performance
MAT Aug’20 decreased vs MAT July’20 by 0.2 m Eur
24,5
1,0
25,0
23,0
19,5
24,0
20,5
0,5
20,0
0,0
1,5
3,0
3,5
23,5
21,5
4,0
2,0
22,0
21,0
18,5
2,5
22,5
19,0
0,5
17,5
2,6
0,8
17,9
2,3
9,1%
23,1
21,3
Oct’19
Sep’18
May’18
22,7
20,8
0,6
2,0
1,5
Jan’17
9,5%
21,0
Feb’17
0,8
2,6
17,6
17,5
17,5
1,8
Mar’17
19,2
Apr’17
2,0
2,6
2,6
May’17
17,9
2,1
1,7
Jun’17
18,2
0,6
2,2
Jul’17
-7,6%
18,7
18,3
19,3
Aug’17
2,4
Sep’17
1,3
18,6
0,2
2,4
Oct’17
18,8
2,4
Nov’17
Feb’20
18,4
2,4
Dec’17
18,5
2,4
Jan’18
21,8
18,6
9,7%
May’19
2,4
Feb’18
Aug’20
18,7
2,5
Mar’18
19,2
0,4
Apr’18
9,1%
24,8
2,6
19,4
13,4%
2,6
Jun’18
8,3%
22,5
19,5
1,7
2,6
Jul’18
6,8%
22,0
19,2
19,4
0,4
2,6
0,4
Aug’18
19,2
2,5
19,4
1,0
2,6
0,0
Oct’18
1,8%
19,0
1,8
0,1
Nov’18
21,0
21,8
19,9
2,6
1,5
0,1
Dec’18
19,9
20,2
Jan’19
9,1%
Mar’19
20,1
9,5%
0,3
Feb’19
2,5
20,8
2,3
Apr’19
20,9
2,2
21,8
21,1
21,0
22,1
2,0
0,9
Jun’19
2,0
1,0
0,3
Jul’19
21,5
1,9
1,2
Aug’19
14,3%
22,1
21,8
1,7
Sep’19
22,0
21,8
1,4
1,8
Nov’19
9,0%
1,1
1,7
Dec’19
8,9%
21,9
1,1
Jan’20
8,0%
1,8
5,3%
1,9
24,7
Mar’20
-5,0%
Apr’20
19,9
1,7
21,2
May’20
21,0
20,5
1,7
Jun’20
1,8
Jul’20
19,3
19,6
20,0
20,1
20,4
20,6
20,9
1,6
21,1
22,0
22,1
21,7
22,0
21,6
22,6
22,7
22,9
23,5
23,7
23,9
24,0
24,3
24,5
24,8
24,9
24,8
24,7
24,8
-6,6%
22,9
1,8
20,6
22,0
3,2%
4,7%
8,4%
8,2%
11,2%
8,9%
11,5%
-5,7%
-4,7%
21,0
Aesthetic franchise LS performance MAT Aug’20 decreased vs MAT July’20 by 0.2 m Eur
2,2
0,8
3,0
0,2
1,2
0,0
3,2
0,6
0,4
1,0
2,4
1,4
2,8
2,6
1,6
1,8
2,0
2,9
1,4
2,5
2,1
Dec’18
0,1
9,0%
1,3
-12,8%
1,6
0,2
Feb’18
0,1
2,0
Jun’18
1,6
0,1
1,7
0,8
Jan’18
Sep’18
1,2
0,1
0,3
1,7
Mar’18
2,4
Oct’18
0,2
0,4
Jan’19
Apr’18
2,0
May’18
0,2
0,1
Jul’18
0,3
Nov’18
Dec’19
1,2
10,0%
Aug’18
0,0
0,2
0,2
0,2
0,3
0,0
0,1
0,0
18,0%
1,4
0,1
0,1
Feb’19
2,2
Nov’19
Sep’19
0,2
Mar’19
2,6
0,2
Apr’19
0,1
0,1
May’19
1,9
0,1
0,1
Jun’19
1,5
0,1
0,1
Jul’19
1,6
2,5
1,4
0,2
0,1
0,1
Aug’19
1,6
0,1
1,3
5,0%
1,8
0,1
0,2
Oct’19
0,0
-8,0%
1,9
0,0
0,2
1,3
-4,0%
0,1
0,2
1,0
0,0
0,1
Jan’20
1,4
0,0
0,1
Feb’20
2,8
2,3
0,2
Jun’20
Mar’20
-75,0%
0,7
0,2
0,9
0,0
0,0
Apr’20
-20,0%
1,7
0,0
0,1
May’20
2,6
0,0
0,9
1,9
0,0
0,2
Jul’20
2,0
2,9
2,2
2,0
1,4
1,4
1,0
1,9
2,3
2,6
3,0
2,3
2,1
1,6
1,6
1,8
2,0
2,1
2,8
1,1
2,6
0,8
1,9
2,1
Aug’20
0,0
0,1
1,3
1,5
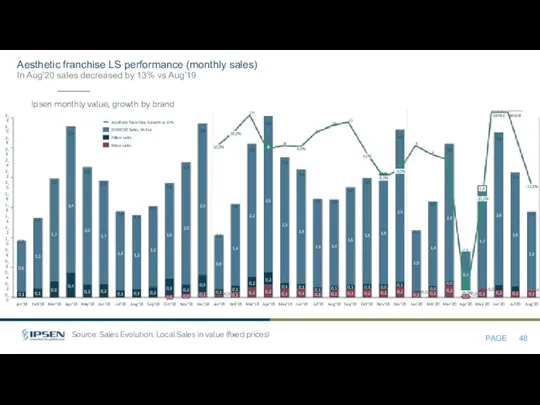
Aesthetic franchise LS performance (monthly sales)
In Aug’20 sales decreased by 13% vs Aug’19
Ipsen
2,2
0,8
3,0
0,2
1,2
0,0
3,2
0,6
0,4
1,0
2,4
1,4
2,8
2,6
1,6
1,8
2,0
2,9
1,4
2,5
2,1
Dec’18
0,1
9,0%
1,3
-12,8%
1,6
0,2
Feb’18
0,1
2,0
Jun’18
1,6
0,1
1,7
0,8
Jan’18
Sep’18
1,2
0,1
0,3
1,7
Mar’18
2,4
Oct’18
0,2
0,4
Jan’19
Apr’18
2,0
May’18
0,2
0,1
Jul’18
0,3
Nov’18
Dec’19
1,2
10,0%
Aug’18
0,0
0,2
0,2
0,2
0,3
0,0
0,1
0,0
18,0%
1,4
0,1
0,1
Feb’19
2,2
Nov’19
Sep’19
0,2
Mar’19
2,6
0,2
Apr’19
0,1
0,1
May’19
1,9
0,1
0,1
Jun’19
1,5
0,1
0,1
Jul’19
1,6
2,5
1,4
0,2
0,1
0,1
Aug’19
1,6
0,1
1,3
5,0%
1,8
0,1
0,2
Oct’19
0,0
-8,0%
1,9
0,0
0,2
1,3
-4,0%
0,1
0,2
1,0
0,0
0,1
Jan’20
1,4
0,0
0,1
Feb’20
2,8
2,3
0,2
Jun’20
Mar’20
-75,0%
0,7
0,2
0,9
0,0
0,0
Apr’20
-20,0%
1,7
0,0
0,1
May’20
2,6
0,0
0,9
1,9
0,0
0,2
Jul’20
2,0
2,9
2,2
2,0
1,4
1,4
1,0
1,9
2,3
2,6
3,0
2,3
2,1
1,6
1,6
1,8
2,0
2,1
2,8
1,1
2,6
0,8
1,9
2,1
Aug’20
0,0
0,1
1,3
1,5
Aesthetic franchise LS performance (monthly sales)
In Aug’20 sales decreased by 13% vs Aug’19
Ipsen
CIS Countries
CIS Countries
Source: IQVIA
Source: IQVIA
Source: IQVIA
Source: IQVIA
Source: IQVIA
Source: IQVIA
Appendix
Appendix

Key terminology used in the presentation
Key terminology used in the presentation
 Бизнес-план инвестиционного проекта
 Деятельность индивидуальных предпринимателей в Беларуси
 Как работает бизнес?
 Бизнес-план. Ритуальное агентство Лакримоза
 Шиномонтаж Aura. Бизнес - план
 Организация процесса разработки бизнес-плана. Шаблон бизнес модели
 Бизнес-идея фреш-бара Аскерöм юан
 Бизнес-планирование в социокультурной сфере
 Новая стартовая программа. Модель бизнеса для тебя!
 Частный детский сад Росточек
 Цветочный магазин. Бизнес-план
 Проектирование от А до Я. Как создать свой социальный бизнес или творческий проект и получить поддержку
 Бизнес-план судоходной компании Cutty Ore Star Llc
 Основные этапы бизнес -планирования предприятия
 Создание индивидуальных бюджетных протезов для людей, лишившихся конечности рук
 Бизнес-модель гостиницы
 Товарищество с ограниченной ответственностью
 Business project: Art School in the District Nagatino-Sadovniki, Moscow
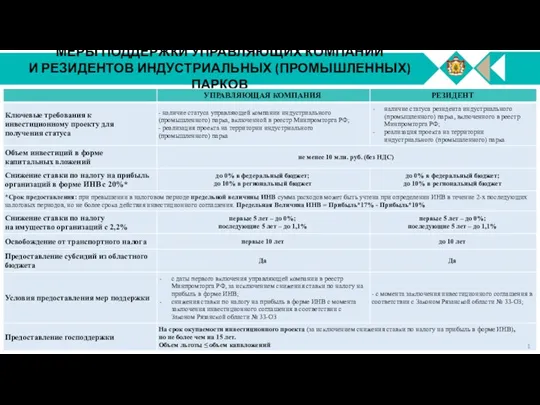 Меры поддержки управляющих компаний и резидентов индустриальных (промышленных) парков управляющая компания
 Планирование каталожного периода. Практические рекомендации
 Телепроект Білімді ұрпақ – Бақытты отбасы
 Речевой этикет в деловом общении
 Моя бизнес-идея Автомастерская в центре города
 Региональный сетевой акселератор
 Бизнес-план по теме Мобильная кофейня
 Рыбное хозяйство ИП Зварич И.И
 Пансионаты в Евпатории
 ООО Black House • Специфика – тату салон