Слайд 2
Definition
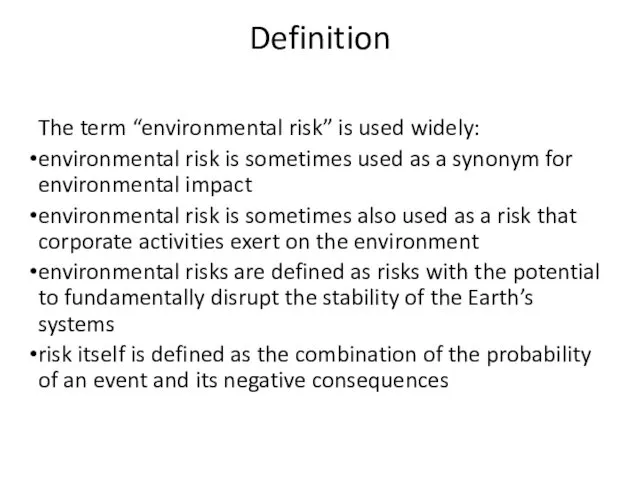
The term “environmental risk” is used widely:
environmental risk is sometimes used
as a synonym for environmental impact
environmental risk is sometimes also used as a risk that corporate activities exert on the environment
environmental risks are defined as risks with the potential to fundamentally disrupt the stability of the Earth’s systems
risk itself is defined as the combination of the probability of an event and its negative consequences
Слайд 3
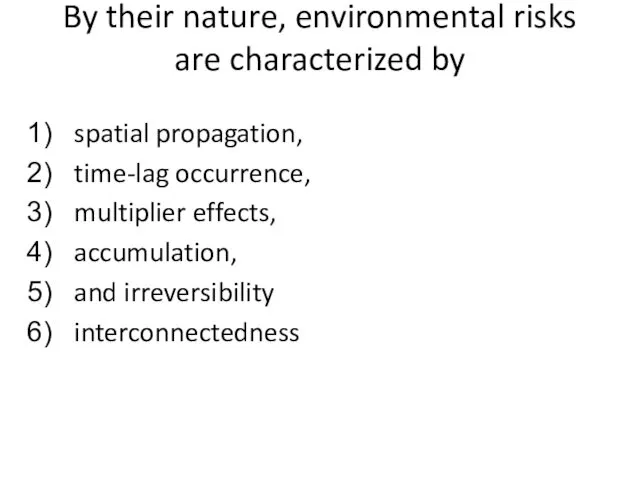
By their nature, environmental risks are characterized by
spatial propagation,
time-lag
occurrence,
multiplier effects,
accumulation,
and irreversibility
interconnectedness
Слайд 4

Слайд 5
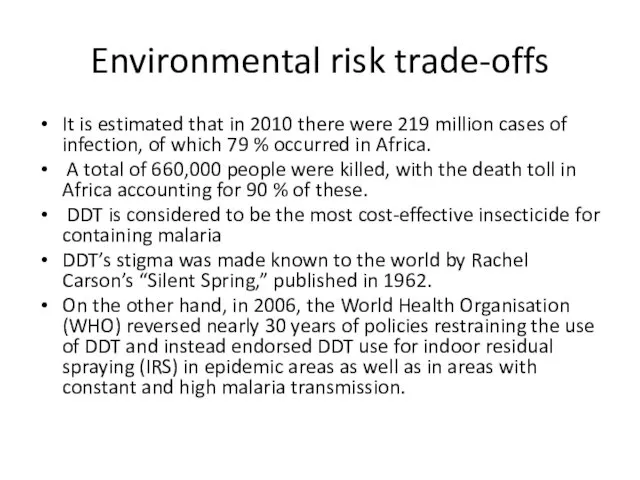
Environmental risk trade-offs
It is estimated that in 2010 there were
219 million cases of infection, of which 79 % occurred in Africa.
A total of 660,000 people were killed, with the death toll in Africa accounting for 90 % of these.
DDT is considered to be the most cost-effective insecticide for containing malaria
DDT’s stigma was made known to the world by Rachel Carson’s “Silent Spring,” published in 1962.
On the other hand, in 2006, the World Health Organisation (WHO) reversed nearly 30 years of policies restraining the use of DDT and instead endorsed DDT use for indoor residual spraying (IRS) in epidemic areas as well as in areas with constant and high malaria transmission.
Слайд 6
Слайд 7
Risk analysis
Risk analysis allows us to estimate impacts on the environment
and on human health when we have not measured or cannot measure or directly observe those impacts. It also lets us compare these impacts. In this chapter, we introduce the concept of risk analysis and risk management. The former is the measurement and comparison of various forms of risk; the latter involves the techniques used to reduce these risks.
Слайд 8
In general, a risk factor should meet the following conditions:
Exposure
to the risk factor precedes appearance of the adverse effect.
The risk factor and the adverse effect are consistently associated. That is, the adverse effect is not usually observed in the absence of the risk factor.
The more of the risk factor there is, or the greater its intensity, the greater the adverse effect, although the functional relationship need not be linear or monotonic.
The occurrence or magnitude of the adverse effect is statistically significantly greater in the presence of the risk factor than in its absence.
Слайд 9
Risk assessment is a system of analysis that includes four tasks:
1.
Identification of a substance (a toxicant) that may have adverse health effects
2. Scenarios for exposure to the toxicant
3. Characterization of health effects
4. An estimate of the probability (risk) of occurrence of these health effects
Слайд 10
Toxicants are usually identified when an associated adverse health effect is
noticed.
In most cases, the first intimation that a substance is toxic is its association with an unusual number of deaths.
Mortality risk, or risk of death, is easier to determine for populations, especially in the developed countries, than morbidity risk (risk of illness) because all deaths and their apparent causes are reported on death certificates, while recording of disease incidence, which began in the relatively recent past, is done only for a very few diseases. Death certificate data may be misleading: An individual who suffers from high blood pressure but is killed in an automobile accident becomes an accident statistic rather than a cardiovascular disease statistic. In addition, occupational mortality risks are well documented only for men; until the present generation, too few women worked outside the home all their lives to form a good statistical base.
Слайд 11
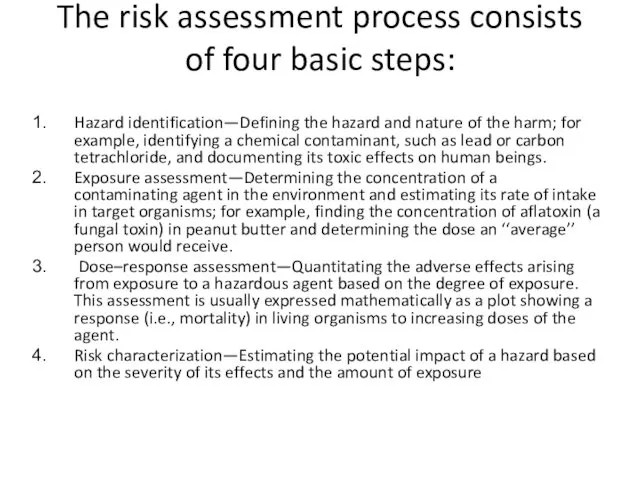
The risk assessment process consists of four basic steps:
Hazard identification—Defining the
hazard and nature of the harm; for example, identifying a chemical contaminant, such as lead or carbon tetrachloride, and documenting its toxic effects on human beings.
Exposure assessment—Determining the concentration of a contaminating agent in the environment and estimating its rate of intake in target organisms; for example, finding the concentration of aflatoxin (a fungal toxin) in peanut butter and determining the dose an ‘‘average’’ person would receive.
Dose–response assessment—Quantitating the adverse effects arising from exposure to a hazardous agent based on the degree of exposure. This assessment is usually expressed mathematically as a plot showing a response (i.e., mortality) in living organisms to increasing doses of the agent.
Risk characterization—Estimating the potential impact of a hazard based on the severity of its effects and the amount of exposure
Слайд 12
Слайд 13
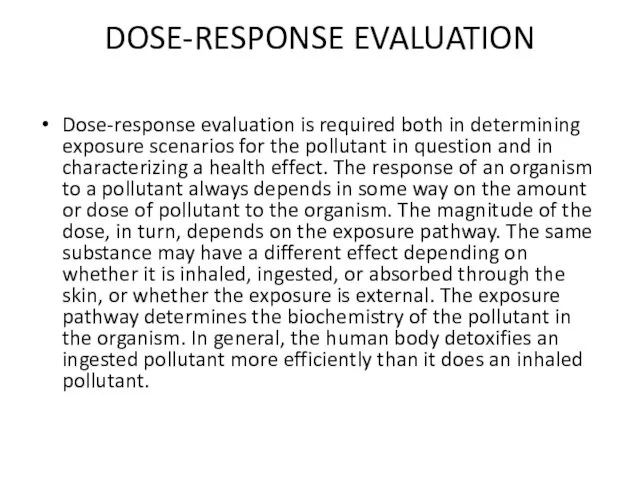
DOSE-RESPONSE EVALUATION
Dose-response evaluation is required both in determining exposure scenarios for
the pollutant in question and in characterizing a health effect. The response of an organism to a pollutant always depends in some way on the amount or dose of pollutant to the organism. The magnitude of the dose, in turn, depends on the exposure pathway. The same substance may have a different effect depending on whether it is inhaled, ingested, or absorbed through the skin, or whether the exposure is external. The exposure pathway determines the biochemistry of the pollutant in the organism. In general, the human body detoxifies an ingested pollutant more efficiently than it does an inhaled pollutant.
Слайд 14
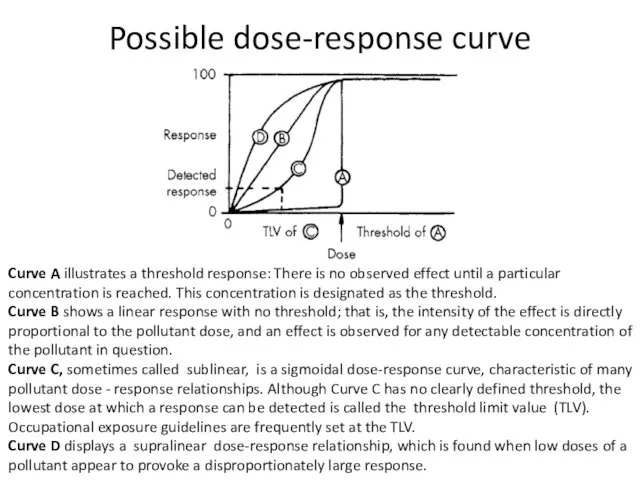
Possible dose-response curve
Curve A illustrates a threshold response: There is no
observed effect until a particular concentration is reached. This concentration is designated as the threshold.
Curve B shows a linear response with no threshold; that is, the intensity of the effect is directly proportional to the pollutant dose, and an effect is observed for any detectable concentration of the pollutant in question.
Curve C, sometimes called sublinear, is a sigmoidal dose-response curve, characteristic of many pollutant dose - response relationships. Although Curve C has no clearly defined threshold, the lowest dose at which a response can be detected is called the threshold limit value (TLV). Occupational exposure guidelines are frequently set at the TLV.
Curve D displays a supralinear dose-response relationship, which is found when low doses of a pollutant appear to provoke a disproportionately large response.
Слайд 15
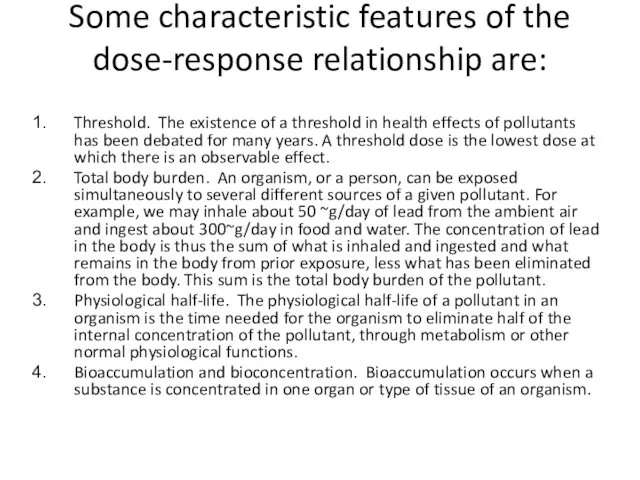
Some characteristic features of the dose-response relationship are:
Threshold. The existence of
a threshold in health effects of pollutants has been debated for many years. A threshold dose is the lowest dose at which there is an observable effect.
Total body burden. An organism, or a person, can be exposed simultaneously to several different sources of a given pollutant. For example, we may inhale about 50 ~g/day of lead from the ambient air and ingest about 300~g/day in food and water. The concentration of lead in the body is thus the sum of what is inhaled and ingested and what remains in the body from prior exposure, less what has been eliminated from the body. This sum is the total body burden of the pollutant.
Physiological half-life. The physiological half-life of a pollutant in an organism is the time needed for the organism to eliminate half of the internal concentration of the pollutant, through metabolism or other normal physiological functions.
Bioaccumulation and bioconcentration. Bioaccumulation occurs when a substance is concentrated in one organ or type of tissue of an organism.
Слайд 16
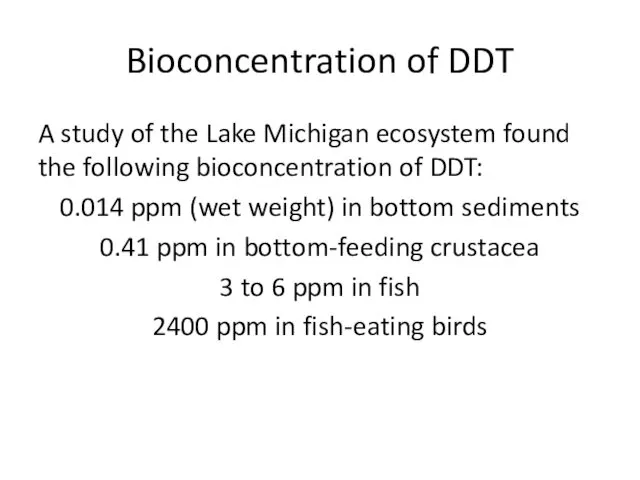
Bioconcentration of DDT
A study of the Lake Michigan ecosystem found the
following bioconcentration of DDT:
0.014 ppm (wet weight) in bottom sediments
0.41 ppm in bottom-feeding crustacea
3 to 6 ppm in fish
2400 ppm in fish-eating birds
Слайд 17
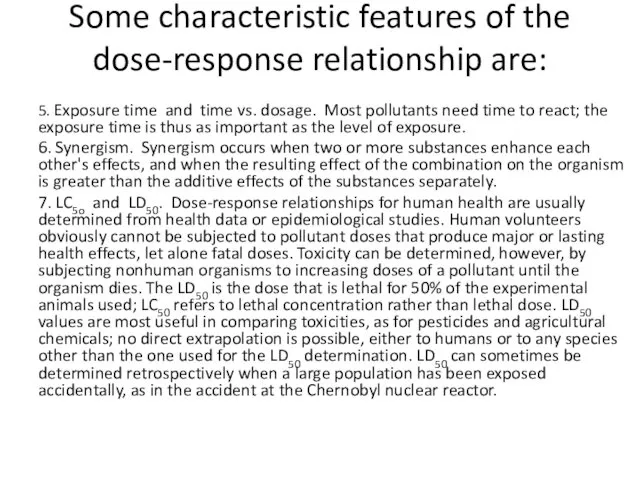
Some characteristic features of the dose-response relationship are:
5. Exposure time and
time vs. dosage. Most pollutants need time to react; the exposure time is thus as important as the level of exposure.
6. Synergism. Synergism occurs when two or more substances enhance each other's effects, and when the resulting effect of the combination on the organism is greater than the additive effects of the substances separately.
7. LC5o and LD50. Dose-response relationships for human health are usually determined from health data or epidemiological studies. Human volunteers obviously cannot be subjected to pollutant doses that produce major or lasting health effects, let alone fatal doses. Toxicity can be determined, however, by subjecting nonhuman organisms to increasing doses of a pollutant until the organism dies. The LD50 is the dose that is lethal for 50% of the experimental animals used; LC50 refers to lethal concentration rather than lethal dose. LD50 values are most useful in comparing toxicities, as for pesticides and agricultural chemicals; no direct extrapolation is possible, either to humans or to any species other than the one used for the LD50 determination. LD50 can sometimes be determined retrospectively when a large population has been exposed accidentally, as in the accident at the Chernobyl nuclear reactor.
Слайд 18
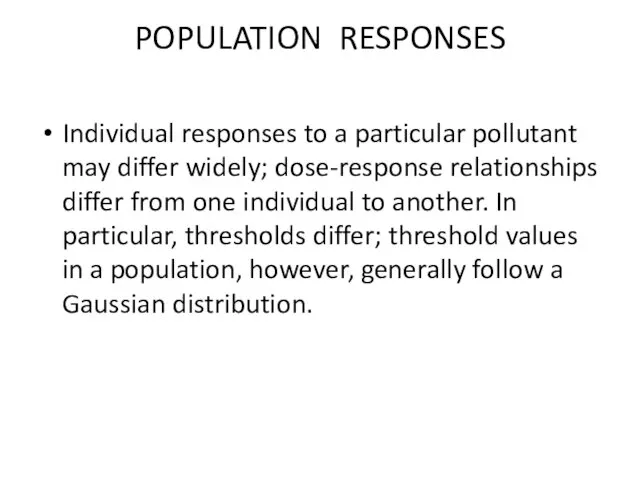
POPULATION RESPONSES
Individual responses to a particular pollutant may differ widely; dose-response
relationships differ from one individual to another. In particular, thresholds differ; threshold values in a population, however, generally follow a Gaussian distribution.
Слайд 19
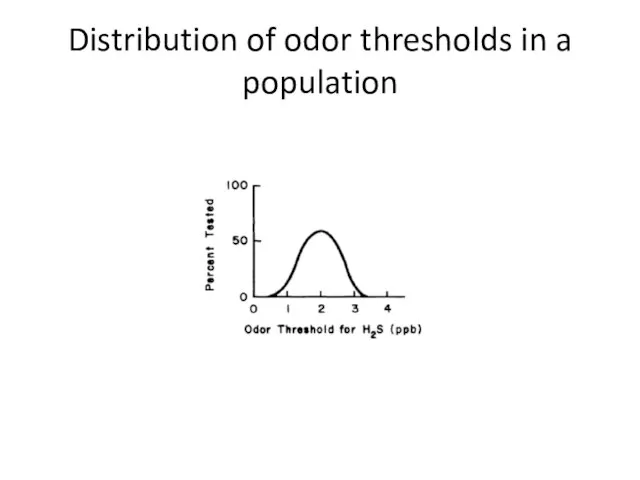
Distribution of odor thresholds in a population
Слайд 20
Individual responses and thresholds also depend on age, sex, and general
state of physical and emotional health.
there is no release level for which protection can be ensured for everyone, so a comparative risk analysis is necessary. Carcinogens are all considered to be in this category of nonthreshold pollutants.
Слайд 21

EXPOSURE AND LATENCY
Characterization of some health risks can take a very
long time
There is a growing tendency to regulate any substance for which there is any evidence, even inconclusive, of adverse health effects.
The cost of such control has recently been determined to be far greater than the cost of treating or mitigating the effect. 3 For example, vinyl chloride emission control is estimated to cost 1.6 million dollars per year of life saved, while leukemia treatment by bone marrow transplant costs $12,000 per year of life saved.
Слайд 22
EXPRESSION OF RISK
Risk is defined as the product of probability and
consequence, and is expressed as the probability or frequency of occurrence of an undesirable event. It is important to note that both probability and consequence must play a role in risk assessment. Arguments over pollution control often concentrate on consequence alone; members of the public fear a consequence (like the Bhopal isocyanate release) irrespective of its remote likelihood or low frequency of occurrence. However, pollution control decisions, like other risk-based decisions, cannot be made on the basis of consequence alone
Слайд 23
EXPRESSION OF RISK
An expression of risk incorporates both the probability and
some measure of consequence. In discussing human health or environmental risk, the consequences are adverse health effects or adverse effects on some species of plant or animal. Challenges to the linear nonthreshold theory of carcinogenesis have been raised recently, particularly with respect to the effects of ionizing radiation.
Слайд 24
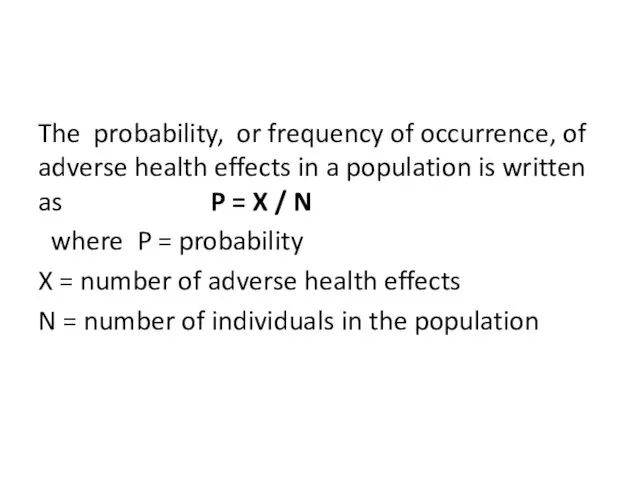
The probability, or frequency of occurrence, of adverse health effects in
a population is written as P = X / N
where P = probability
X = number of adverse health effects
N = number of individuals in the population
Слайд 25
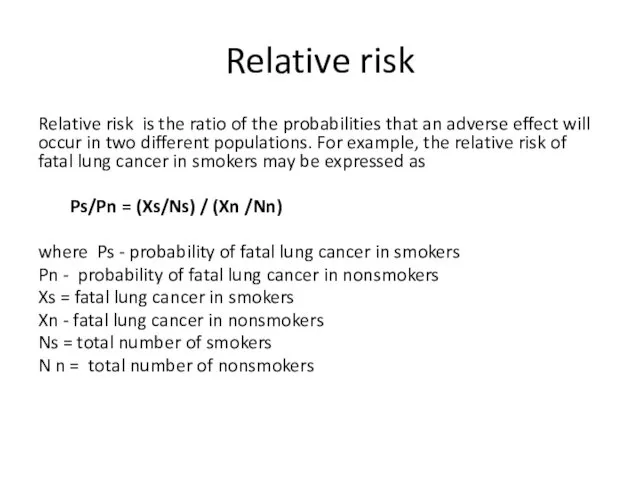
Relative risk
Relative risk is the ratio of the probabilities that an
adverse effect will occur in two different populations. For example, the relative risk of fatal lung cancer in smokers may be expressed as
Ps/Pn = (Xs/Ns) / (Xn /Nn)
where Ps - probability of fatal lung cancer in smokers
Pn - probability of fatal lung cancer in nonsmokers
Xs = fatal lung cancer in smokers
Xn - fatal lung cancer in nonsmokers
Ns = total number of smokers
N n = total number of nonsmokers
Слайд 26
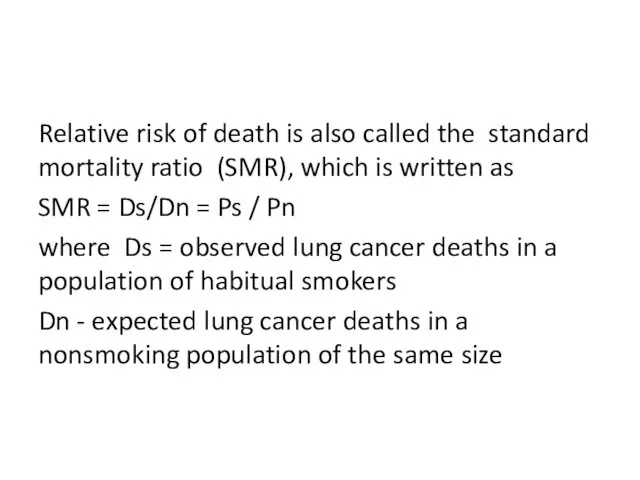
Relative risk of death is also called the standard mortality ratio
(SMR), which is written as
SMR = Ds/Dn = Ps / Pn
where Ds = observed lung cancer deaths in a population of habitual smokers
Dn - expected lung cancer deaths in a nonsmoking population of the same size
Слайд 27
In this particular instance, the SMR is approximately 11/1 and is
significantly greater than 1.
Three important characteristics of epidemiological reasoning are illustrated by this example:
• Everyone who smokes heavily will not die of lung cancer.
• Some nonsmokers die of lung cancer.
• Therefore, one cannot unequivocally relate any given individual lung cancer death to cigarette smoking.
Слайд 28
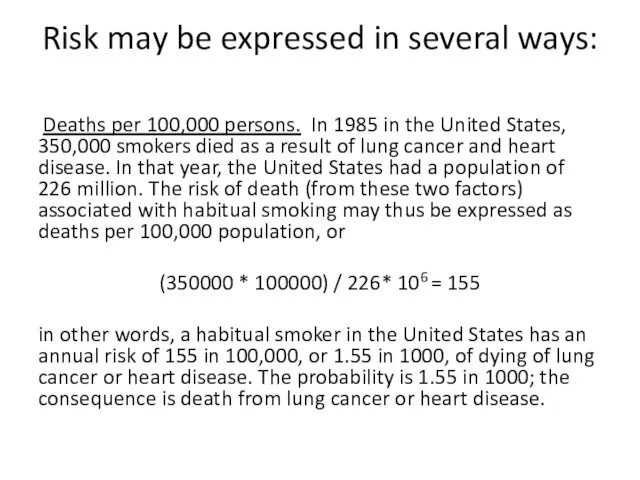
Risk may be expressed in several ways:
Deaths per 100,000 persons.
In 1985 in the United States, 350,000 smokers died as a result of lung cancer and heart disease. In that year, the United States had a population of 226 million. The risk of death (from these two factors) associated with habitual smoking may thus be expressed as deaths per 100,000 population, or
(350000 * 100000) / 226* 106 = 155
in other words, a habitual smoker in the United States has an annual risk of 155 in 100,000, or 1.55 in 1000, of dying of lung cancer or heart disease. The probability is 1.55 in 1000; the consequence is death from lung cancer or heart disease.
Слайд 29

Слайд 30
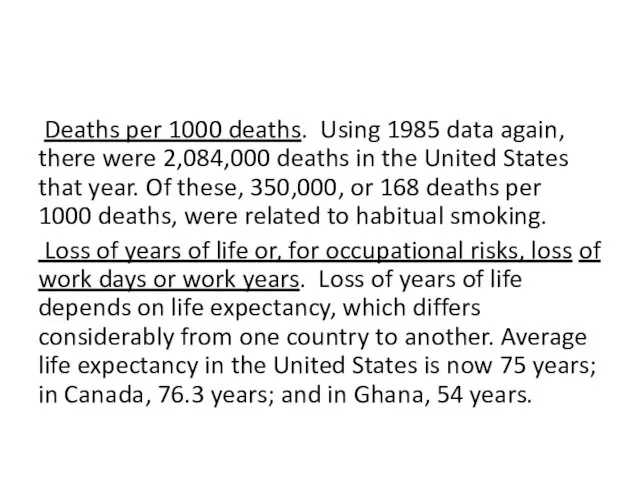
Deaths per 1000 deaths. Using 1985 data again, there were
2,084,000 deaths in the United States that year. Of these, 350,000, or 168 deaths per 1000 deaths, were related to habitual smoking.
Loss of years of life or, for occupational risks, loss of work days or work years. Loss of years of life depends on life expectancy, which differs considerably from one country to another. Average life expectancy in the United States is now 75 years; in Canada, 76.3 years; and in Ghana, 54 years.

 Перспективная система обращения с отходами в Удмуртии
 Право на благоприятную окружающую среду и способы его защиты
 Презентация к уроку Водный баланс наземных животных
 Описание жилища человека как искусственной экосистемы
 The Chernobyl Disaster
 Червона книга України
 Глобальные экологические проблемы. Парниковый эффект
 Водные ресурсы. Охрана вод
 Нарушение экологического равновесия
 Техногенна катастрофа у Чорнобилі, соціальний та екологічний вимір
 Что такое экология
 Вода на планете Земля
 Проект на створення екологічно стійкої системи Закладемо парк
 Микрофлора воды
 Эффективное использование ресурса ненужных вещей
 Республиканский проект ЭкоТимуровцы
 Экологическая игра, посвященная Дню защиты ЗЕМЛИ Свалка по имени ЗЕМЛЯ
 Формування екологічної компетентності учнів шляхом впровадження екологічної освіти у навчально-виховному процесі
 Люблю тебя, мой край родной...
 Нормирование загрязняющих веществ
 Твой экологический след
 Экологический календарь школьника
 Экологические факторы, условия и ресурсы среды
 Экологические знаки на упаковках товаров
 Забруднення навколишнього середовища в країнах Європи
 Валдайский национальный парк
 Африка. Животный и растительный мир
 Презентация к внеклассному мероприятию Краснокнижные птицы Югры