- Business statistics

Содержание
- 2. LITERATURE 1. Siegel, Andrew F. Practical Business Statistics. Sixth edition. Amsterdam: Academic Press. – 2015. -
- 3. 6.Сигел, Э. Практическая бизнес-статистика: Пер. с англ. / Э.Сигел. – М.: Издательский дом «Вильямс», 2002. -
- 4. Business Statistics What and Why
- 5. Welcome to the world of statistics. This is a world you will want to get comfortable
- 6. The early chapters will introduce you to the role of statistics and data mining in business
- 7. Is knowledge of statistics really necessary to be successful in business? Or is it enough to
- 8. Is statistics difficult? Statistics is no more difficult than any other field of study. Naturally, some
- 9. Although a few die-hard purists may bemoan the decline of technical detail in statistics teaching, it
- 10. Does learning statistics decrease your decision-making flexibility? Knowledge of decisions enhances your ability to make good
- 11. Think of statistical methods as a component of decision making, but not the whole story. You
- 12. Introduction into Business Statistics
- 13. СHAPTER QUESTIONS Definition of the term ‘statistics’. Statistical Methods Functions of Statistics Key Terms: Data, Population,
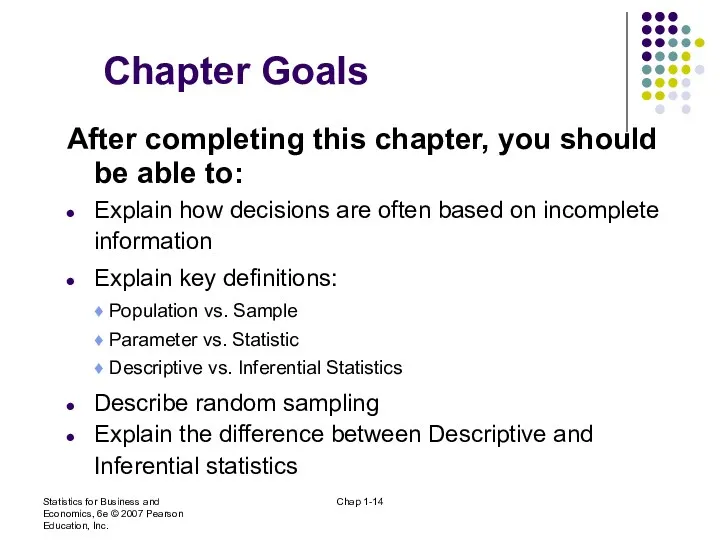
- 14. Statistics for Business and Economics, 6e © 2007 Pearson Education, Inc. Chap 1- Chapter Goals After
- 15. Introduction The word “statistics” is very popularly used in practice. It conveys a variety of meanings
- 16. Such statistics are quite commonly found in newspapers, journals, reports and one can hear them on
- 17. In addition to meaning numerical facts, “statistics” also refers to a subject, just as ‘mathematics’ as
- 18. What is statistics? Statistics is the art and science of collecting and understanding data. Since data
- 19. Definition There have been many definitions of the term ‘statistics’- indeed scholarly articles have carefully collected
- 20. Statistics Looks at the Big Picture When you have a large, complex assemblage of many small
- 21. Statistics in Management What should a manager know about statistics? Your knowledge should include a broad
- 22. To fulfill these roles, you do not need to be able to perform a complex statistical
- 23. The five basic activities of statistics In the beginning stages of a statistical study, either there
- 24. In the modeling phase, a system of assumptions and equations is selected in order to provide
- 26. Designing a Plan for Data Collection - might be called sample survey design for a marketing
- 27. Statistics is particularly useful when you have a large group of people, firms, or other items
- 28. The random sample is one of the best ways to select a practical sample, to be
- 29. 1. You are guaranteed that the selection process is fair and proceeds without bias; that is,
- 30. Exploring the Data As soon as you have a set of data, you will want to
- 31. 1. By verifying that the expected relationships actually exist in the data, thereby validating the planned
- 32. Exploration is the first phase once you have data to look at. It is often not
- 33. Modeling the Data In statistics, a model is a system of assumption and equations that can
- 34. Here are some models that can be useful in analyzing data. Notice that each model generates
- 35. 1. Consider a simple model that generates artificial data consisting of a single number plus noise.
- 36. Estimating an Unknown Quantity - produces the best educated guess possible based on the available data.
- 37. Estimating an Unknown Quantity Next period (quarter’s) sales. What the government will do next to our
- 38. Statistics can shed light on some of these situations by producing a good, educated guess when
- 39. Statistical estimation also provides an indication of the amount of uncertainty or error involved in the
- 40. Hypothesis testing Statistical hypothesis testing is the use of data in deciding between two (or more)
- 41. Here are some examples of hypothesis that might be tested using data: The average New Yorker
- 42. Note that each hypothesis makes a definite statement, and it may be either true or false.
- 44. What is “Statistics”? Statistics is the science of data that involves: Collecting Classifying Summarizing Organizing and
- 45. Statistical Methods The methods by which statistical data are analyzed are called statistical methods. Statistical methods
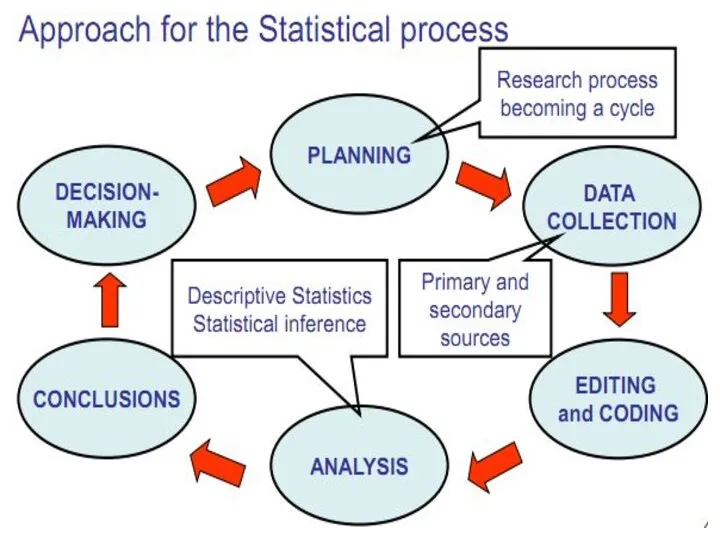
- 46. Statistical Methods There are five stages in a statistical investigation: 1.Collection: Utmost care must be exercised
- 47. 2. Organization: Data from published sources are generally in organized form. Data from survey needs organization.
- 48. 3.Presentation: After the data have been collected and organized, they are ready for presentation. It facilitates
- 49. 5.Interpretation: Drawing conclusions from the data collected and analyzed. It is a difficult task and necessitates
- 50. Statistics: Science or Art Whether statistics is a science or an art is often a subject
- 51. Art, on the other hand, refers to the skill of handling facts so as to achieve
- 52. Functions of Statistics Definiteness: To present general statements in a precise and definite form. The sex
- 53. Formulating and testing Hypothesis: Statistical methods are extremely useful in formulating and testing hypothesis and to
- 54. Statistics for Business and Economics, 6e © 2007 Pearson Education, Inc. Chap 1- Dealing with Uncertainty
- 55. Statistics for Business and Economics, 6e © 2007 Pearson Education, Inc. Chap 1- Dealing with Uncertainty
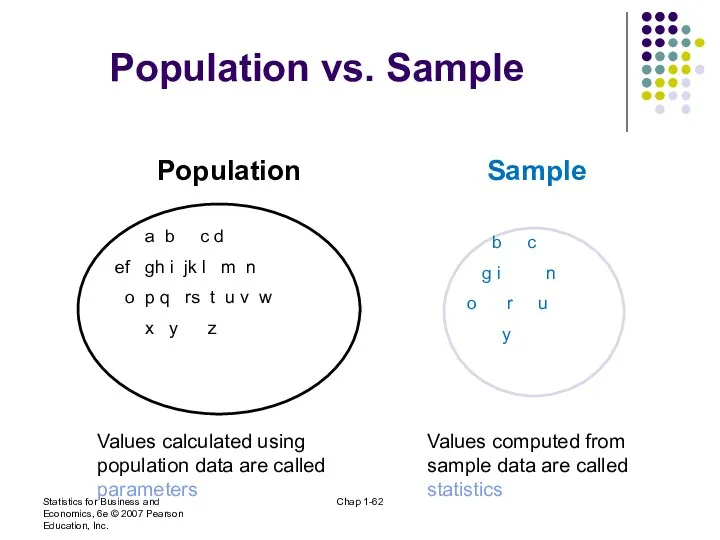
- 56. Basic concepts of Statistics – Parameter • Computed from the universe. – Statistic • Computed from
- 57. Basic concepts of Statistics – Population • Entire group we want information about. – Sample •
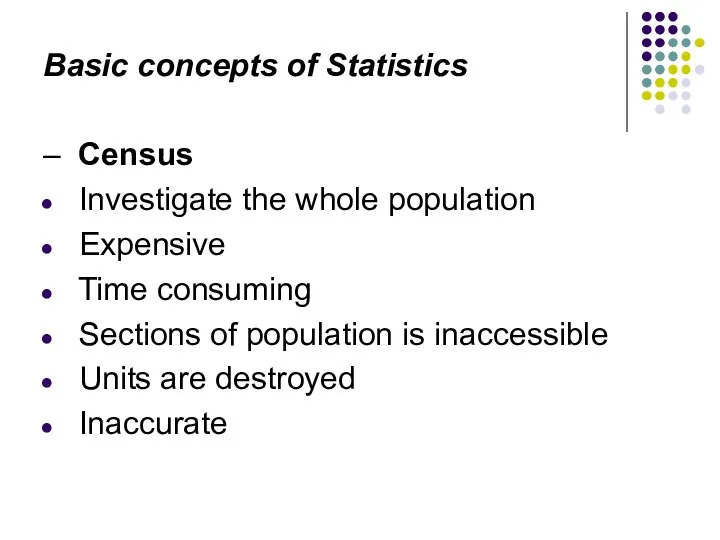
- 58. Basic concepts of Statistics – Census Investigate the whole population Expensive Time consuming Sections of population
- 60. Statistics for Business and Economics, 6e © 2007 Pearson Education, Inc. Chap 1- Key Definitions What
- 61. Key Definitions A parameter is a specific characteristic of a population A statistic is a specific
- 62. Statistics for Business and Economics, 6e © 2007 Pearson Education, Inc. Chap 1- Population vs. Sample
- 63. Statistics for Business and Economics, 6e © 2007 Pearson Education, Inc. Chap 1- Examples of Populations
- 64. Statistics for Business and Economics, 6e © 2007 Pearson Education, Inc. Chap 1- Random Sampling Simple
- 65. Variables Traits or characteristics that can change values from case to case. A variable is what
- 66. Types Of Variables In causal relationships: CAUSE =>EFFECT independent variable & dependent variable •Independent variable: is
- 67. Types Of Variables •Discrete variables are measured in units that cannot be subdivided. Example: Number of
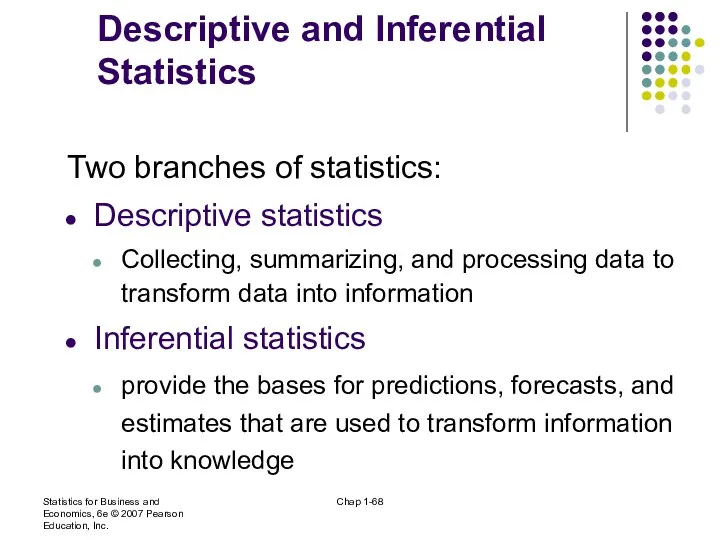
- 68. Statistics for Business and Economics, 6e © 2007 Pearson Education, Inc. Chap 1- Descriptive and Inferential
- 69. Descriptive Statistics Collect data e.g., Survey Gives us the overall picture about data •Presents data in
- 70. Descriptive Statistics Summarize data e.g., Sample mean = •Avoids inferences Examples: •Measures of central location Mean,
- 71. Inferential Statistics •Take decision on overall population using a sample “Sampled” data are incomplete but can
- 72. Statistics for Business and Economics, 6e © 2007 Pearson Education, Inc. Chap 1- Inferential Statistics Estimation
- 73. Predictive Modeling The science of predicting future outcomes based on historical events. Model Building: “Developing set
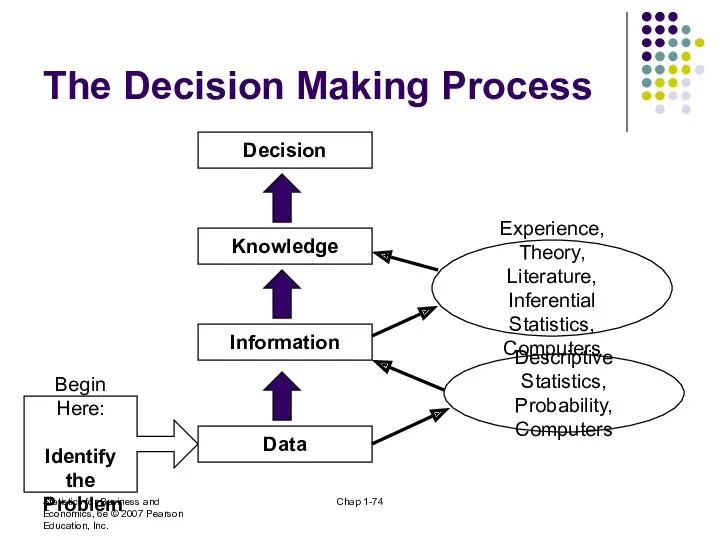
- 74. Statistics for Business and Economics, 6e © 2007 Pearson Education, Inc. Chap 1- The Decision Making
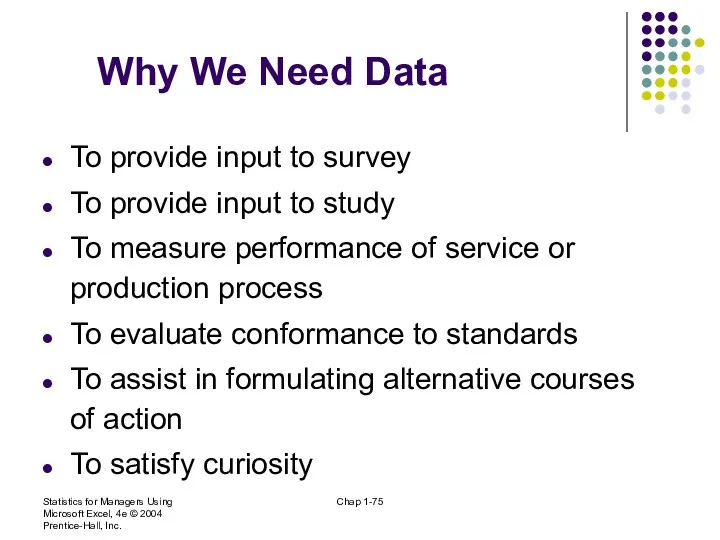
- 75. Statistics for Managers Using Microsoft Excel, 4e © 2004 Prentice-Hall, Inc. Chap 1- Why We Need
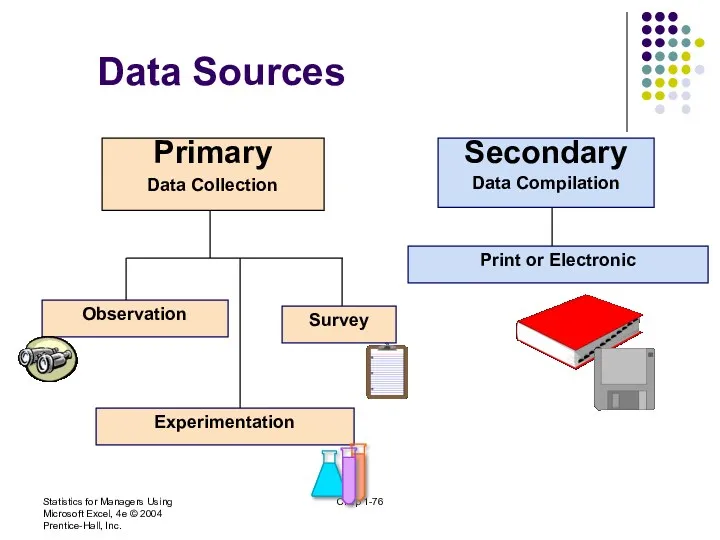
- 76. Statistics for Managers Using Microsoft Excel, 4e © 2004 Prentice-Hall, Inc. Chap 1- Data Sources Secondary
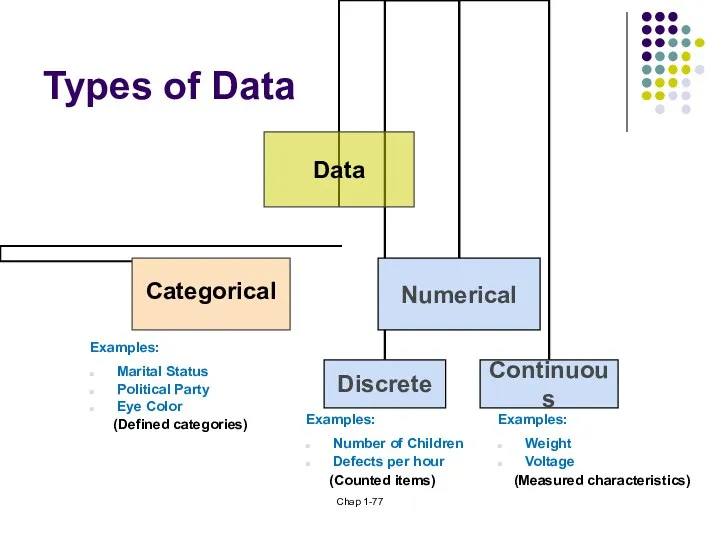
- 77. Chap 1- Types of Data Examples: Marital Status Political Party Eye Color (Defined categories) Examples: Number
- 80. Problems associated with the collection of data: – Characteristics have to be measured. – Measurements can
- 81. Problems associated with the collection of data: – Make sure of the following: • Who conducted
- 82. How to design a questionnaire – Questions should: • Be simply stated. • Have no suggestion
- 83. Appearance and layout of a questionnaire – Attractive look. – Coloured paper. – Clear instructions on
- 84. Interview – Fieldworker completed questionnaire • Higher response rate and data collection is immediate. – Mailed
- 85. Editing the data – Obvious errors should be eliminated. – Eliminate questionnaires that are incomplete and
- 87. Levels of Measurement and Measurement Scales Interval Data Ordinal Data Nominal Data Highest Level Strongest forms
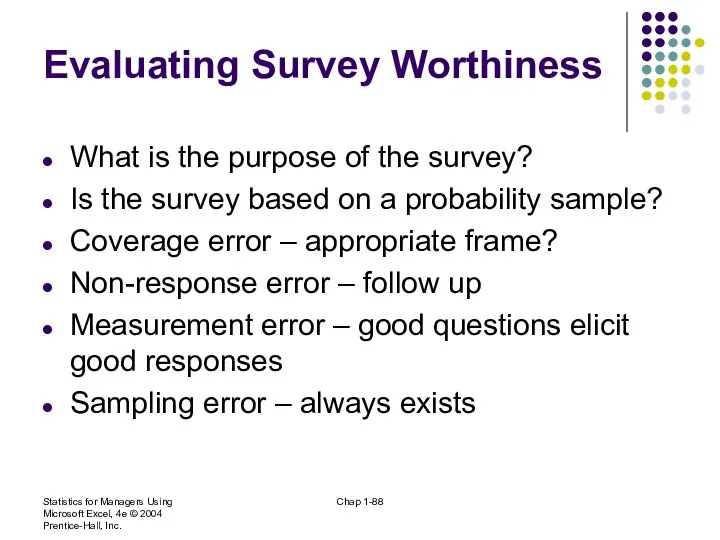
- 88. Statistics for Managers Using Microsoft Excel, 4e © 2004 Prentice-Hall, Inc. Chap 1- Evaluating Survey Worthiness
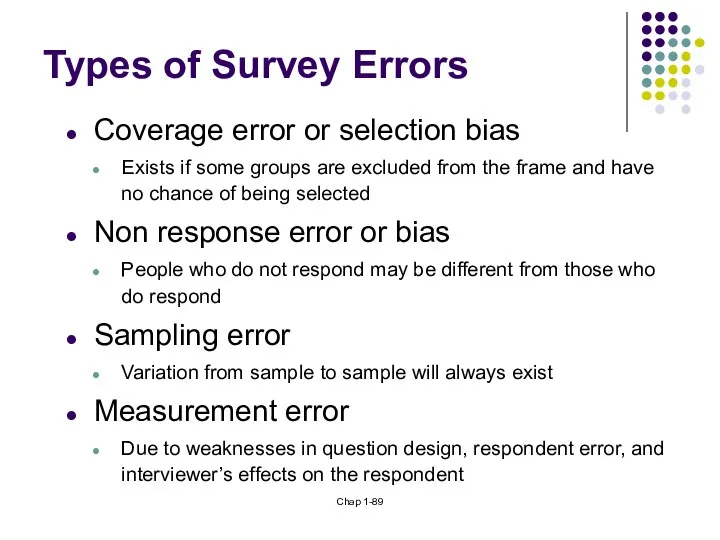
- 89. Chap 1- Types of Survey Errors Coverage error or selection bias Exists if some groups are
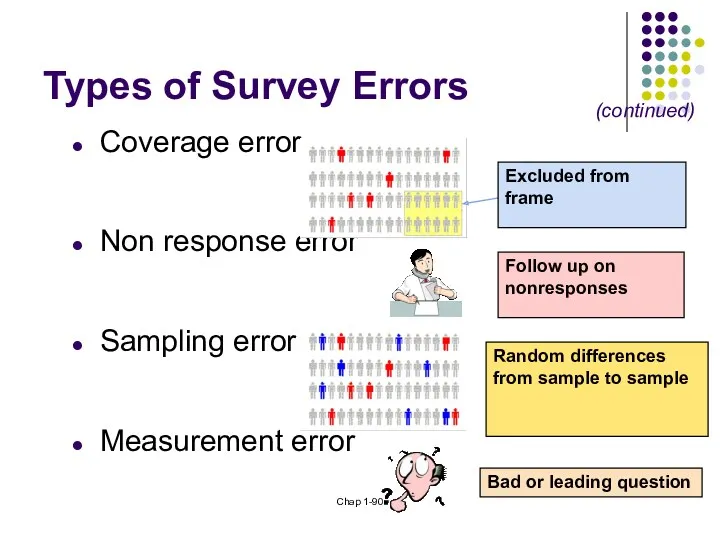
- 90. Chap 1- Types of Survey Errors Coverage error Non response error Sampling error Measurement error Excluded
- 92. Скачать презентацию
LITERATURE
1. Siegel, Andrew F. Practical Business Statistics. Sixth edition. Amsterdam: Academic
LITERATURE
1. Siegel, Andrew F. Practical Business Statistics. Sixth edition. Amsterdam: Academic

6.Сигел, Э. Практическая бизнес-статистика: Пер. с англ. / Э.Сигел. – М.:
6.Сигел, Э. Практическая бизнес-статистика: Пер. с англ. / Э.Сигел. – М.:
Business Statistics
What and Why
Business Statistics
What and Why
Welcome to the world of statistics. This is a world you
Welcome to the world of statistics. This is a world you
The early chapters will introduce you to the role of statistics
The early chapters will introduce you to the role of statistics
Is knowledge of statistics really necessary to be successful in business?
Is knowledge of statistics really necessary to be successful in business?
Is statistics difficult?
Statistics is no more difficult than any other field
Is statistics difficult?
Statistics is no more difficult than any other field
Although a few die-hard purists may bemoan the decline of technical
Although a few die-hard purists may bemoan the decline of technical
Does learning statistics decrease your decision-making flexibility?
Knowledge of decisions enhances
Does learning statistics decrease your decision-making flexibility?
Knowledge of decisions enhances
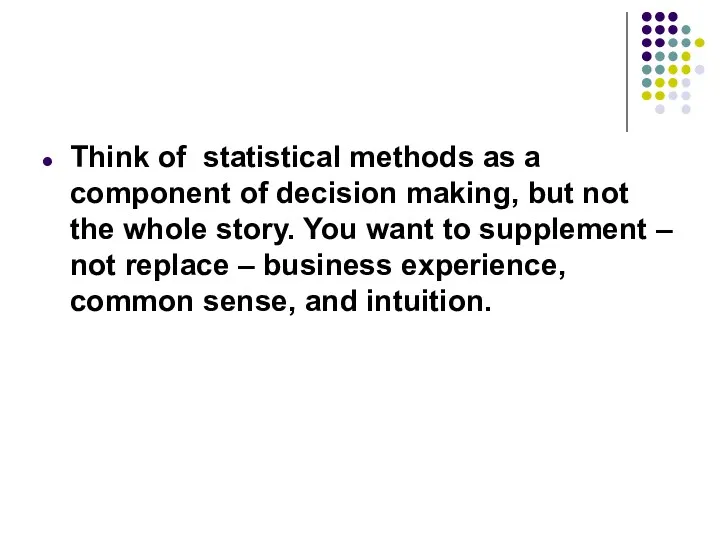
Think of statistical methods as a component of decision making, but
Think of statistical methods as a component of decision making, but
Introduction into Business Statistics
Introduction into Business Statistics
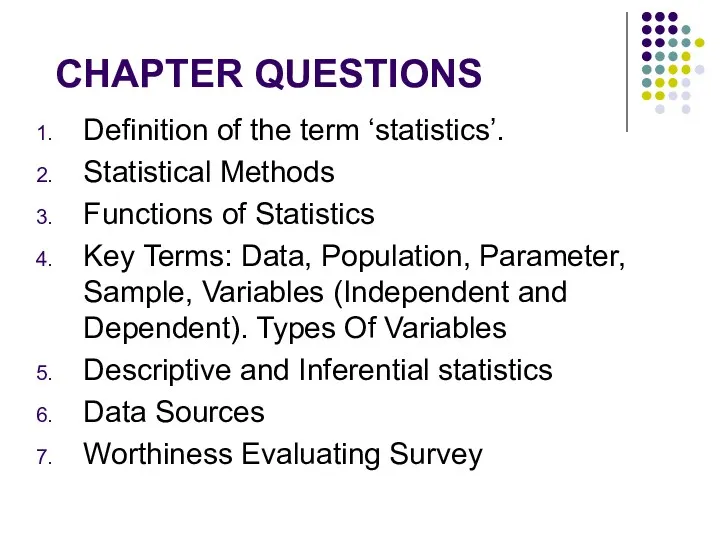
СHAPTER QUESTIONS
Definition of the term ‘statistics’.
Statistical Methods
Functions of Statistics
Key Terms:
СHAPTER QUESTIONS
Definition of the term ‘statistics’.
Statistical Methods
Functions of Statistics
Key Terms:
Statistics for Business and Economics, 6e © 2007 Pearson Education, Inc.
Chap
Statistics for Business and Economics, 6e © 2007 Pearson Education, Inc.
Chap
Introduction
The word “statistics” is very popularly used in practice. It conveys
Introduction
The word “statistics” is very popularly used in practice. It conveys
Such statistics are quite commonly found in newspapers, journals, reports and
Such statistics are quite commonly found in newspapers, journals, reports and
In addition to meaning numerical facts, “statistics” also refers to a
In addition to meaning numerical facts, “statistics” also refers to a
What is statistics?
Statistics is the art and science of collecting and
What is statistics?
Statistics is the art and science of collecting and
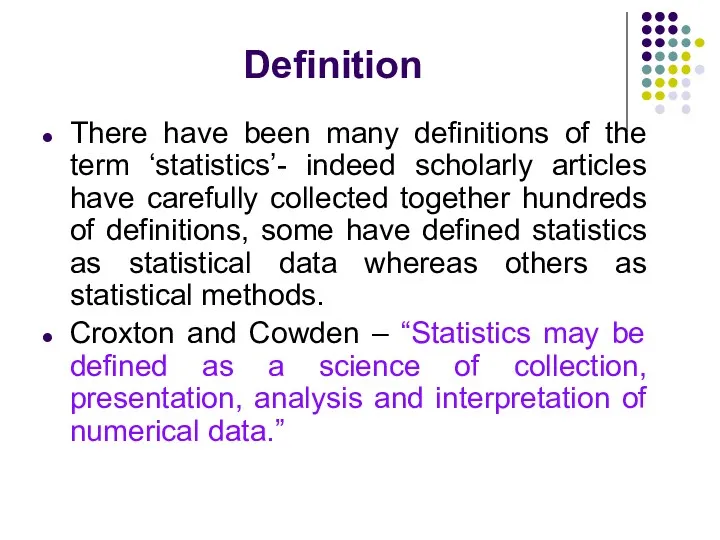
Definition
There have been many definitions of the term ‘statistics’- indeed scholarly
Definition
There have been many definitions of the term ‘statistics’- indeed scholarly
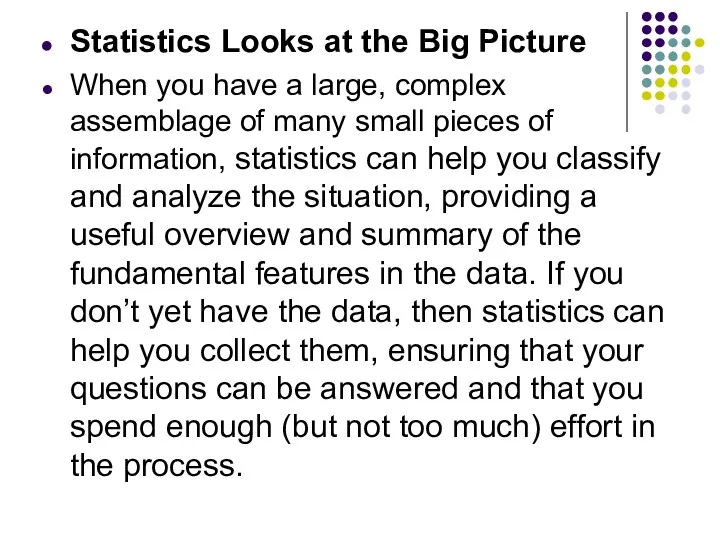
Statistics Looks at the Big Picture
When you have a large, complex
Statistics Looks at the Big Picture
When you have a large, complex
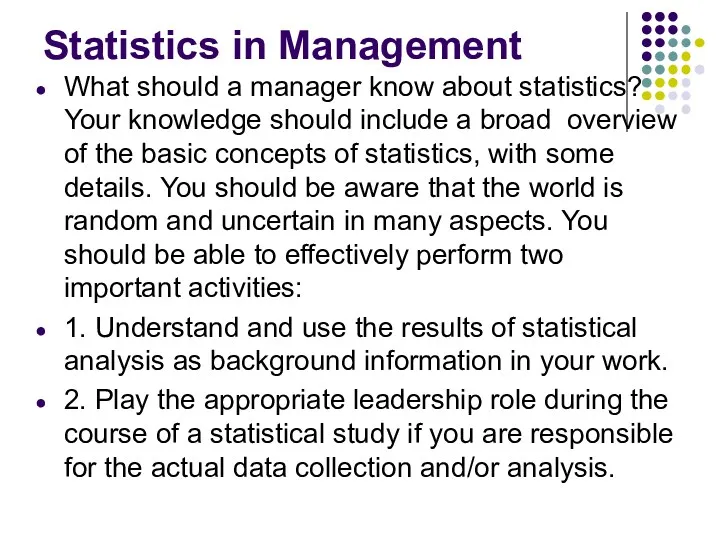
Statistics in Management
What should a manager know about statistics? Your knowledge
Statistics in Management
What should a manager know about statistics? Your knowledge
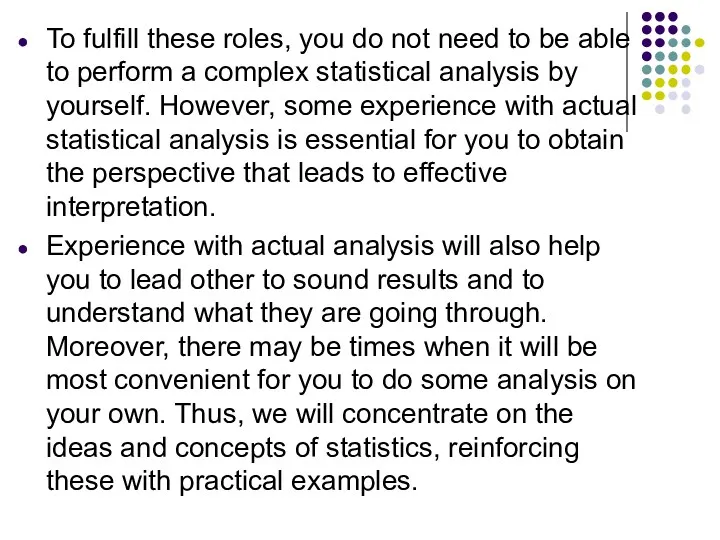
To fulfill these roles, you do not need to be able
To fulfill these roles, you do not need to be able
The five basic activities of statistics
In the beginning stages of a
The five basic activities of statistics
In the beginning stages of a
In the modeling phase, a system of assumptions and equations is
In the modeling phase, a system of assumptions and equations is
Designing a Plan for Data Collection -
might be called sample
Designing a Plan for Data Collection -
might be called sample
Statistics is particularly useful when you have a large group of
Statistics is particularly useful when you have a large group of
The random sample is one of the best ways to
The random sample is one of the best ways to
1. You are guaranteed that the selection process is fair and
1. You are guaranteed that the selection process is fair and
Exploring the Data
As soon as you have a set of data,
Exploring the Data
As soon as you have a set of data,
1. By verifying that the expected relationships actually exist in the
1. By verifying that the expected relationships actually exist in the
Exploration is the first phase once you have data to look
Exploration is the first phase once you have data to look
Modeling the Data
In statistics, a model is a system of assumption
Modeling the Data
In statistics, a model is a system of assumption
Here are some models that can be useful in analyzing data.
Here are some models that can be useful in analyzing data.
1. Consider a simple model that generates artificial data consisting of
1. Consider a simple model that generates artificial data consisting of
Estimating an Unknown Quantity
- produces the best educated guess possible
Estimating an Unknown Quantity
- produces the best educated guess possible
Estimating an Unknown Quantity
Next period (quarter’s) sales.
What the government will
Estimating an Unknown Quantity
Next period (quarter’s) sales.
What the government will
Statistics can shed light on some of these situations by producing
Statistics can shed light on some of these situations by producing
Statistical estimation also provides an indication of the amount of uncertainty
Statistical estimation also provides an indication of the amount of uncertainty
Hypothesis testing
Statistical hypothesis testing is the use of data in deciding
Hypothesis testing
Statistical hypothesis testing is the use of data in deciding
Here are some examples of hypothesis that might be tested using
Here are some examples of hypothesis that might be tested using
Note that each hypothesis makes a definite statement, and it may
Note that each hypothesis makes a definite statement, and it may

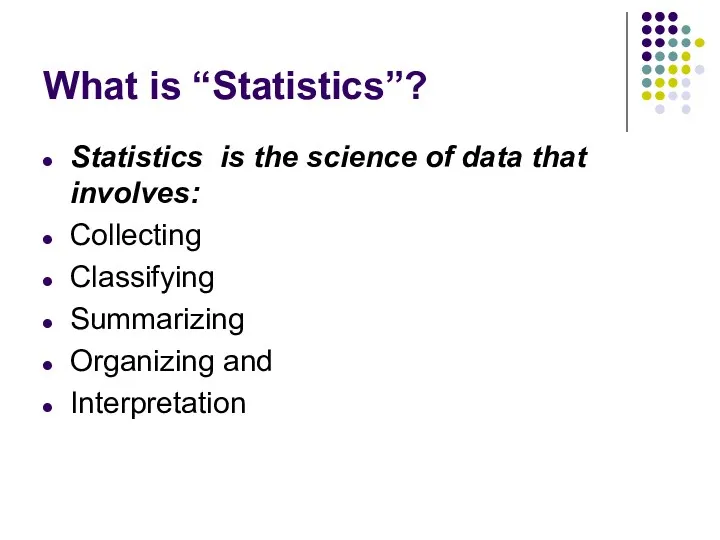
What is “Statistics”?
Statistics is the science of data that involves:
Collecting
Classifying
Summarizing
Organizing and
Interpretation
What is “Statistics”?
Statistics is the science of data that involves:
Collecting
Classifying
Summarizing
Organizing and
Interpretation
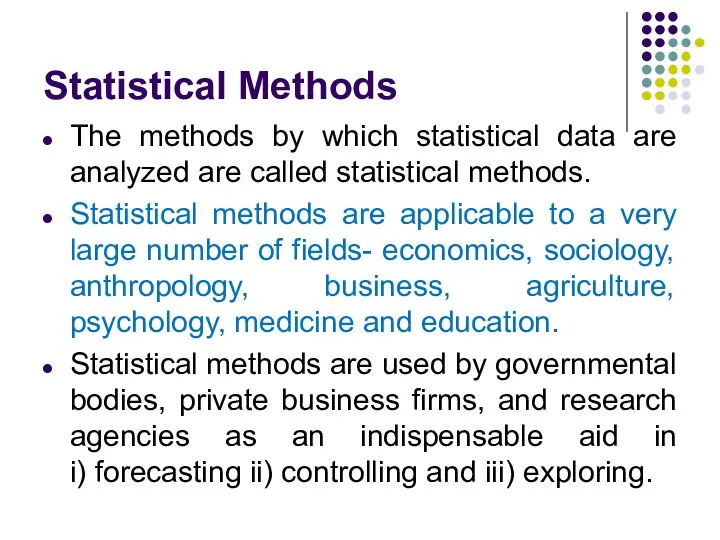
Statistical Methods
The methods by which statistical data are analyzed are called
Statistical Methods
The methods by which statistical data are analyzed are called
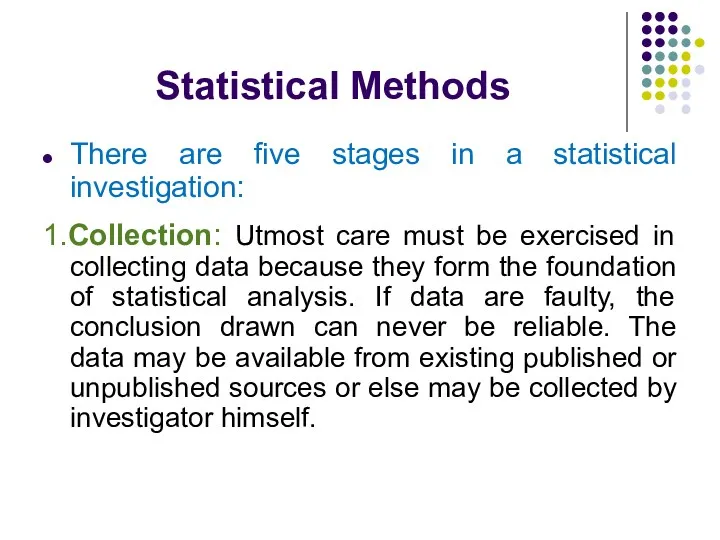
Statistical Methods
There are five stages in a statistical investigation:
1.Collection: Utmost
Statistical Methods
There are five stages in a statistical investigation:
1.Collection: Utmost
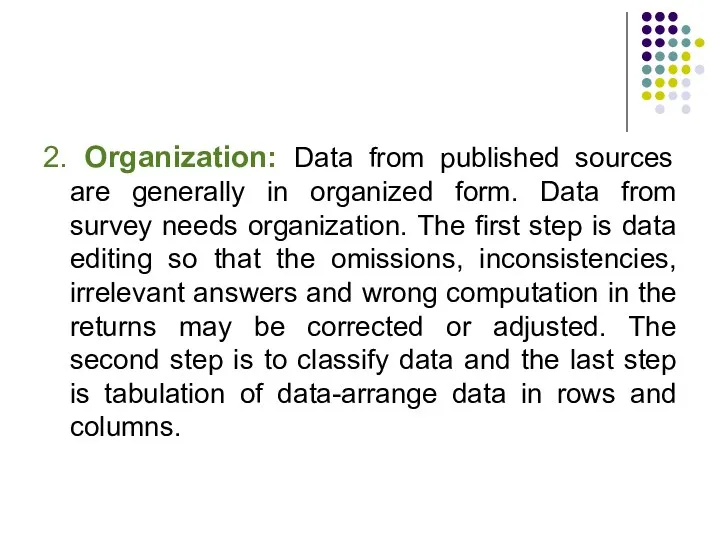
2. Organization: Data from published sources are generally in organized form.
2. Organization: Data from published sources are generally in organized form.
3.Presentation: After the data have been collected and organized, they are
3.Presentation: After the data have been collected and organized, they are
5.Interpretation: Drawing conclusions from the data collected and analyzed. It is
5.Interpretation: Drawing conclusions from the data collected and analyzed. It is
Statistics: Science or Art
Whether statistics is a science or an art
Statistics: Science or Art
Whether statistics is a science or an art
Art, on the other hand, refers to the skill of handling
Art, on the other hand, refers to the skill of handling
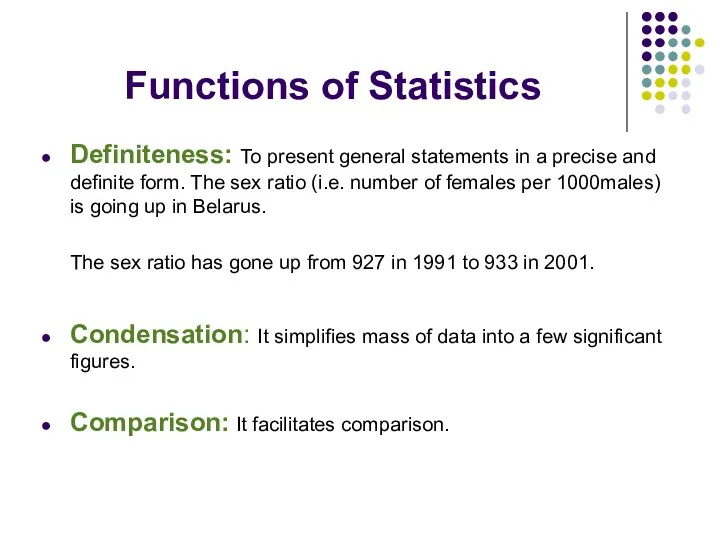
Functions of Statistics
Definiteness: To present general statements in a precise and
Functions of Statistics
Definiteness: To present general statements in a precise and
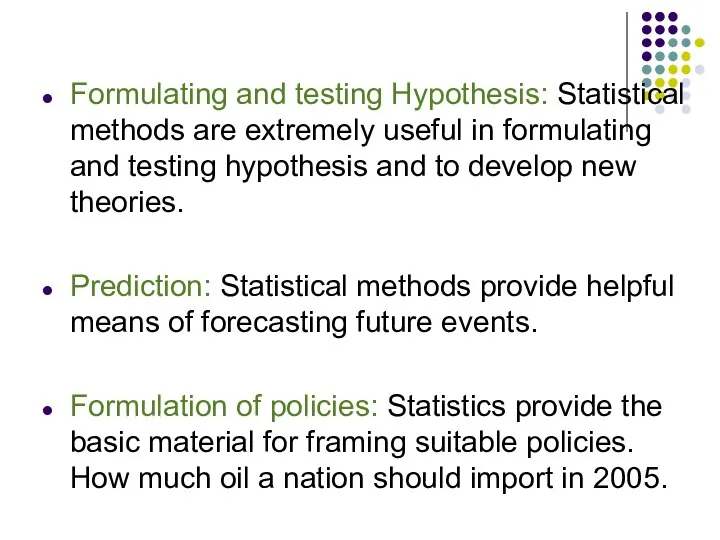
Formulating and testing Hypothesis: Statistical methods are extremely useful in formulating
Formulating and testing Hypothesis: Statistical methods are extremely useful in formulating
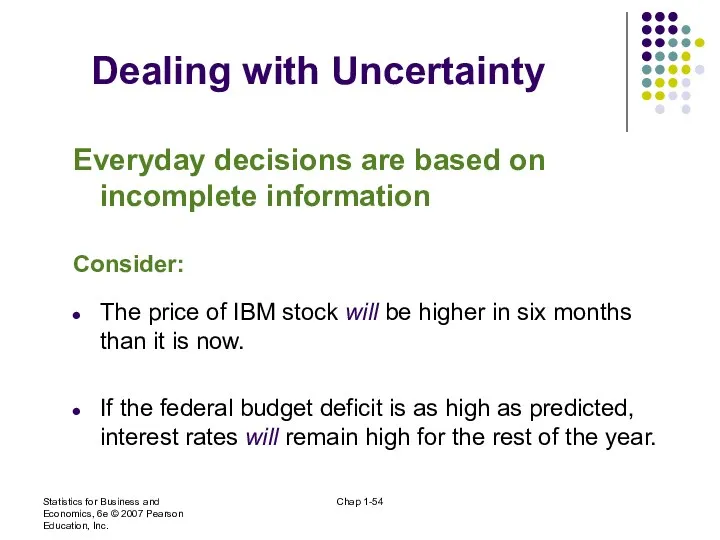
Statistics for Business and Economics, 6e © 2007 Pearson Education, Inc.
Chap
Statistics for Business and Economics, 6e © 2007 Pearson Education, Inc.
Chap

Statistics for Business and Economics, 6e © 2007 Pearson Education, Inc.
Chap
Statistics for Business and Economics, 6e © 2007 Pearson Education, Inc.
Chap
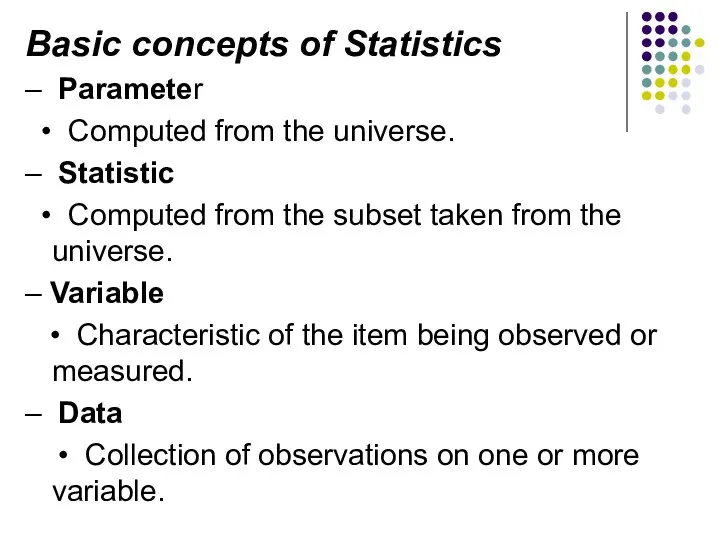
Basic concepts of Statistics
– Parameter
• Computed from the
Basic concepts of Statistics
– Parameter
• Computed from the
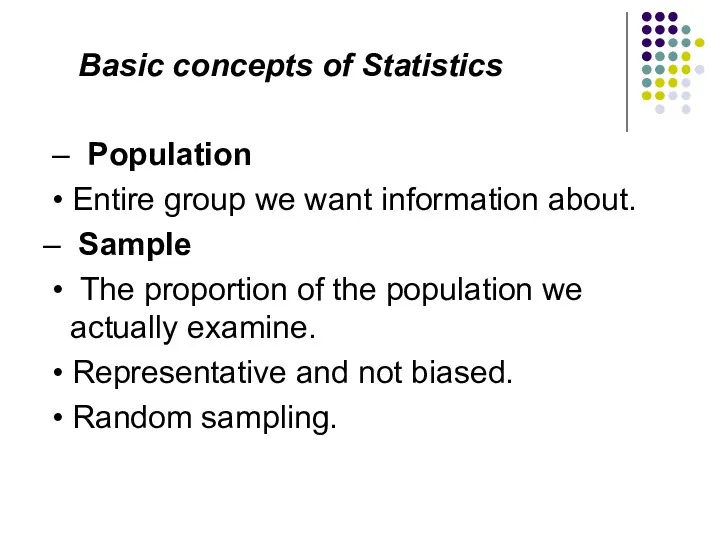
Basic concepts of Statistics
– Population
• Entire group
Basic concepts of Statistics
– Population
• Entire group
Basic concepts of Statistics
– Census
Investigate the whole population
Basic concepts of Statistics
– Census
Investigate the whole population

Statistics for Business and Economics, 6e © 2007 Pearson Education, Inc.
Chap
Statistics for Business and Economics, 6e © 2007 Pearson Education, Inc.
Chap
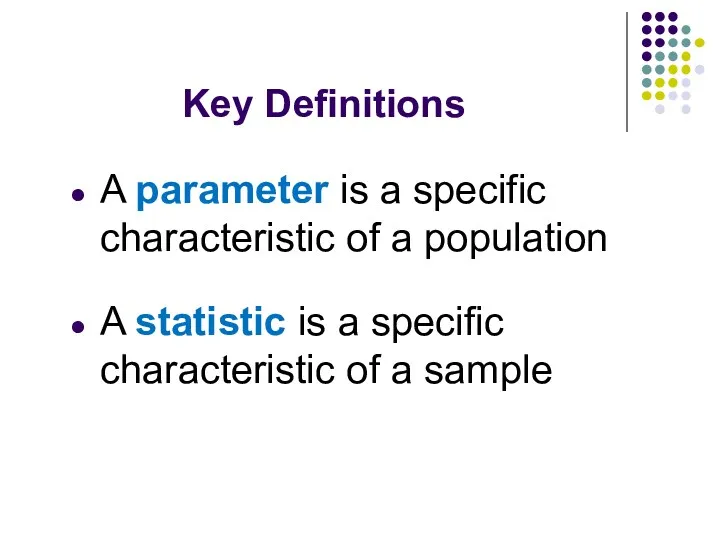
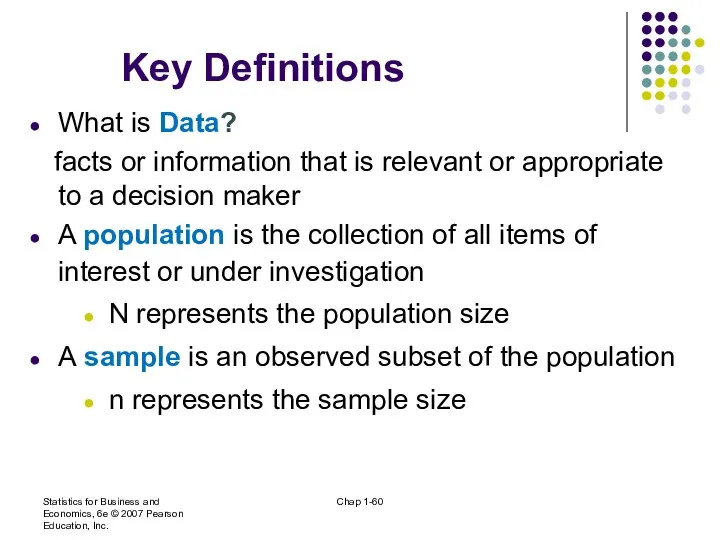
Key Definitions
A parameter is a specific characteristic of a population
A statistic
Key Definitions
A parameter is a specific characteristic of a population
A statistic
Statistics for Business and Economics, 6e © 2007 Pearson Education, Inc.
Chap
Statistics for Business and Economics, 6e © 2007 Pearson Education, Inc.
Chap
Statistics for Business and Economics, 6e © 2007 Pearson Education, Inc.
Chap
Statistics for Business and Economics, 6e © 2007 Pearson Education, Inc.
Chap
Statistics for Business and Economics, 6e © 2007 Pearson Education, Inc.
Chap
Statistics for Business and Economics, 6e © 2007 Pearson Education, Inc.
Chap
Variables
Traits or characteristics that can change values from case to case.
Variables
Traits or characteristics that can change values from case to case.
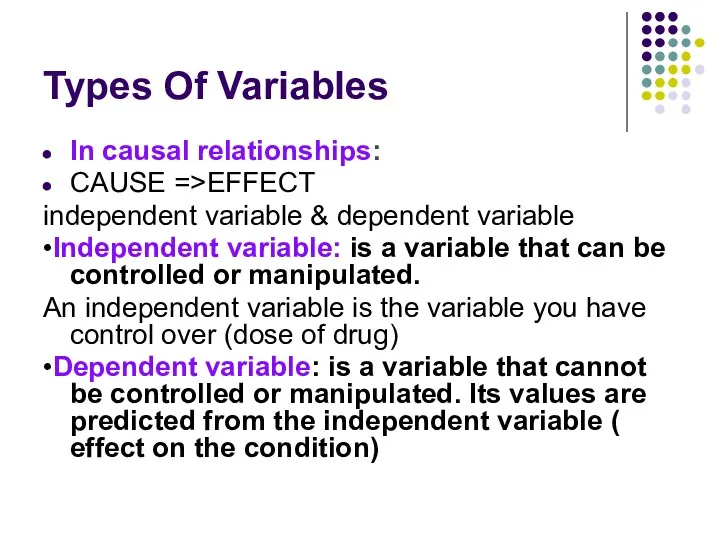
Types Of Variables
In causal relationships:
CAUSE =>EFFECT
independent variable & dependent variable
•Independent variable:
Types Of Variables
In causal relationships:
CAUSE =>EFFECT
independent variable & dependent variable
•Independent variable:
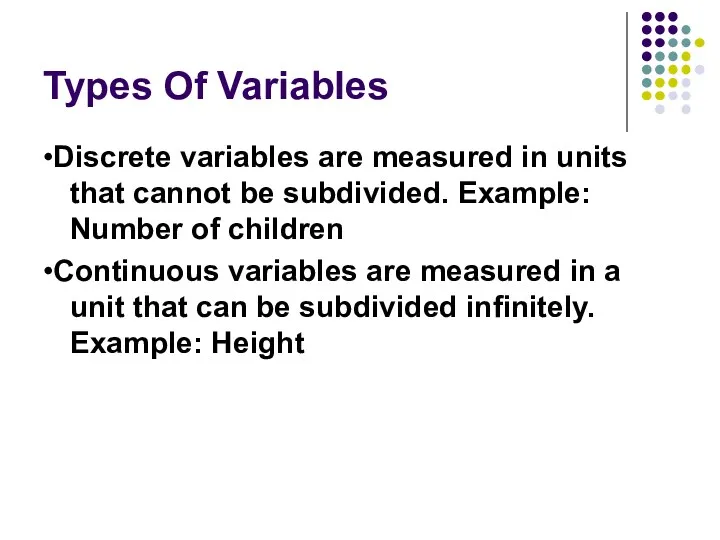
Types Of Variables
•Discrete variables are measured in units that cannot be
Types Of Variables
•Discrete variables are measured in units that cannot be
Statistics for Business and Economics, 6e © 2007 Pearson Education, Inc.
Chap
Statistics for Business and Economics, 6e © 2007 Pearson Education, Inc.
Chap
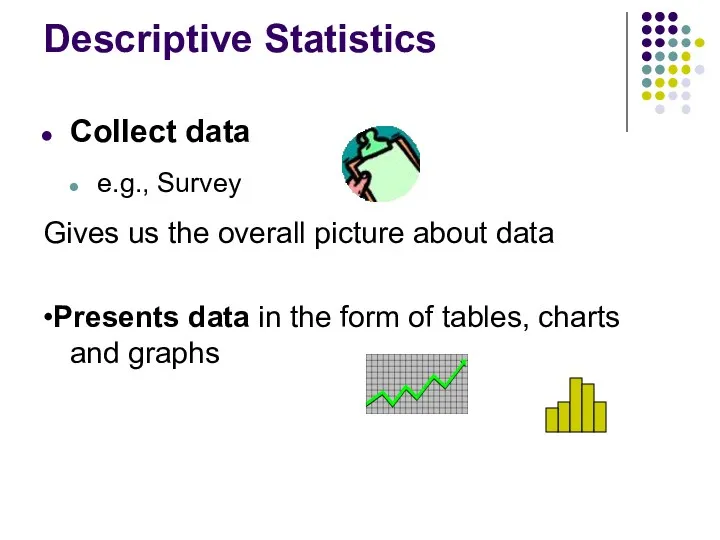
Descriptive Statistics
Collect data
e.g., Survey
Gives us the overall picture about data
•Presents data
Descriptive Statistics
Collect data
e.g., Survey
Gives us the overall picture about data
•Presents data
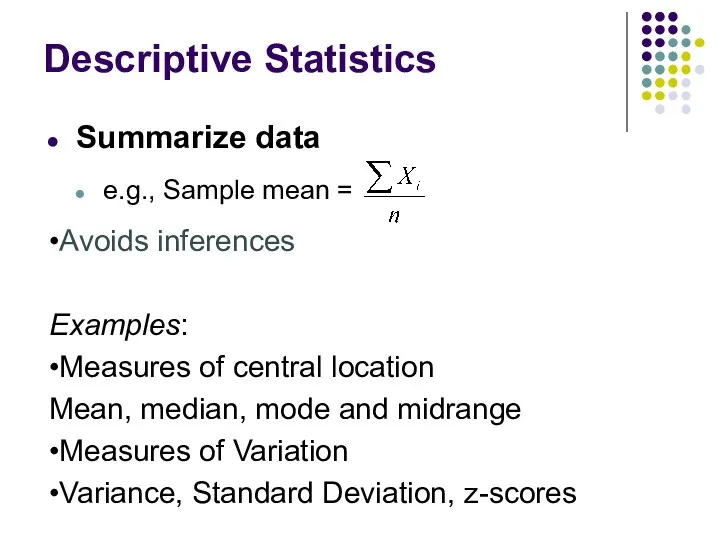
Descriptive Statistics
Summarize data
e.g., Sample mean =
•Avoids inferences
Examples:
•Measures of central location
Mean,
Descriptive Statistics
Summarize data
e.g., Sample mean =
•Avoids inferences
Examples:
•Measures of central location
Mean,
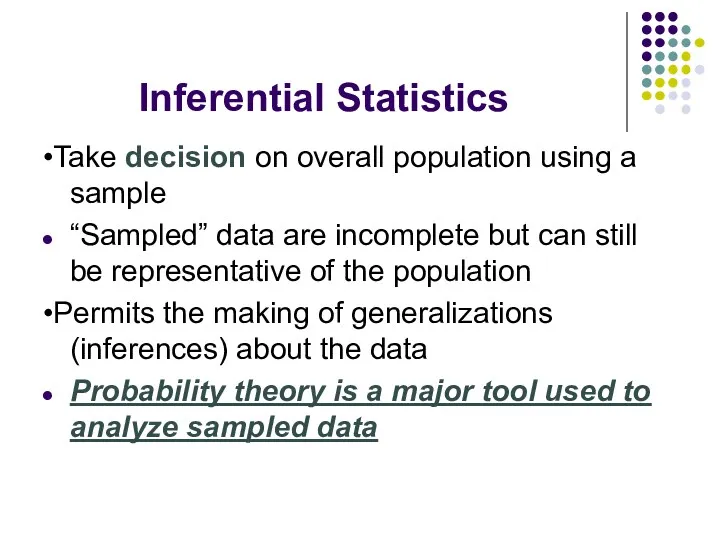
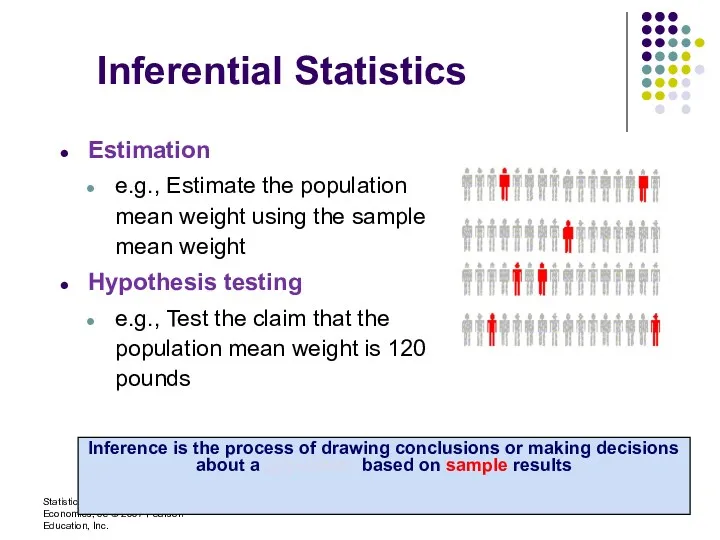
Inferential Statistics
•Take decision on overall population using a sample
“Sampled” data
Inferential Statistics
•Take decision on overall population using a sample
“Sampled” data
Statistics for Business and Economics, 6e © 2007 Pearson Education, Inc.
Chap
Statistics for Business and Economics, 6e © 2007 Pearson Education, Inc.
Chap
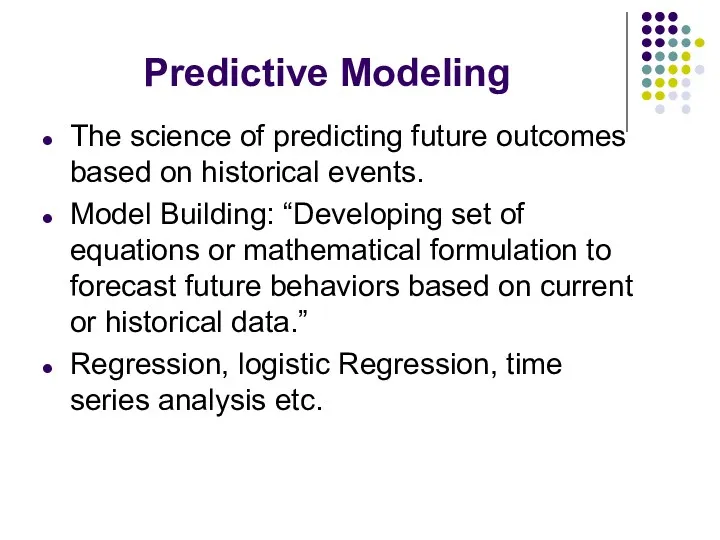
Predictive Modeling
The science of predicting future outcomes based on historical events.
Model
Predictive Modeling
The science of predicting future outcomes based on historical events.
Model
Statistics for Business and Economics, 6e © 2007 Pearson Education, Inc.
Chap
Statistics for Business and Economics, 6e © 2007 Pearson Education, Inc.
Chap
Statistics for Managers Using Microsoft Excel, 4e © 2004 Prentice-Hall, Inc.
Chap
Statistics for Managers Using Microsoft Excel, 4e © 2004 Prentice-Hall, Inc.
Chap
Statistics for Managers Using Microsoft Excel, 4e © 2004 Prentice-Hall, Inc.
Chap
Statistics for Managers Using Microsoft Excel, 4e © 2004 Prentice-Hall, Inc.
Chap
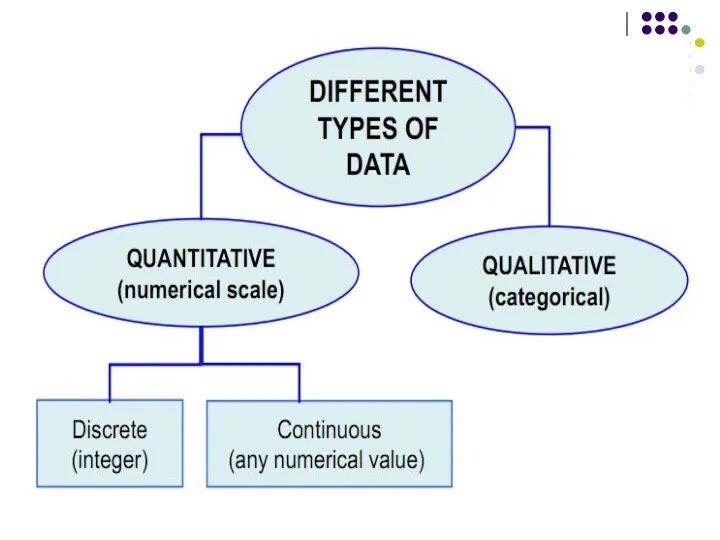
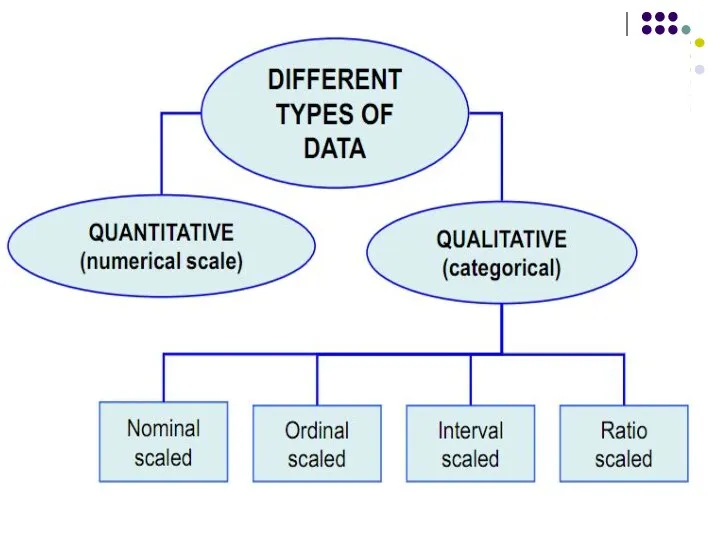
Chap 1-
Types of Data
Examples:
Marital Status
Political Party
Eye Color
(Defined categories)
Examples:
Number of Children
Defects
Chap 1-
Types of Data
Examples:
Marital Status
Political Party
Eye Color
(Defined categories)
Examples:
Number of Children
Defects

Problems associated with the collection
of data:
– Characteristics
Problems associated with the collection
of data:
– Characteristics
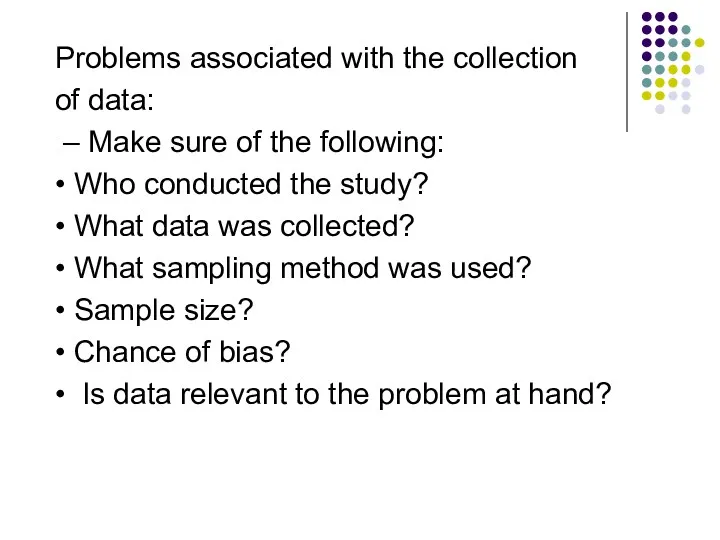
Problems associated with the collection
of data:
– Make sure
Problems associated with the collection
of data:
– Make sure
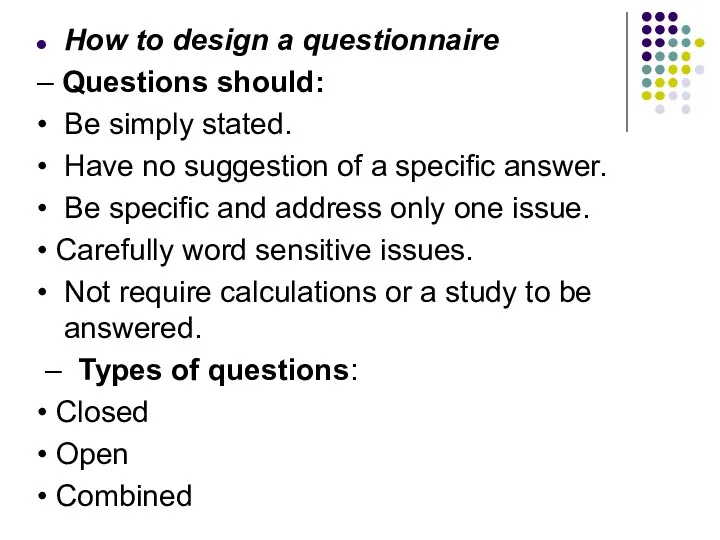
How to design a questionnaire
– Questions should:
• Be simply
How to design a questionnaire
– Questions should:
• Be simply
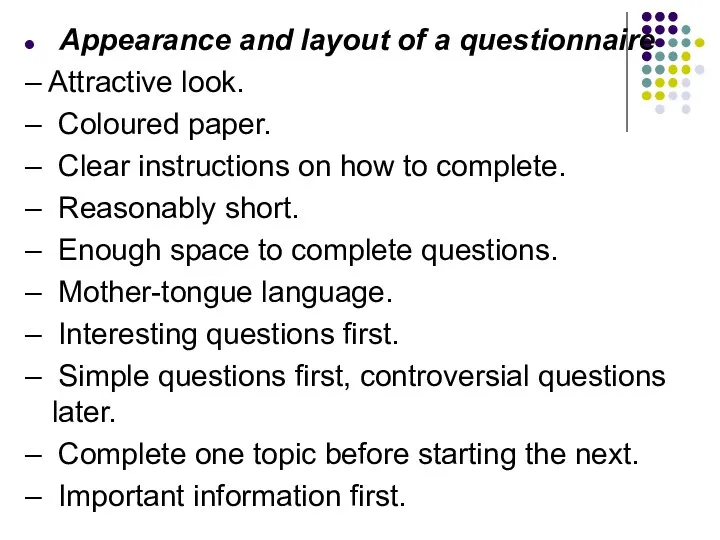
Appearance and layout of a questionnaire
– Attractive look.
–
Appearance and layout of a questionnaire
– Attractive look.
–
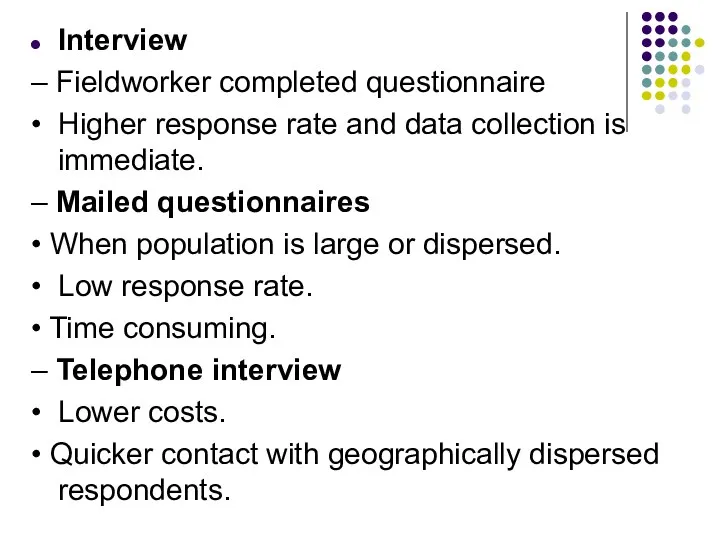
Interview
– Fieldworker completed questionnaire
• Higher response rate and data
Interview
– Fieldworker completed questionnaire
• Higher response rate and data
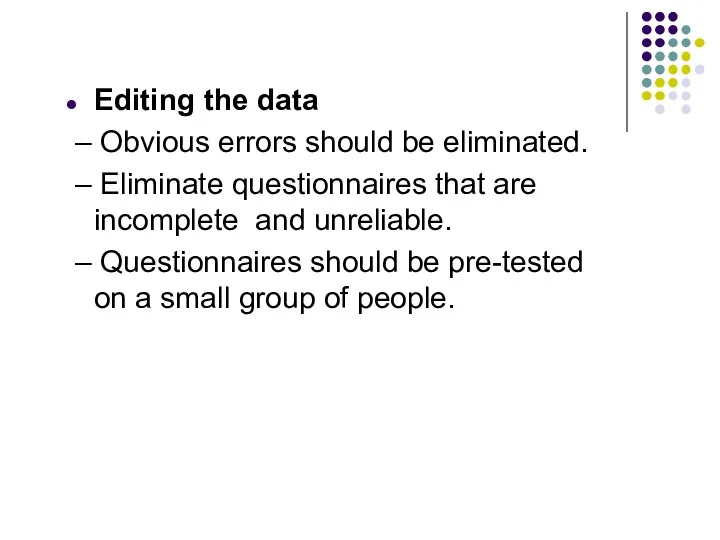
Editing the data
– Obvious errors should be eliminated.
Editing the data
– Obvious errors should be eliminated.

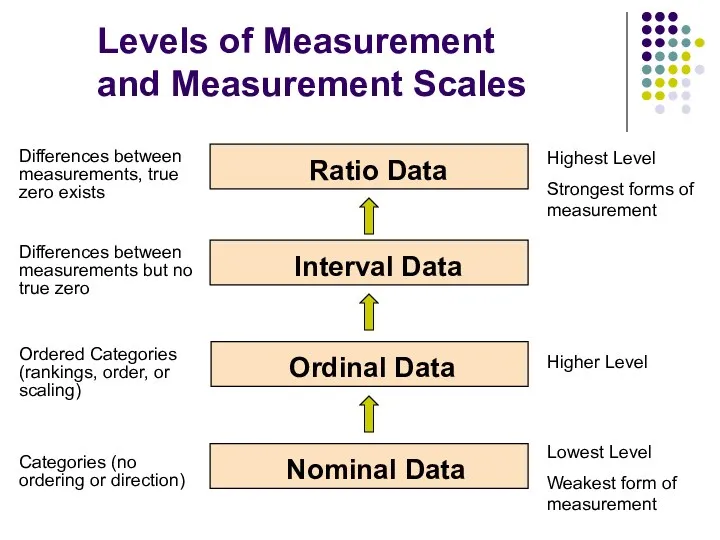
Levels of Measurement
and Measurement Scales
Interval Data
Ordinal Data
Nominal Data
Highest Level
Strongest forms
Levels of Measurement
and Measurement Scales
Interval Data
Ordinal Data
Nominal Data
Highest Level
Strongest forms
Statistics for Managers Using Microsoft Excel, 4e © 2004 Prentice-Hall, Inc.
Chap
Statistics for Managers Using Microsoft Excel, 4e © 2004 Prentice-Hall, Inc.
Chap
Chap 1-
Types of Survey Errors
Coverage error or selection bias
Exists if some
Chap 1-
Types of Survey Errors
Coverage error or selection bias
Exists if some
Chap 1-
Types of Survey Errors
Coverage error
Non response error
Sampling error
Measurement error
Excluded from
Chap 1-
Types of Survey Errors
Coverage error
Non response error
Sampling error
Measurement error
Excluded from
 Экономическая система и её типы. Модели смешанной экономики. Предпринимательская деятельность. (Тема 3-4)
 20231228_8_klass_struktura_ekonomiki
 Проблема утечки мозгов и пути ее решения
 Международное кредитование
 Analyses of the article
 Основные фонды предприятия
 Зарубежный опыт управления ЖКХ. (Тема 9)
 Қазақстан – 2050 Стратегиясы
 Планування праці в аграрному секторі економіки
 Нефть в пространстве и пространство нефти
 Доход и прибыль фирмы
 Теория совершенной конкуренции
 Макроекономічні показники в системі національних рахунків
 Экономическая мысль периода генезиса капитализма
 Товарные запасы торгового предприятия
 Рынок: сущность, механизм, функции
 Соціально-економічні проблеми Свалявського району
 Микроэкономика. Множество производственных возможностей
 Методология неоклассической школы
 Технико-экономический анализ формирования и использования основных производственных фондов предприятия
 Деятельность Сельскохозяйственного кредитного потребительского кооператива Доверие
 Экономическая природа фирмы. (Тема 7)
 Организационное проектирование
 Моделирование бизнес-процессов. Имитационное моделирование с помощью MATLAB. Циклы и кризисы. (Занятие 7)
 Социально-экономические проблемы современной Италии
 Жалобная книга природы
 Анализ бюджетной системы Калининградской области за 2017 год
 Стратегия развития Калининградской области