- Chapter 13. The Cost of Production

Содержание
- 2. Mankiw et al. Principles of Microeconomics, 2nd Canadian Edition Chapter 13: Page Examine what items are
- 3. Mankiw et al. Principles of Microeconomics, 2nd Canadian Edition Chapter 13: Page Supply and demand are
- 4. Mankiw et al. Principles of Microeconomics, 2nd Canadian Edition Chapter 13: Page According to the Law
- 5. Mankiw et al. Principles of Microeconomics, 2nd Canadian Edition Chapter 13: Page Total Revenue The amount
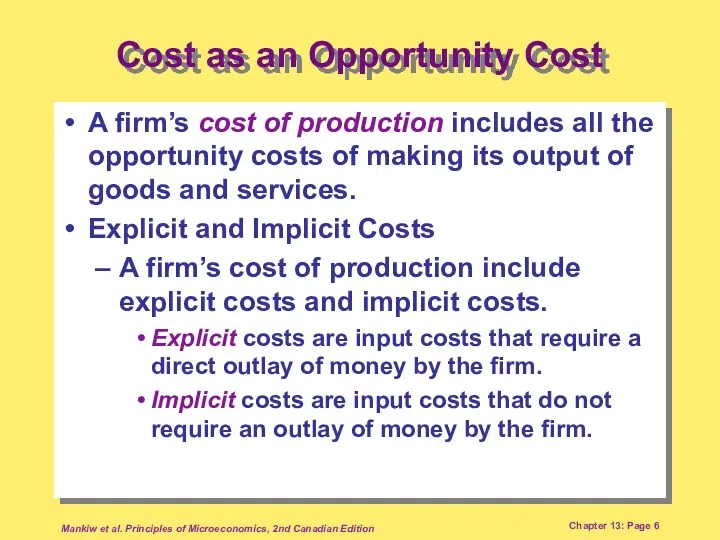
- 6. Mankiw et al. Principles of Microeconomics, 2nd Canadian Edition Chapter 13: Page A firm’s cost of
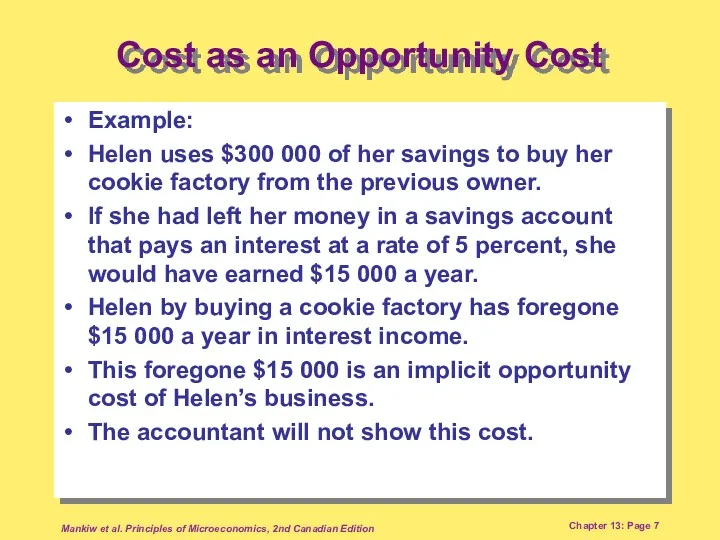
- 7. Mankiw et al. Principles of Microeconomics, 2nd Canadian Edition Chapter 13: Page Example: Helen uses $300
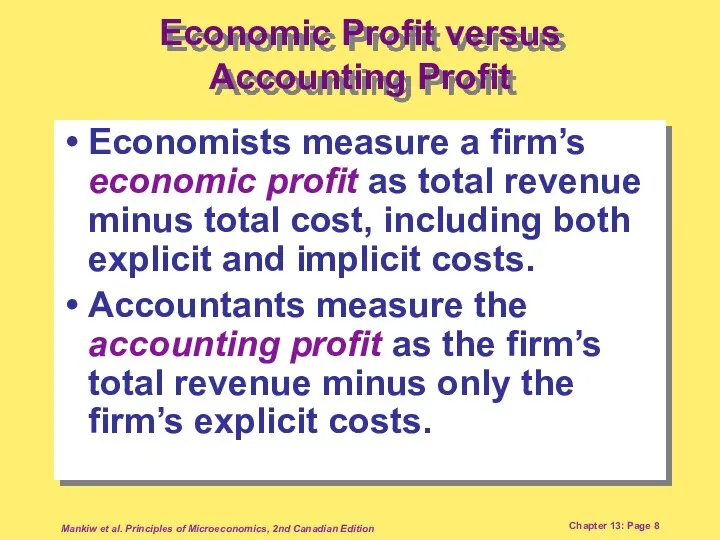
- 8. Mankiw et al. Principles of Microeconomics, 2nd Canadian Edition Chapter 13: Page Economists measure a firm’s
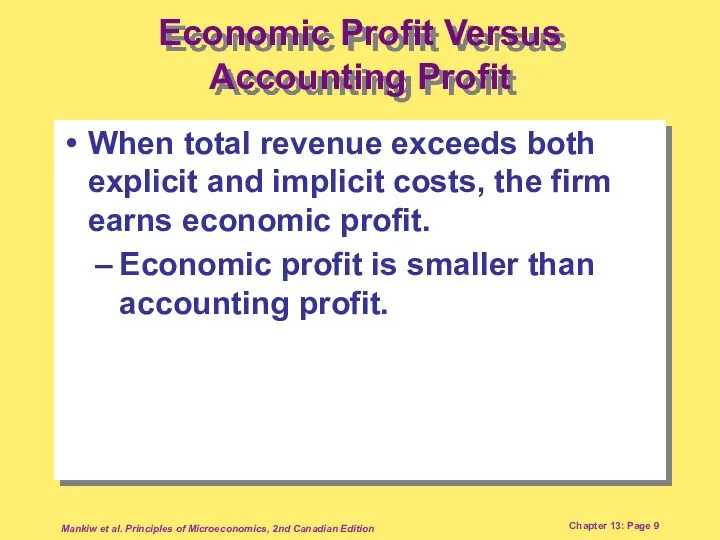
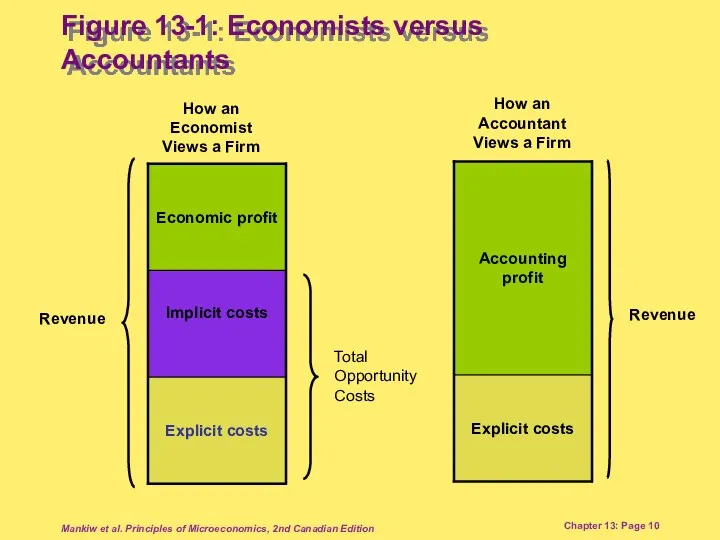
- 9. Mankiw et al. Principles of Microeconomics, 2nd Canadian Edition Chapter 13: Page When total revenue exceeds
- 10. Mankiw et al. Principles of Microeconomics, 2nd Canadian Edition Chapter 13: Page How an Economist Views
- 11. Mankiw et al. Principles of Microeconomics, 2nd Canadian Edition Chapter 13: Page Assumption: The size of
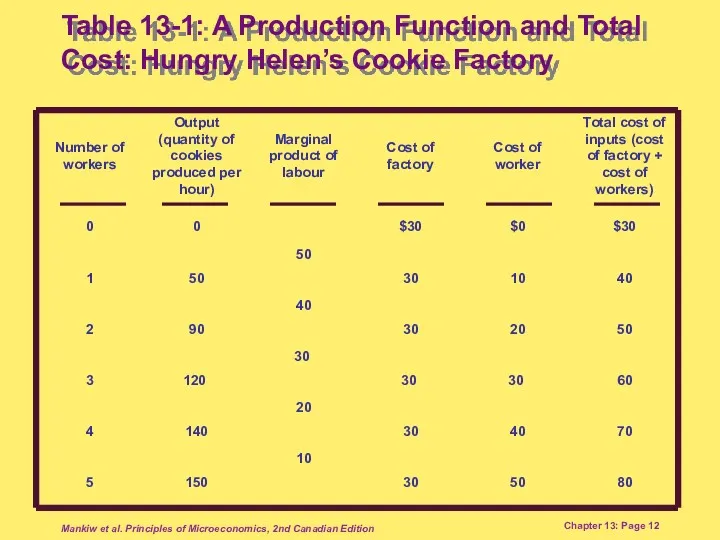
- 12. Mankiw et al. Principles of Microeconomics, 2nd Canadian Edition Chapter 13: Page Table 13-1: A Production
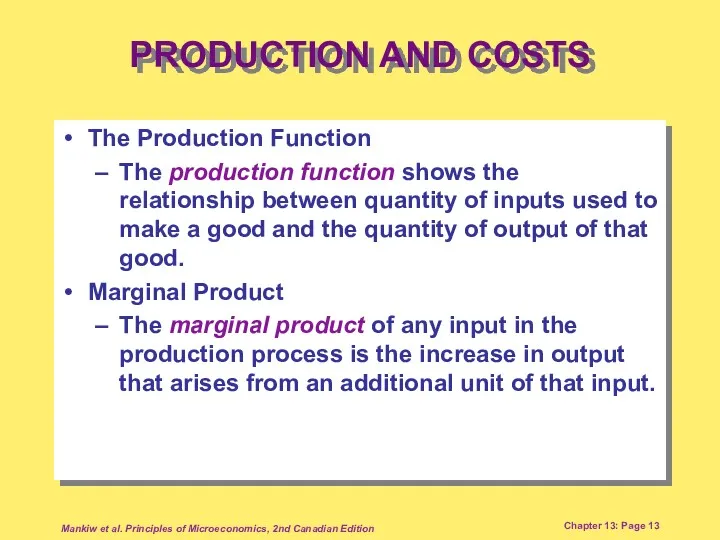
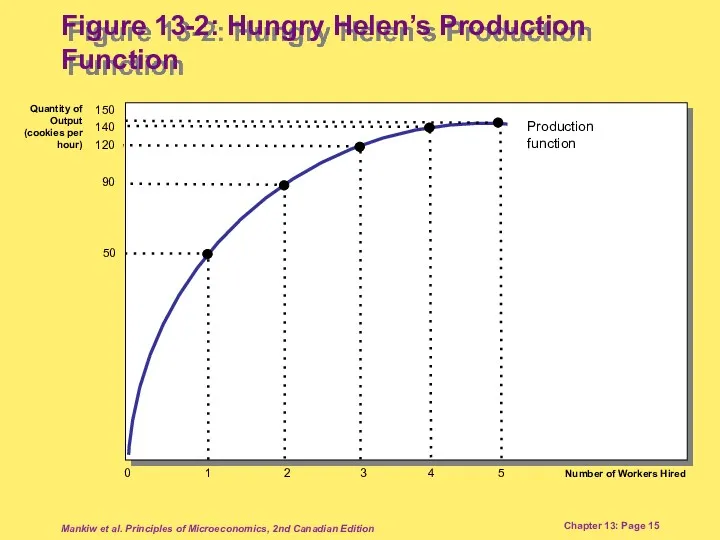
- 13. Mankiw et al. Principles of Microeconomics, 2nd Canadian Edition Chapter 13: Page The Production Function The
- 14. Mankiw et al. Principles of Microeconomics, 2nd Canadian Edition Chapter 13: Page Diminishing Marginal Product Diminishing
- 15. Mankiw et al. Principles of Microeconomics, 2nd Canadian Edition Chapter 13: Page 0 Number of Workers
- 16. Mankiw et al. Principles of Microeconomics, 2nd Canadian Edition Chapter 13: Page Diminishing Marginal Product Diminishing
- 17. Mankiw et al. Principles of Microeconomics, 2nd Canadian Edition Chapter 13: Page Diminishing Marginal Product The
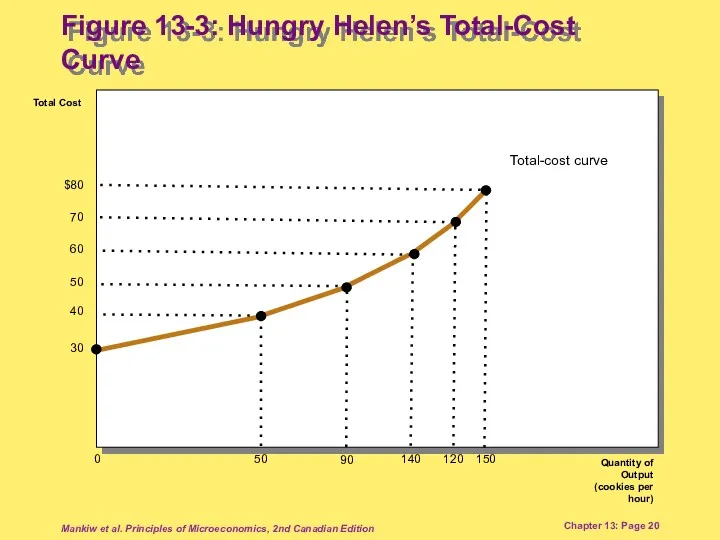
- 18. Mankiw et al. Principles of Microeconomics, 2nd Canadian Edition Chapter 13: Page The relationship between the
- 19. Mankiw et al. Principles of Microeconomics, 2nd Canadian Edition Chapter 13: Page Table 13-1: A Production
- 20. Mankiw et al. Principles of Microeconomics, 2nd Canadian Edition Chapter 13: Page 0 Total Cost Quantity
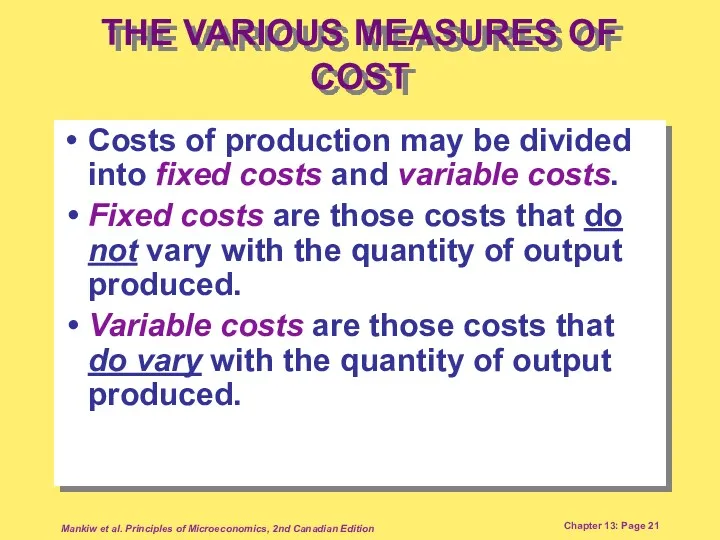
- 21. Mankiw et al. Principles of Microeconomics, 2nd Canadian Edition Chapter 13: Page Costs of production may
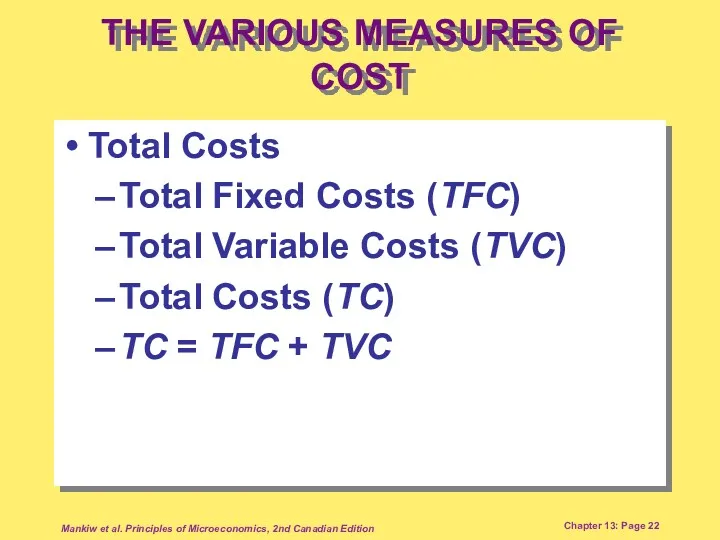
- 22. Mankiw et al. Principles of Microeconomics, 2nd Canadian Edition Chapter 13: Page Total Costs Total Fixed
- 23. Mankiw et al. Principles of Microeconomics, 2nd Canadian Edition Chapter 13: Page Average Costs Average costs
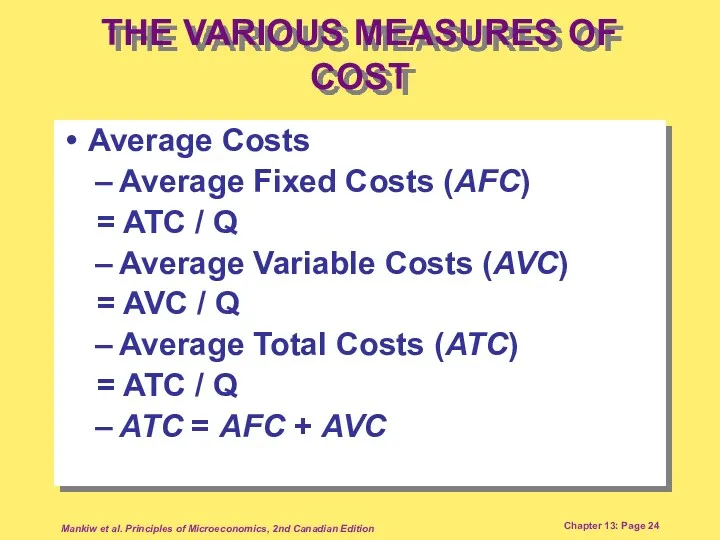
- 24. Mankiw et al. Principles of Microeconomics, 2nd Canadian Edition Chapter 13: Page Average Costs Average Fixed
- 25. Mankiw et al. Principles of Microeconomics, 2nd Canadian Edition Chapter 13: Page Marginal Cost Marginal cost
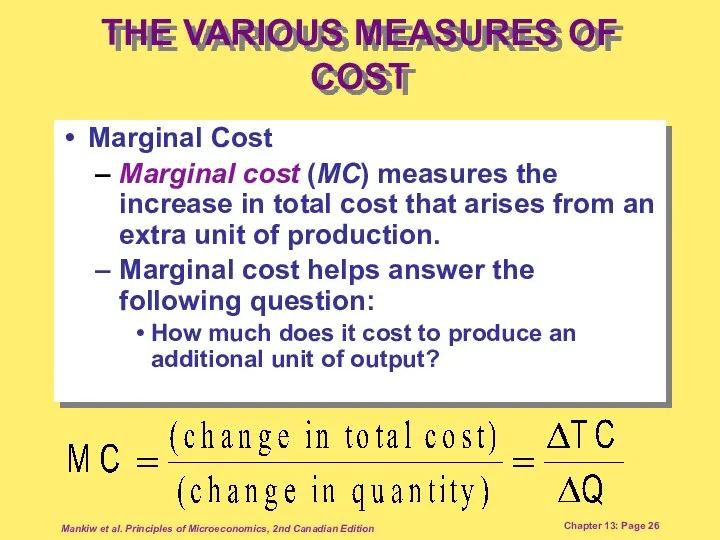
- 26. Mankiw et al. Principles of Microeconomics, 2nd Canadian Edition Chapter 13: Page Marginal Cost Marginal cost
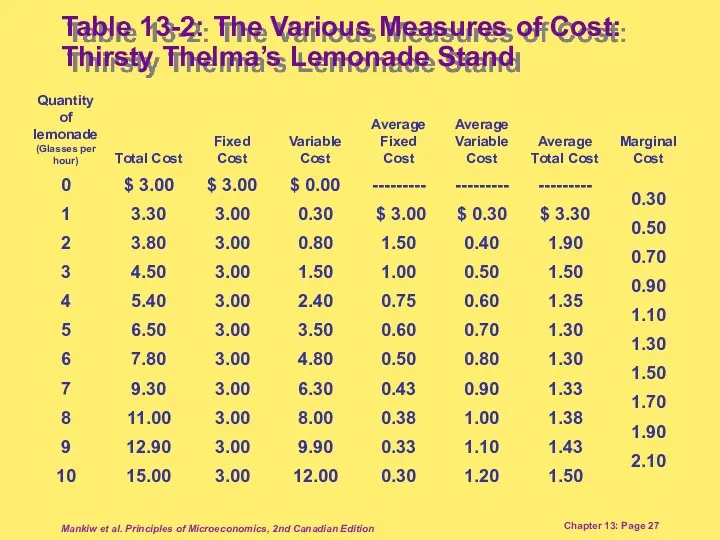
- 27. Mankiw et al. Principles of Microeconomics, 2nd Canadian Edition Chapter 13: Page Table 13-2: The Various
- 28. Mankiw et al. Principles of Microeconomics, 2nd Canadian Edition Chapter 13: Page Total Cost Quantity of
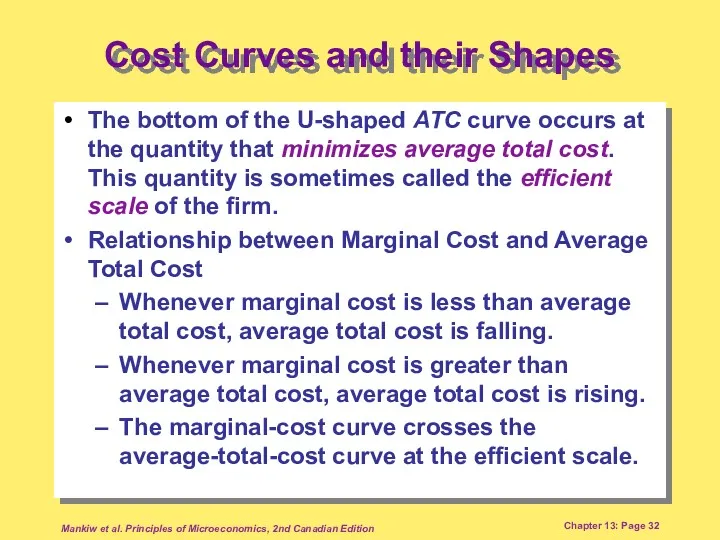
- 29. Mankiw et al. Principles of Microeconomics, 2nd Canadian Edition Chapter 13: Page Cost Curves and their
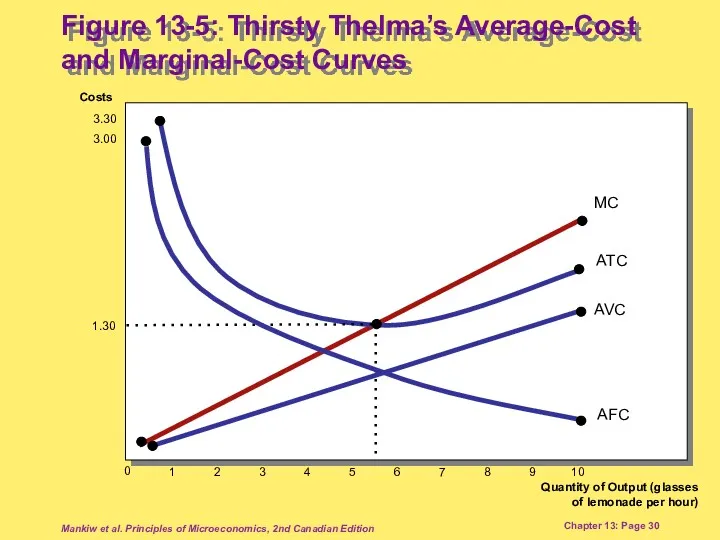
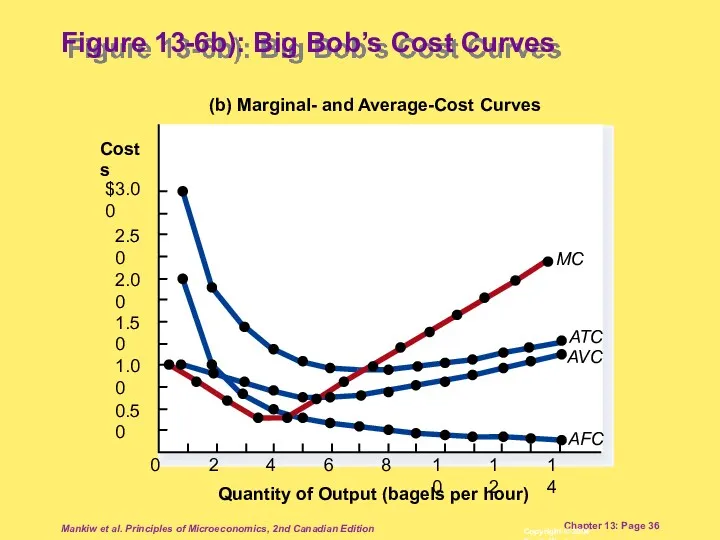
- 30. Mankiw et al. Principles of Microeconomics, 2nd Canadian Edition Chapter 13: Page Costs Quantity of Output
- 31. Mankiw et al. Principles of Microeconomics, 2nd Canadian Edition Chapter 13: Page Marginal cost rises with
- 32. Mankiw et al. Principles of Microeconomics, 2nd Canadian Edition Chapter 13: Page Cost Curves and their
- 33. Mankiw et al. Principles of Microeconomics, 2nd Canadian Edition Chapter 13: Page Typical Cost Curves In
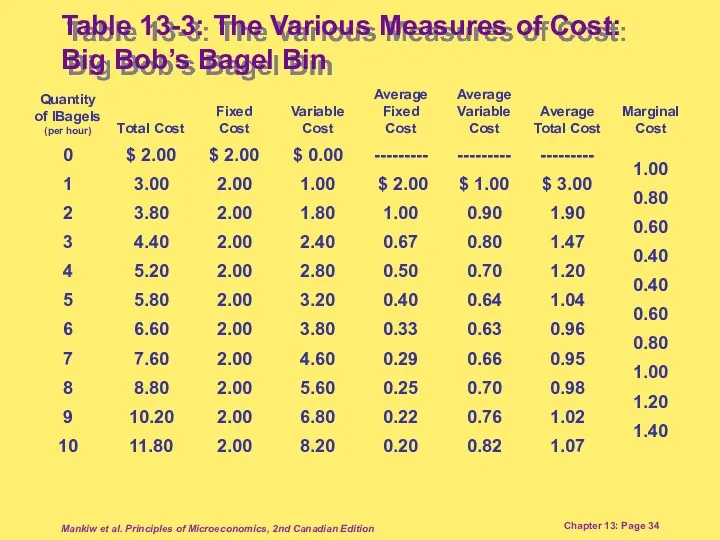
- 34. Mankiw et al. Principles of Microeconomics, 2nd Canadian Edition Chapter 13: Page Table 13-3: The Various
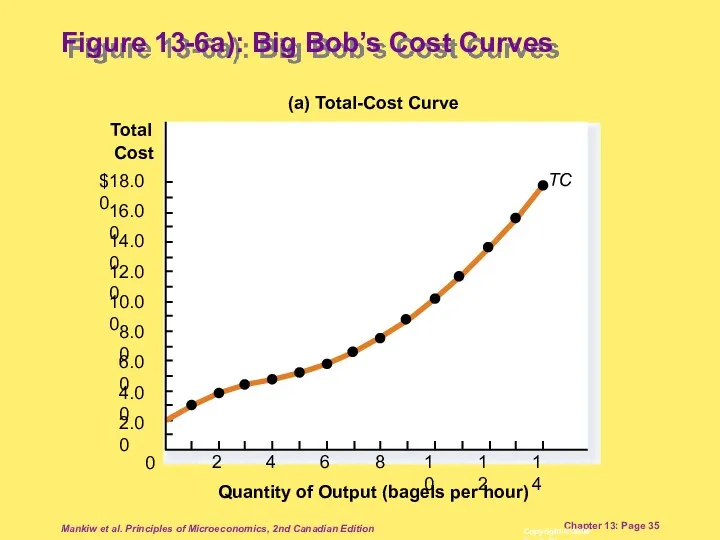
- 35. Mankiw et al. Principles of Microeconomics, 2nd Canadian Edition Chapter 13: Page Figure 13-6a): Big Bob’s
- 36. Mankiw et al. Principles of Microeconomics, 2nd Canadian Edition Chapter 13: Page Figure 13-6b): Big Bob’s
- 37. Mankiw et al. Principles of Microeconomics, 2nd Canadian Edition Chapter 13: Page Typical Cost Curves Three
- 38. Mankiw et al. Principles of Microeconomics, 2nd Canadian Edition Chapter 13: Page THE RELATIONSHIP BETWEEN THE
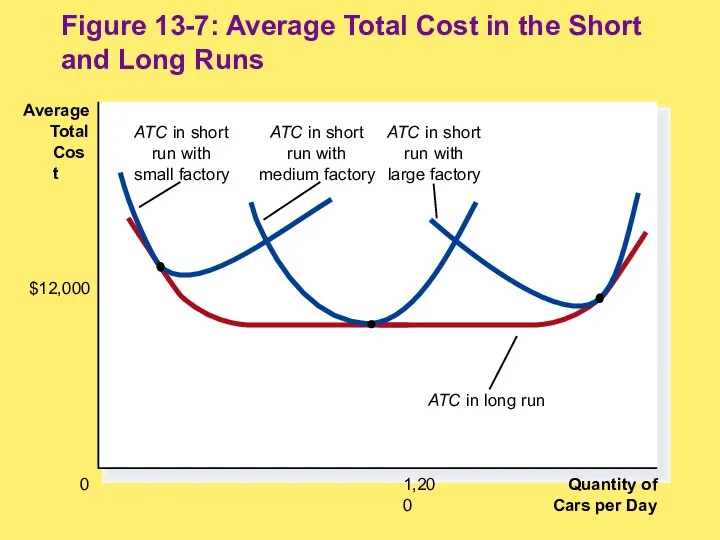
- 39. Quantity of Cars per Day 0 Average Total Cost 1,200 $12,000 Figure 13-7: Average Total Cost
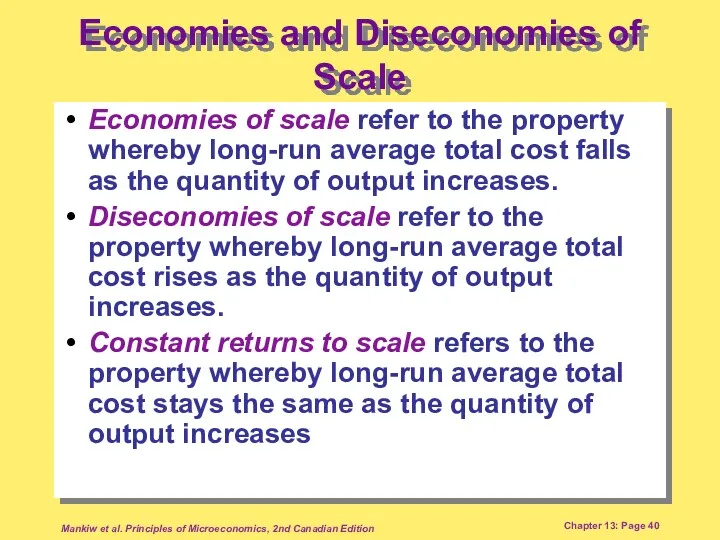
- 40. Mankiw et al. Principles of Microeconomics, 2nd Canadian Edition Chapter 13: Page Economies and Diseconomies of
- 41. Mankiw et al. Principles of Microeconomics, 2nd Canadian Edition Chapter 13: Page Summary The goal of
- 42. Mankiw et al. Principles of Microeconomics, 2nd Canadian Edition Chapter 13: Page Summary A firm’s costs
- 43. Mankiw et al. Principles of Microeconomics, 2nd Canadian Edition Chapter 13: Page Summary A firm’s total
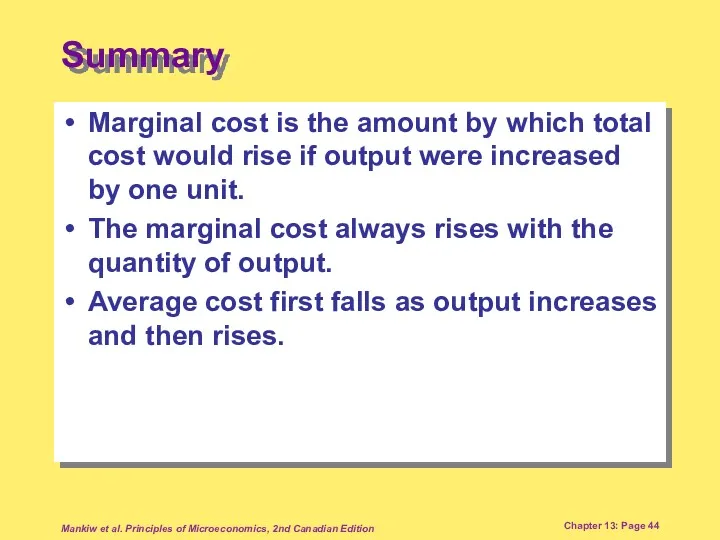
- 44. Mankiw et al. Principles of Microeconomics, 2nd Canadian Edition Chapter 13: Page Summary Marginal cost is
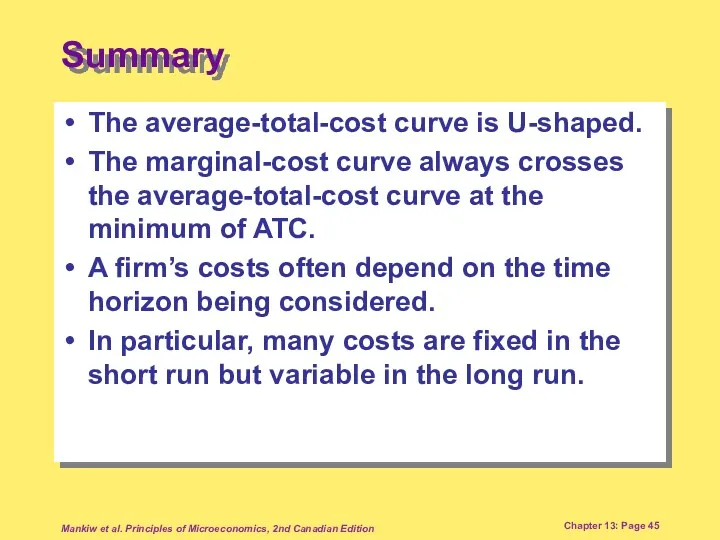
- 45. Mankiw et al. Principles of Microeconomics, 2nd Canadian Edition Chapter 13: Page Summary The average-total-cost curve
- 47. Скачать презентацию
Mankiw et al. Principles of Microeconomics, 2nd Canadian Edition
Chapter 13: Page
Mankiw et al. Principles of Microeconomics, 2nd Canadian Edition
Chapter 13: Page
Mankiw et al. Principles of Microeconomics, 2nd Canadian Edition
Chapter 13: Page
Mankiw et al. Principles of Microeconomics, 2nd Canadian Edition
Chapter 13: Page
Mankiw et al. Principles of Microeconomics, 2nd Canadian Edition
Chapter 13: Page
Mankiw et al. Principles of Microeconomics, 2nd Canadian Edition
Chapter 13: Page
Mankiw et al. Principles of Microeconomics, 2nd Canadian Edition
Chapter 13: Page
Mankiw et al. Principles of Microeconomics, 2nd Canadian Edition
Chapter 13: Page
Mankiw et al. Principles of Microeconomics, 2nd Canadian Edition
Chapter 13: Page
Mankiw et al. Principles of Microeconomics, 2nd Canadian Edition
Chapter 13: Page
Mankiw et al. Principles of Microeconomics, 2nd Canadian Edition
Chapter 13: Page
Mankiw et al. Principles of Microeconomics, 2nd Canadian Edition
Chapter 13: Page
Mankiw et al. Principles of Microeconomics, 2nd Canadian Edition
Chapter 13: Page
Mankiw et al. Principles of Microeconomics, 2nd Canadian Edition
Chapter 13: Page
Mankiw et al. Principles of Microeconomics, 2nd Canadian Edition
Chapter 13: Page
Mankiw et al. Principles of Microeconomics, 2nd Canadian Edition
Chapter 13: Page
Mankiw et al. Principles of Microeconomics, 2nd Canadian Edition
Chapter 13: Page
Mankiw et al. Principles of Microeconomics, 2nd Canadian Edition
Chapter 13: Page
Mankiw et al. Principles of Microeconomics, 2nd Canadian Edition
Chapter 13: Page
Mankiw et al. Principles of Microeconomics, 2nd Canadian Edition
Chapter 13: Page
Mankiw et al. Principles of Microeconomics, 2nd Canadian Edition
Chapter 13: Page
Mankiw et al. Principles of Microeconomics, 2nd Canadian Edition
Chapter 13: Page
Mankiw et al. Principles of Microeconomics, 2nd Canadian Edition
Chapter 13: Page
Mankiw et al. Principles of Microeconomics, 2nd Canadian Edition
Chapter 13: Page
Mankiw et al. Principles of Microeconomics, 2nd Canadian Edition
Chapter 13: Page
Mankiw et al. Principles of Microeconomics, 2nd Canadian Edition
Chapter 13: Page
Mankiw et al. Principles of Microeconomics, 2nd Canadian Edition
Chapter 13: Page
Mankiw et al. Principles of Microeconomics, 2nd Canadian Edition
Chapter 13: Page
Mankiw et al. Principles of Microeconomics, 2nd Canadian Edition
Chapter 13: Page
Mankiw et al. Principles of Microeconomics, 2nd Canadian Edition
Chapter 13: Page
Mankiw et al. Principles of Microeconomics, 2nd Canadian Edition
Chapter 13: Page
Mankiw et al. Principles of Microeconomics, 2nd Canadian Edition
Chapter 13: Page
Mankiw et al. Principles of Microeconomics, 2nd Canadian Edition
Chapter 13: Page
Mankiw et al. Principles of Microeconomics, 2nd Canadian Edition
Chapter 13: Page

Mankiw et al. Principles of Microeconomics, 2nd Canadian Edition
Chapter 13: Page
Mankiw et al. Principles of Microeconomics, 2nd Canadian Edition
Chapter 13: Page
Mankiw et al. Principles of Microeconomics, 2nd Canadian Edition
Chapter 13: Page
Mankiw et al. Principles of Microeconomics, 2nd Canadian Edition
Chapter 13: Page
Mankiw et al. Principles of Microeconomics, 2nd Canadian Edition
Chapter 13: Page
Mankiw et al. Principles of Microeconomics, 2nd Canadian Edition
Chapter 13: Page
Mankiw et al. Principles of Microeconomics, 2nd Canadian Edition
Chapter 13: Page
Mankiw et al. Principles of Microeconomics, 2nd Canadian Edition
Chapter 13: Page
Mankiw et al. Principles of Microeconomics, 2nd Canadian Edition
Chapter 13: Page
Mankiw et al. Principles of Microeconomics, 2nd Canadian Edition
Chapter 13: Page
Mankiw et al. Principles of Microeconomics, 2nd Canadian Edition
Chapter 13: Page
Mankiw et al. Principles of Microeconomics, 2nd Canadian Edition
Chapter 13: Page
Mankiw et al. Principles of Microeconomics, 2nd Canadian Edition
Chapter 13: Page
Mankiw et al. Principles of Microeconomics, 2nd Canadian Edition
Chapter 13: Page
Mankiw et al. Principles of Microeconomics, 2nd Canadian Edition
Chapter 13: Page
Mankiw et al. Principles of Microeconomics, 2nd Canadian Edition
Chapter 13: Page
Mankiw et al. Principles of Microeconomics, 2nd Canadian Edition
Chapter 13: Page
Mankiw et al. Principles of Microeconomics, 2nd Canadian Edition
Chapter 13: Page

Mankiw et al. Principles of Microeconomics, 2nd Canadian Edition
Chapter 13: Page
Mankiw et al. Principles of Microeconomics, 2nd Canadian Edition
Chapter 13: Page
Mankiw et al. Principles of Microeconomics, 2nd Canadian Edition
Chapter 13: Page
Mankiw et al. Principles of Microeconomics, 2nd Canadian Edition
Chapter 13: Page
Mankiw et al. Principles of Microeconomics, 2nd Canadian Edition
Chapter 13: Page
Mankiw et al. Principles of Microeconomics, 2nd Canadian Edition
Chapter 13: Page
Mankiw et al. Principles of Microeconomics, 2nd Canadian Edition
Chapter 13: Page
Mankiw et al. Principles of Microeconomics, 2nd Canadian Edition
Chapter 13: Page
Mankiw et al. Principles of Microeconomics, 2nd Canadian Edition
Chapter 13: Page
Mankiw et al. Principles of Microeconomics, 2nd Canadian Edition
Chapter 13: Page
Mankiw et al. Principles of Microeconomics, 2nd Canadian Edition
Chapter 13: Page
Mankiw et al. Principles of Microeconomics, 2nd Canadian Edition
Chapter 13: Page
Mankiw et al. Principles of Microeconomics, 2nd Canadian Edition
Chapter 13: Page
Mankiw et al. Principles of Microeconomics, 2nd Canadian Edition
Chapter 13: Page
Mankiw et al. Principles of Microeconomics, 2nd Canadian Edition
Chapter 13: Page
Mankiw et al. Principles of Microeconomics, 2nd Canadian Edition
Chapter 13: Page
Mankiw et al. Principles of Microeconomics, 2nd Canadian Edition
Chapter 13: Page
Mankiw et al. Principles of Microeconomics, 2nd Canadian Edition
Chapter 13: Page
Mankiw et al. Principles of Microeconomics, 2nd Canadian Edition
Chapter 13: Page
Mankiw et al. Principles of Microeconomics, 2nd Canadian Edition
Chapter 13: Page
Mankiw et al. Principles of Microeconomics, 2nd Canadian Edition
Chapter 13: Page
Mankiw et al. Principles of Microeconomics, 2nd Canadian Edition
Chapter 13: Page
Quantity of
Cars per Day
0
Average
Total
Cost
1,200
$12,000
Figure 13-7: Average Total Cost in the Short
Quantity of
Cars per Day
0
Average
Total
Cost
1,200
$12,000
Figure 13-7: Average Total Cost in the Short
Mankiw et al. Principles of Microeconomics, 2nd Canadian Edition
Chapter 13: Page
Mankiw et al. Principles of Microeconomics, 2nd Canadian Edition
Chapter 13: Page
Mankiw et al. Principles of Microeconomics, 2nd Canadian Edition
Chapter 13: Page
Mankiw et al. Principles of Microeconomics, 2nd Canadian Edition
Chapter 13: Page
Mankiw et al. Principles of Microeconomics, 2nd Canadian Edition
Chapter 13: Page
Mankiw et al. Principles of Microeconomics, 2nd Canadian Edition
Chapter 13: Page
Mankiw et al. Principles of Microeconomics, 2nd Canadian Edition
Chapter 13: Page
Mankiw et al. Principles of Microeconomics, 2nd Canadian Edition
Chapter 13: Page
Mankiw et al. Principles of Microeconomics, 2nd Canadian Edition
Chapter 13: Page
Mankiw et al. Principles of Microeconomics, 2nd Canadian Edition
Chapter 13: Page
Mankiw et al. Principles of Microeconomics, 2nd Canadian Edition
Chapter 13: Page
Mankiw et al. Principles of Microeconomics, 2nd Canadian Edition
Chapter 13: Page
 Глобальные проблемы мира и пути их решения
 Макроэкономические показатели. Тема 4
 Сибирский федеральный округ
 Традиционная аграрная экономика
 Государственный бюджет
 Развитие Дальнего Востока в первой половине XXI века
 Влияние инфляции на семейную экономику
 Перспективы североамериканской интеграции. НАФТА
 Содержание предпринимательской деятельности
 Собственность и экономические системы. (Тема 3)
 Расходы и прибыль фирмы
 Введение в микроэкономику
 Марі Еспрі Леон Вальрас
 Государственное регулирование экономики, её сущность
 bezrabotica
 Рынок капитала. Предпринимательская способность и экономическая прибыль
 Португалия
 Типы экономических систем
 Предпринимательство и фирма
 Индустрия 4.0. Четвертая промышленная революция
 Экономика. Экономические блага и ресурсы
 Фискальная(налоговобюджетная) политика государства. Тема 4
 Международные корпорации
 Социальное предпринимательство
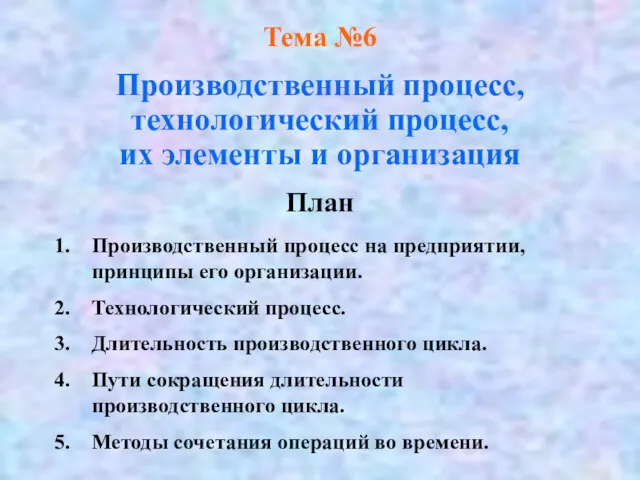 Производственный процесс, технологический процесс, их элементы и организация
 Управление затратами предприятия (на примере ООО РЕГИОН-СТРОЙ)
 Підвищення конкурнетоспроможності підприємств житлово-комунального господарства
 Кривая IS