- Forecasting Free Cash Flow of an Industrial Enterprise Using Fuzzy Set Tools

Содержание
- 2. The problem of forecasting companies’ cash flows is important in the growing uncertainty of the business
- 3. Methods of Cash Flow Forecasting
- 4. Revenues as a Key Element to be Forecasted Revenues generated by various centers of financial responsibilities
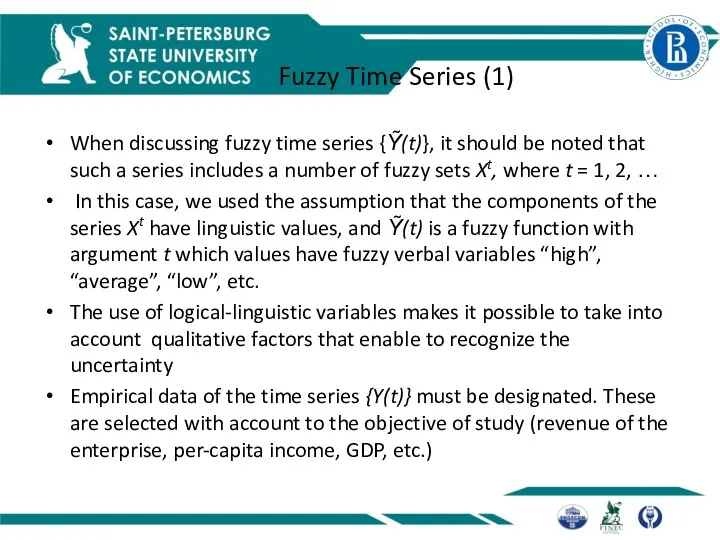
- 5. Fuzzy Time Series (1) When discussing fuzzy time series {Ỹ(t)}, it should be noted that such
- 6. Fuzzy Time Series (2) By studying a time series in a fuzzy dynamic environment one is
- 7. Stages for forecasting with Fussy Time Series (1)
- 8. Stages for forecasting with Fuzzy Time Series (2) At the first stage, the boundaries of the
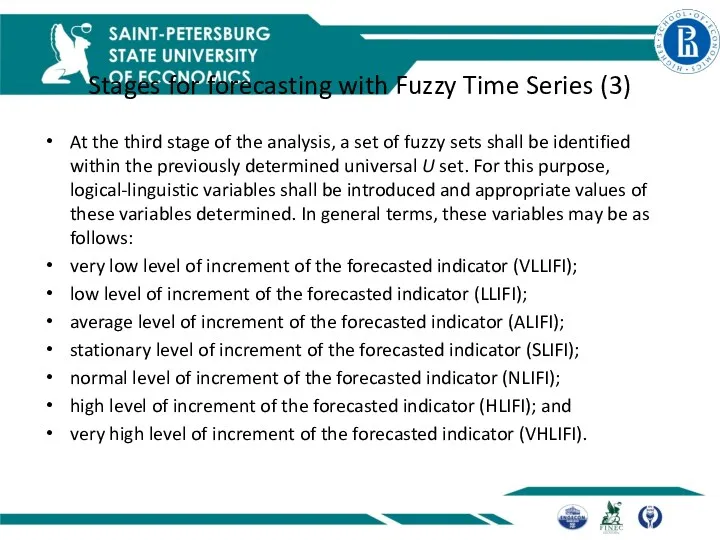
- 9. Stages for forecasting with Fuzzy Time Series (3) At the third stage of the analysis, a
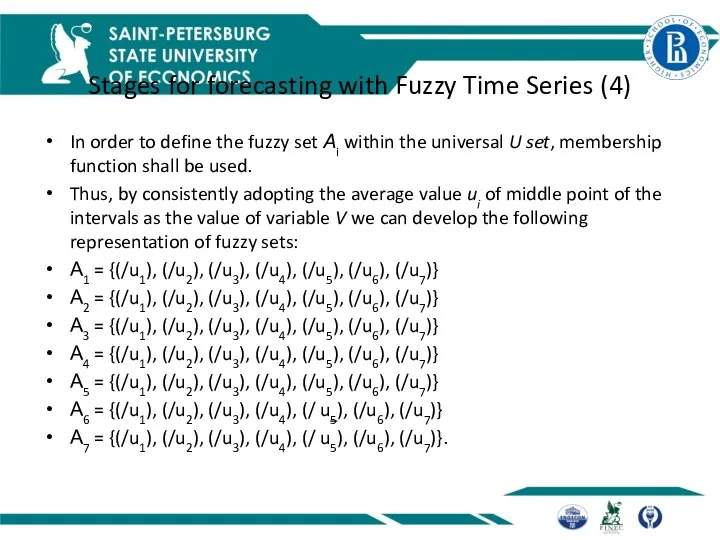
- 10. Stages for forecasting with Fuzzy Time Series (4) In order to define the fuzzy set Аi
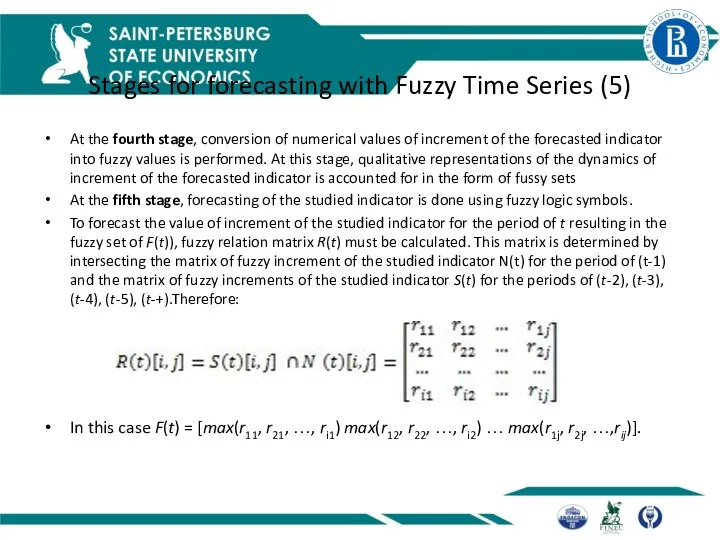
- 11. Stages for forecasting with Fuzzy Time Series (5) At the fourth stage, conversion of numerical values
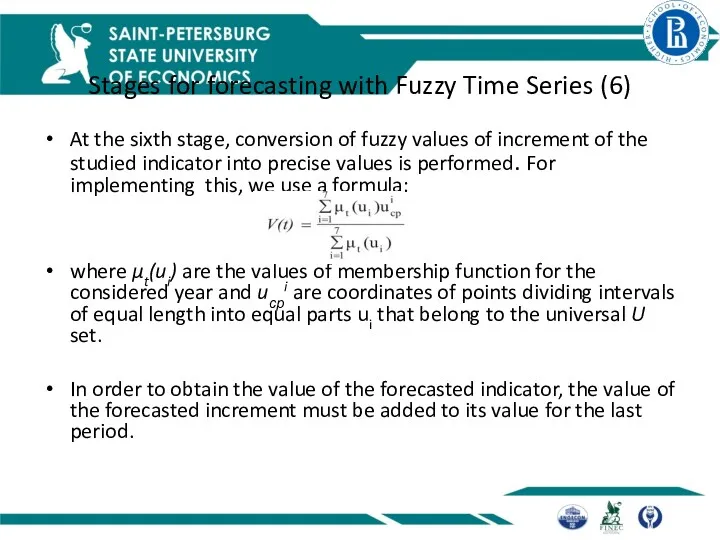
- 12. Stages for forecasting with Fuzzy Time Series (6) At the sixth stage, conversion of fuzzy values
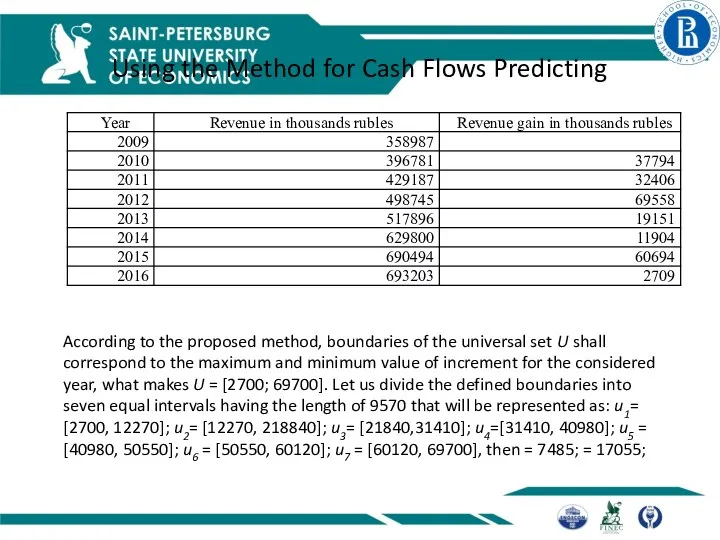
- 13. Using the Method for Cash Flows Predicting According to the proposed method, boundaries of the universal
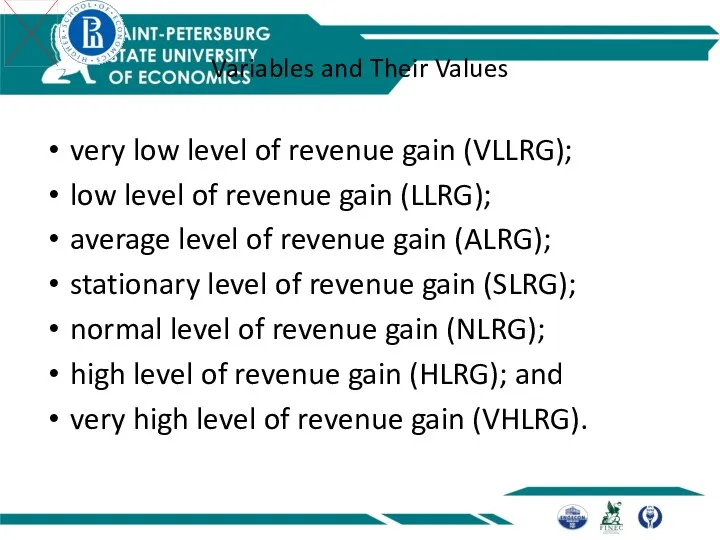
- 14. Variables and Their Values very low level of revenue gain (VLLRG); low level of revenue gain
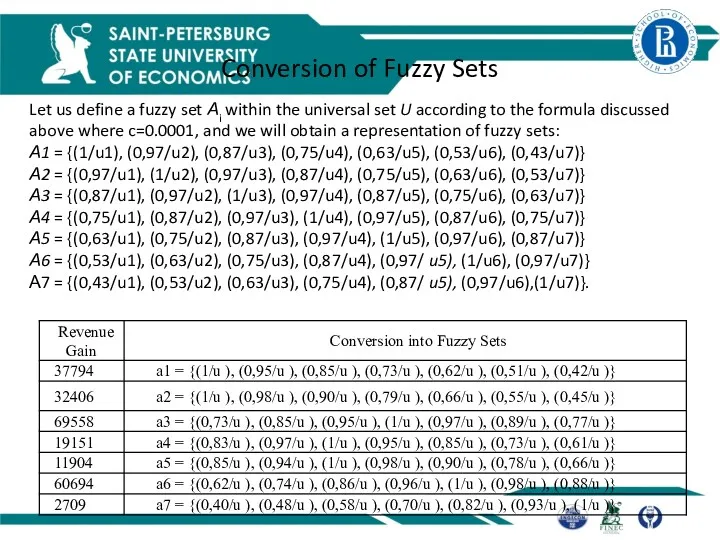
- 15. Conversion of Fuzzy Sets Let us define a fuzzy set Аi within the universal set U
- 17. Revenues Forecasting
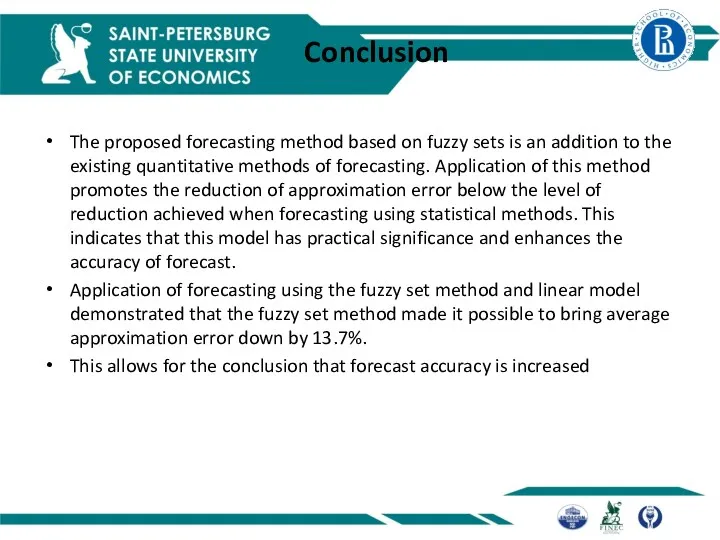
- 18. Conclusion The proposed forecasting method based on fuzzy sets is an addition to the existing quantitative
- 20. Скачать презентацию
The problem of forecasting companies’ cash flows is important in the
The problem of forecasting companies’ cash flows is important in the
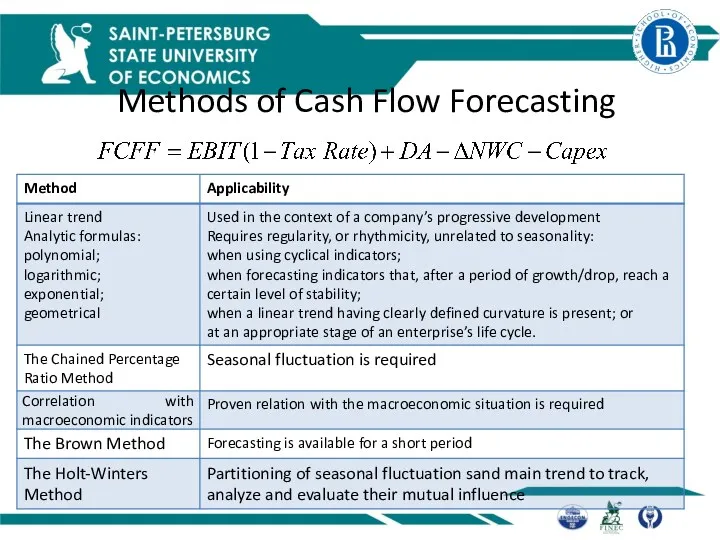
Methods of Cash Flow Forecasting
Methods of Cash Flow Forecasting
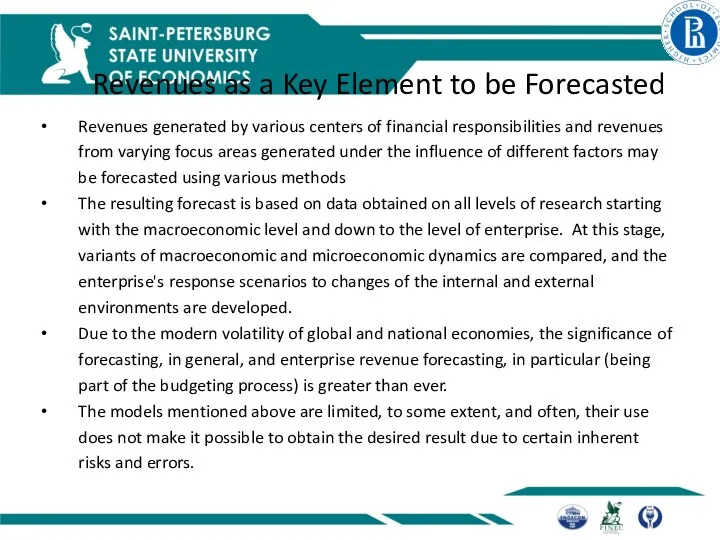
Revenues as a Key Element to be Forecasted
Revenues generated by various
Revenues as a Key Element to be Forecasted
Revenues generated by various
Fuzzy Time Series (1)
When discussing fuzzy time series {Ỹ(t)}, it should
Fuzzy Time Series (1)
When discussing fuzzy time series {Ỹ(t)}, it should
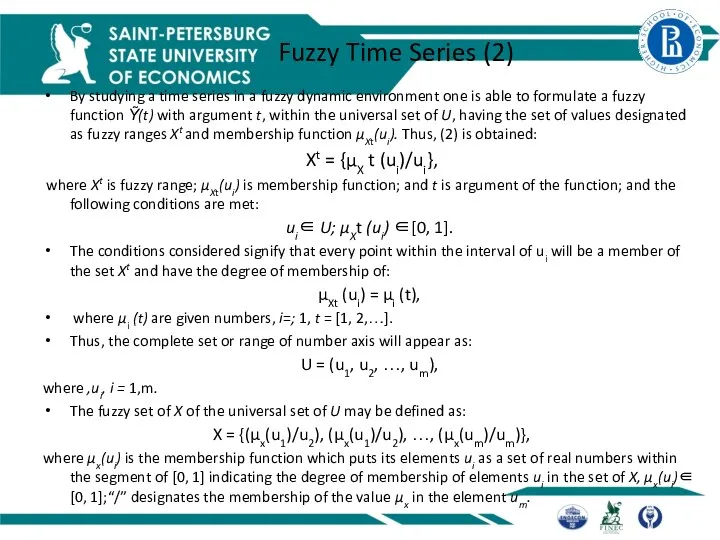
Fuzzy Time Series (2)
By studying a time series in a fuzzy
Fuzzy Time Series (2)
By studying a time series in a fuzzy

Stages for forecasting with Fussy Time Series (1)
Stages for forecasting with Fussy Time Series (1)
Stages for forecasting with Fuzzy Time Series (2)
At the first stage,
Stages for forecasting with Fuzzy Time Series (2)
At the first stage,
Stages for forecasting with Fuzzy Time Series (3)
At the third stage
Stages for forecasting with Fuzzy Time Series (3)
At the third stage
Stages for forecasting with Fuzzy Time Series (4)
In order to define
Stages for forecasting with Fuzzy Time Series (4)
In order to define
Stages for forecasting with Fuzzy Time Series (5)
At the fourth stage,
Stages for forecasting with Fuzzy Time Series (5)
At the fourth stage,
Stages for forecasting with Fuzzy Time Series (6)
At the sixth stage,
Stages for forecasting with Fuzzy Time Series (6)
At the sixth stage,
Using the Method for Cash Flows Predicting
According to the proposed method,
Using the Method for Cash Flows Predicting
According to the proposed method,
Variables and Their Values
very low level of revenue gain (VLLRG);
low level
Variables and Their Values
very low level of revenue gain (VLLRG);
low level
Conversion of Fuzzy Sets
Let us define a fuzzy set Аi within
Conversion of Fuzzy Sets
Let us define a fuzzy set Аi within
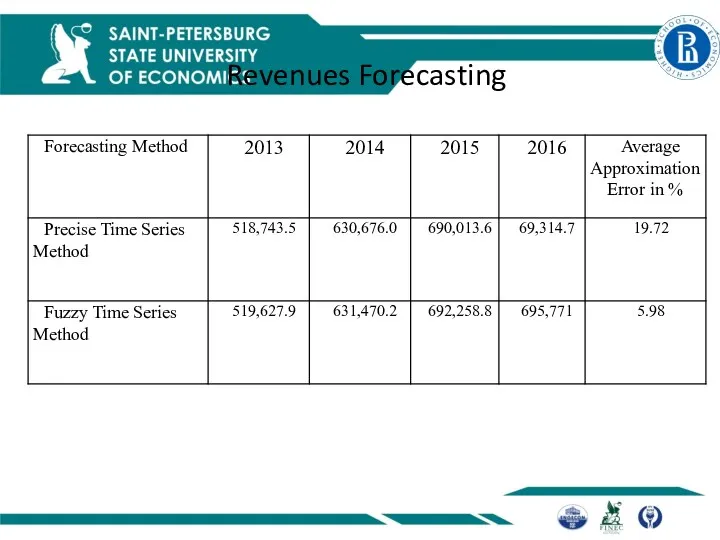
Revenues Forecasting
Revenues Forecasting
Conclusion
The proposed forecasting method based on fuzzy sets is an addition
Conclusion
The proposed forecasting method based on fuzzy sets is an addition
 Өндірістін тиімділігін жене табыстылыгын аныктайтын шығындар
 Оценка потенциальных возможностей компании по освоению внешнего рынка
 Земельные ресурсы
 Национальное богатство
 Міжнародні товарні ринки
 Теория фирмы. Продолжение
 Введение в макроэкономику. Макроэкономические показатели. Макроэкономика и ее основные проблемы
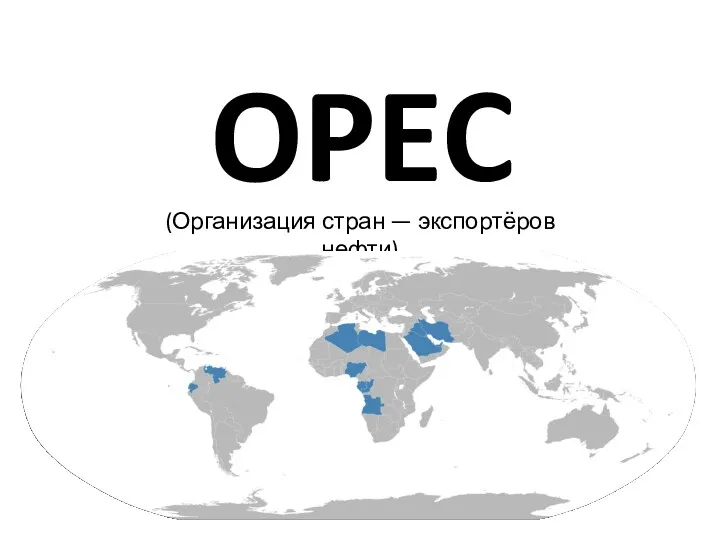 Организация стран — экспортёров нефти (OPEC)
 Теневая экономика в России
 Глобальные проблемы
 Анализ вероятности банкротства организации. Анализ предпринимательского риска
 Глобальные проблемы в мировой экономике
 Кейнсианская теория денег
 АСЕАН - история создания, цели, задачи, членство, результаты деятельности
 Экономическая оценка природных ресурсов
 Денежно-кредитная политика
 Экономическая конкуренция
 Социально-экономическая статистика
 Ризик-менеджмент фінансової стійкості соціально-економічної регіональної системи в контексті Програми діяльності Кабінету Міністрів Ук
 Шерінгова економіка
 Економіка і соціологія праці
 Индикаторы устойчивого развития
 Роль и функции цен в рыночной экономике
 Группа компаний Р-ФАРМ. Инновационные технологии здоровья
 Тезисы стратегии социально-экономического развития Калужской области до 2040 года
 Прогнозирование. Классификация экономического прогнозирования
 Экономические системы. Рыночная экономика и ее модели
 Экономика и экология: новые модели развития