- Macroeconomic Indicators: What They Are & How to Use Them

Содержание
- 2. Macroeconomic Indicators Production: GDP, GNP, NI Business Cycles Inflation Unemployment Interest Rates
- 3. Quantity Aggregates To understand the macroeconomy, we need to measure it. Chief measure of economy is
- 4. Gross Domestic Product (GDP) GDP is the sum of the value of new, final goods produced
- 5. Three Methods for Calculating GDP Expenditure Method - The sum of the domestic spending on final
- 6. Expenditure Method
- 7. Japanese Expenditure
- 8. GNP vs. GDP Net Factor Income [NFI] is income earned on overseas work or investments minus
- 9. Compare Macau and the Philippines GDP or GNP Macau produces a lot of profits paid to
- 10. The main macroeconomic issues: Inflation. Employment and unemployment. Stagflation and deflation. Business cycles. Economic growth. The
- 11. 1. Inflation Inflation is the increase of prices over the period of time
- 12. Why prices increase? Demand-pull inflation – this occurs when aggregate demand (AD) will be increasing faster
- 13. Types of inflation by rate of increase Creeping inflation (1-4%) When the rate of inflation slowly
- 15. Comparing GDP levels across time GDP measures the value of the goods produced by an economy
- 16. Real GDP: Yt GDP or Nominal GDP or Current Dollar GDP is the weighted sum of
- 17. Solved Problem Real GDP: 2021 (2020 Base Year)
- 19. Price Indices: Pt Two most commonly used price indices are GDP Deflator and Consumer Price Index
- 20. Consumer Price Index The CPI is the price of a representative market basket of goods relative
- 21. Q: What is Inflation? A: The Growth Rate of Price Level Inflation: prices are growing Disinflation:
- 22. Adjusting for Inflation We can use some price index to “adjust for inflation” effectively converting a
- 23. Converting Current Price Series into Constant Price Series Series to be adjusted for inflation: Nt Contemporaneous
- 24. Housing Price: Hong Kong Island Compare the price of housing in HK average price of an
- 25. Housing Price: Hong Kong Island The Hong Kong CPI (2000=100) was 35.5 in December 1982 and
- 26. Example Compare the box office take of “Shrek 2” and “Sound of Music” in 2004 dollars.
- 27. Interest Rates
- 28. What are some major interest rates in financial markets? Be as specific as possible.
- 29. Nominal and Real Interest Rates Nominal return represents how much money you will receive after 1
- 30. Imagine a 1 year loan [T =1]: The lender gives up some goods to make a
- 31. Real Interest Rate The real interest rate on the loan is defined as the future goods
- 32. Ex Ante Rate and the Fisher Effect Savings and investment decisions must be made before future
- 33. Economic growth
- 34. Recessions and Expansions Business cycle positions are sometimes characterized as booms and recessions. These names have
- 37. Stock Market tends to co-move positively with the business cycle.
- 40. Скачать презентацию
Macroeconomic Indicators
Production: GDP, GNP, NI
Business Cycles
Inflation
Unemployment
Interest Rates
Macroeconomic Indicators
Production: GDP, GNP, NI
Business Cycles
Inflation
Unemployment
Interest Rates
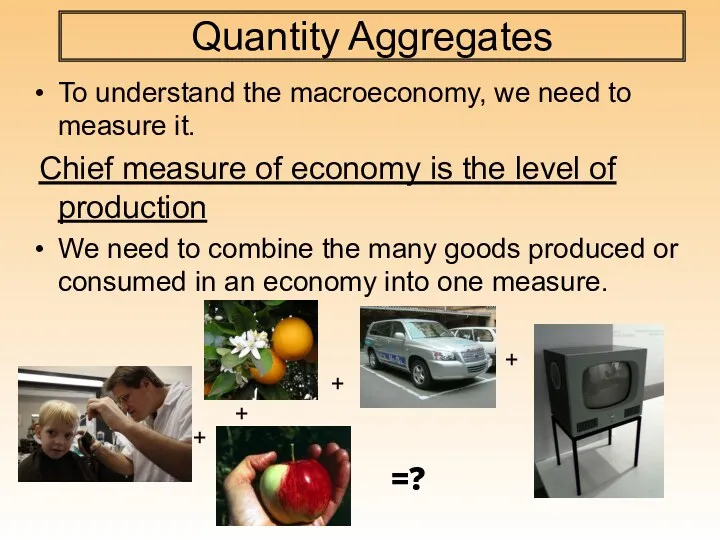
Quantity Aggregates
To understand the macroeconomy, we need to measure it.
Quantity Aggregates
To understand the macroeconomy, we need to measure it.
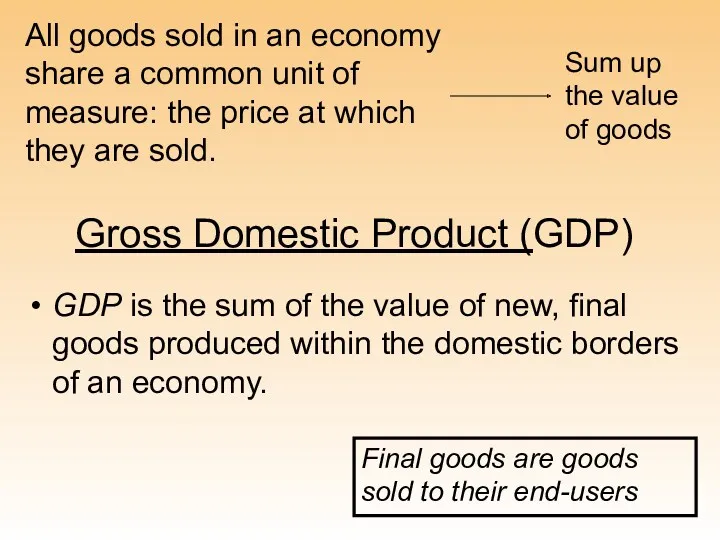
Gross Domestic Product (GDP)
GDP is the sum of the value of
Gross Domestic Product (GDP)
GDP is the sum of the value of
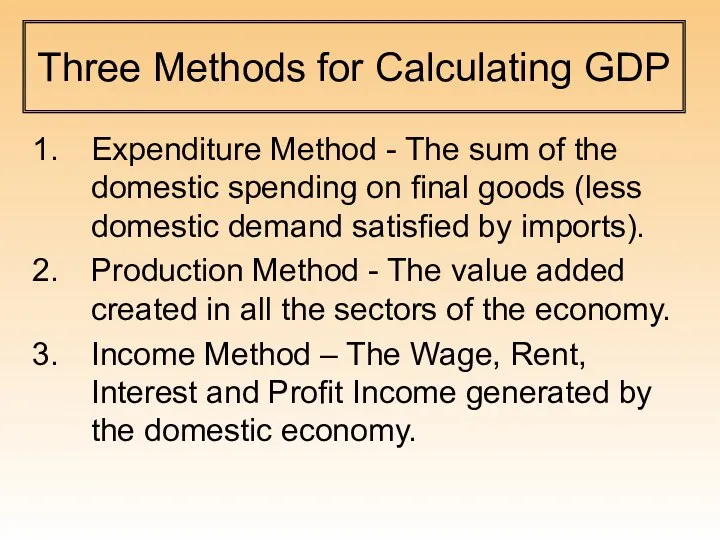
Three Methods for Calculating GDP
Expenditure Method - The sum of the
Three Methods for Calculating GDP
Expenditure Method - The sum of the
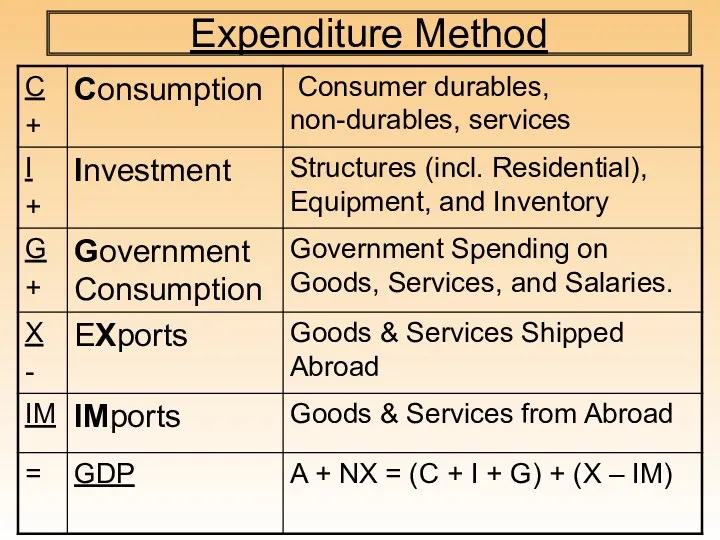
Expenditure Method
Expenditure Method
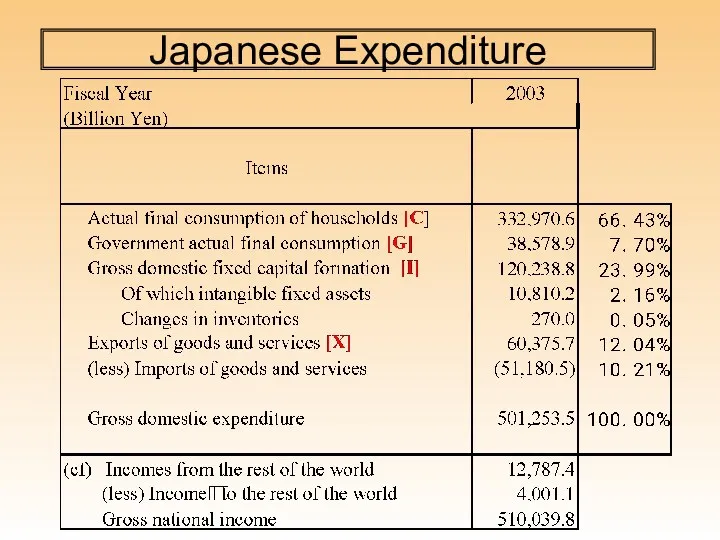
Japanese Expenditure
Japanese Expenditure
![GNP vs. GDP Net Factor Income [NFI] is income earned](/_ipx/f_webp&q_80&fit_contain&s_1440x1080/imagesDir/jpg/612511/slide-7.jpg)
GNP vs. GDP
Net Factor Income [NFI] is income earned on overseas
GNP vs. GDP
Net Factor Income [NFI] is income earned on overseas
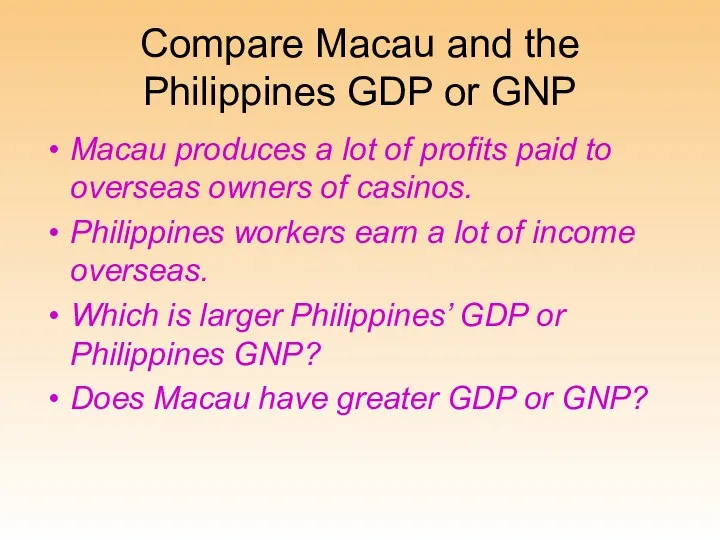
Compare Macau and the Philippines GDP or GNP
Macau produces a lot
Compare Macau and the Philippines GDP or GNP
Macau produces a lot
The main macroeconomic issues:
Inflation.
Employment and unemployment.
Stagflation and deflation.
Business cycles.
Economic growth.
The balance
The main macroeconomic issues:
Inflation.
Employment and unemployment.
Stagflation and deflation.
Business cycles.
Economic growth.
The balance
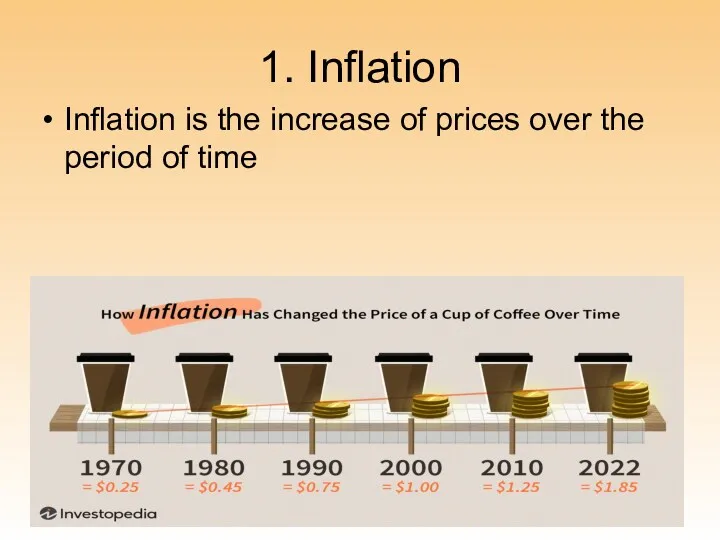
1. Inflation
Inflation is the increase of prices over the period of
1. Inflation
Inflation is the increase of prices over the period of
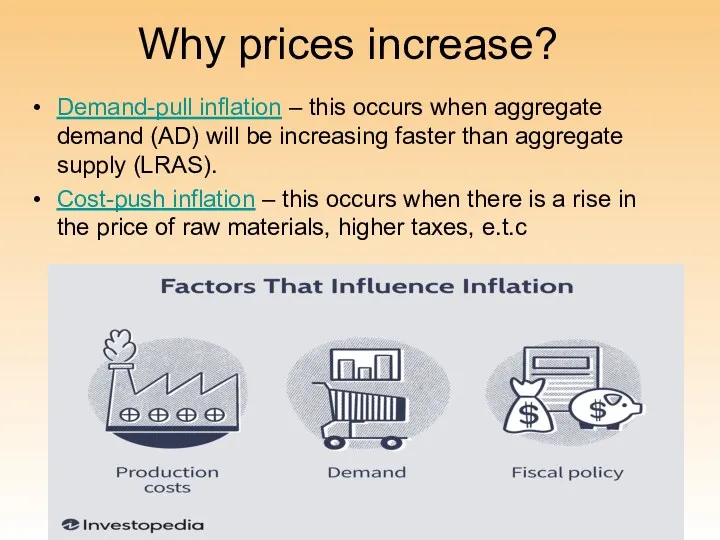
Why prices increase?
Demand-pull inflation – this occurs when aggregate demand (AD) will
Why prices increase?
Demand-pull inflation – this occurs when aggregate demand (AD) will
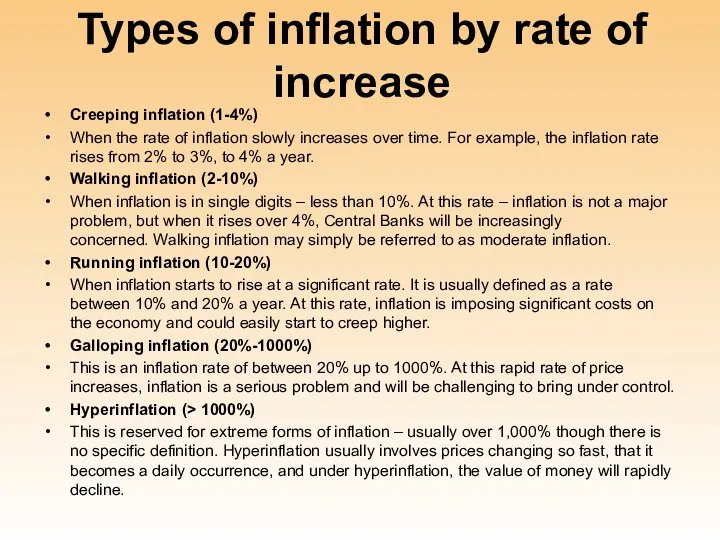
Types of inflation by rate of increase
Creeping inflation (1-4%)
When the rate
Types of inflation by rate of increase
Creeping inflation (1-4%)
When the rate
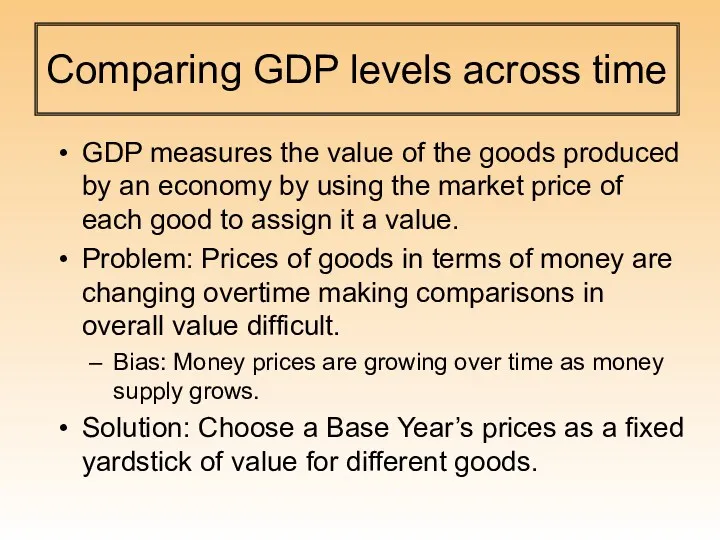
Comparing GDP levels across time
GDP measures the value of the goods
Comparing GDP levels across time
GDP measures the value of the goods
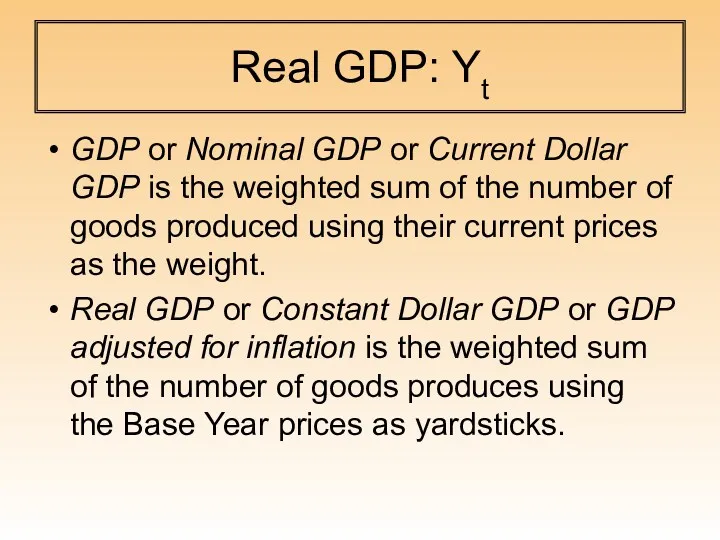
Real GDP: Yt
GDP or Nominal GDP or Current Dollar GDP is
Real GDP: Yt
GDP or Nominal GDP or Current Dollar GDP is
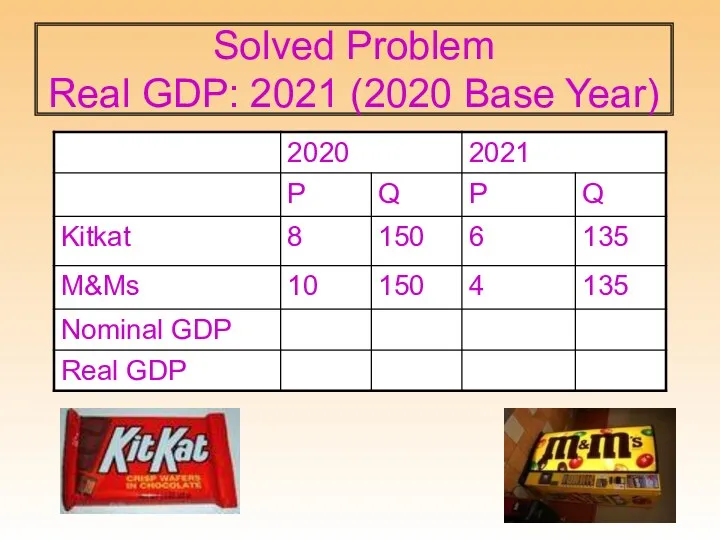
Solved Problem
Real GDP: 2021 (2020 Base Year)
Solved Problem
Real GDP: 2021 (2020 Base Year)

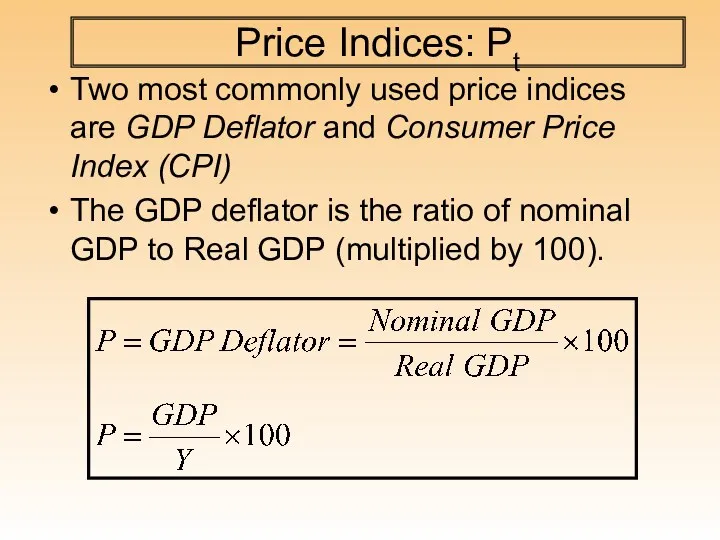
Price Indices: Pt
Two most commonly used price indices are GDP Deflator
Price Indices: Pt
Two most commonly used price indices are GDP Deflator
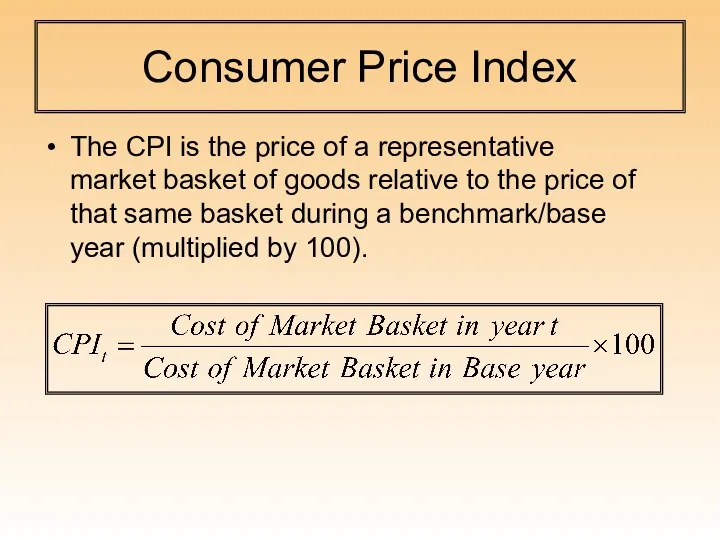
Consumer Price Index
The CPI is the price of a representative market
Consumer Price Index
The CPI is the price of a representative market
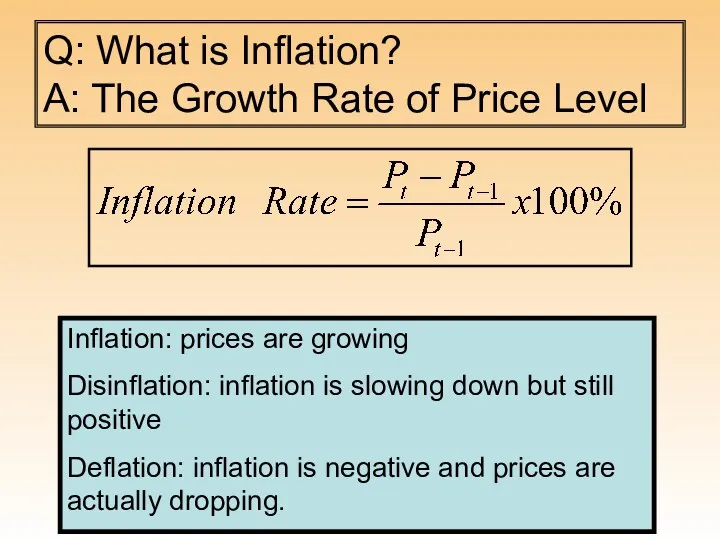
Q: What is Inflation?
A: The Growth Rate of Price Level
Inflation: prices
Q: What is Inflation?
A: The Growth Rate of Price Level
Inflation: prices
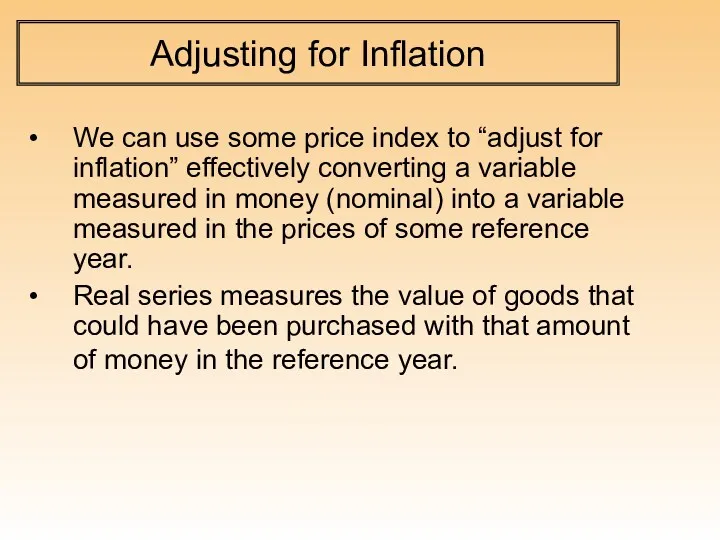
Adjusting for Inflation
We can use some price index to “adjust for
Adjusting for Inflation
We can use some price index to “adjust for
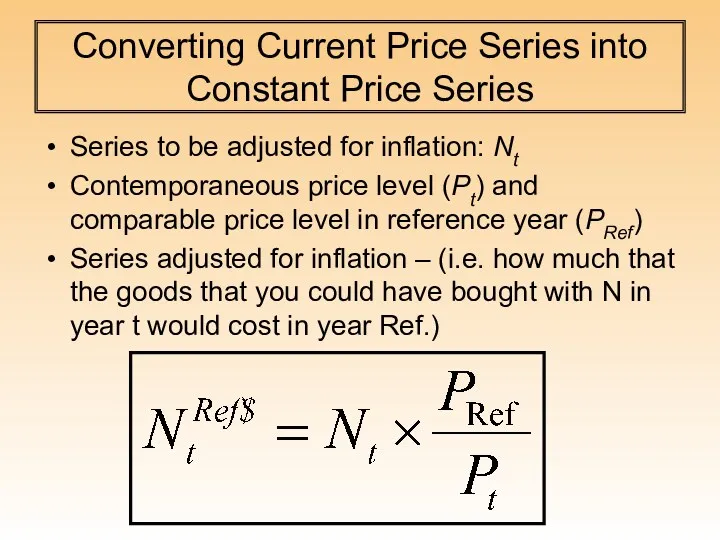
Converting Current Price Series into Constant Price Series
Series to be adjusted
Converting Current Price Series into Constant Price Series
Series to be adjusted
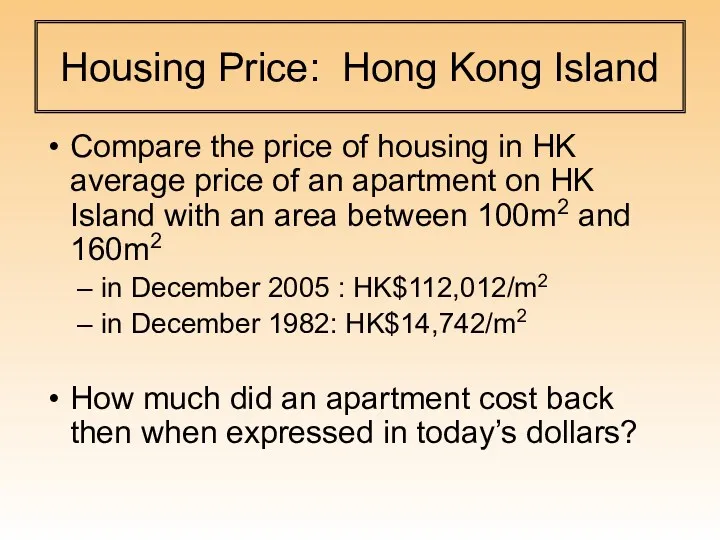
Housing Price: Hong Kong Island
Compare the price of housing in HK
Housing Price: Hong Kong Island
Compare the price of housing in HK
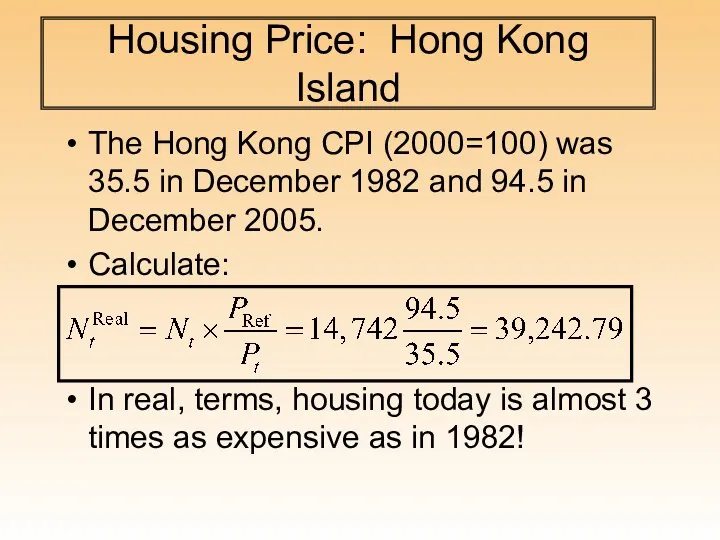
Housing Price: Hong Kong Island
The Hong Kong CPI (2000=100) was 35.5
Housing Price: Hong Kong Island
The Hong Kong CPI (2000=100) was 35.5
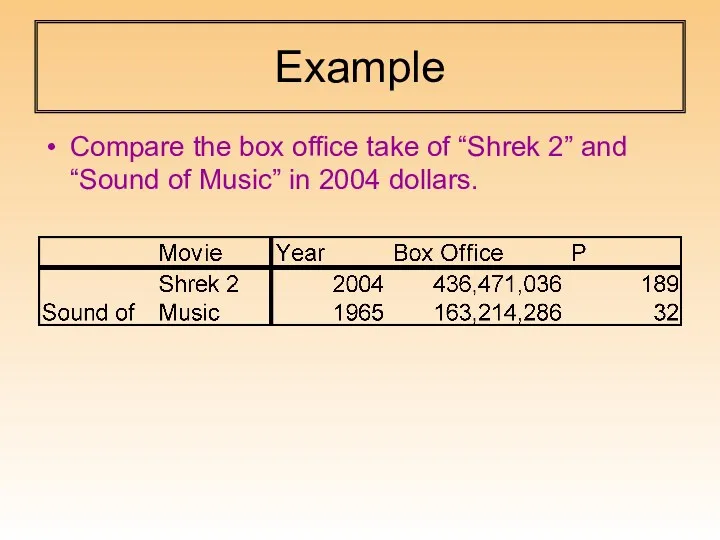
Example
Compare the box office take of “Shrek 2” and “Sound of
Example
Compare the box office take of “Shrek 2” and “Sound of
Interest Rates
Interest Rates
What are some major interest rates in financial markets? Be as
What are some major interest rates in financial markets? Be as
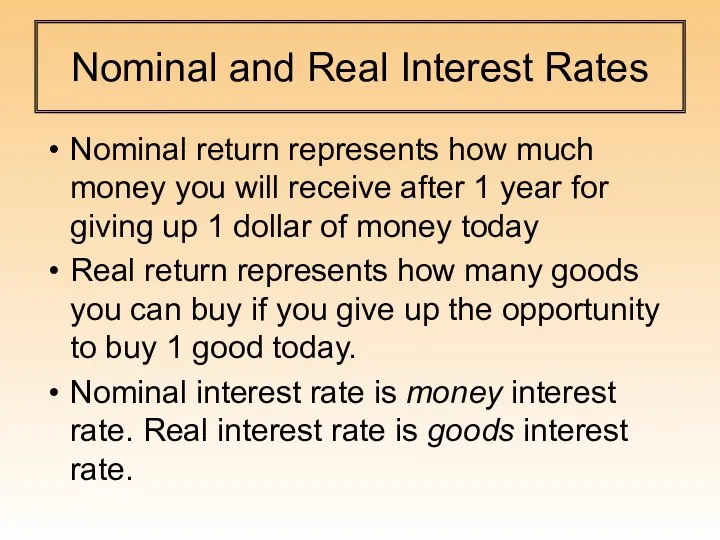
Nominal and Real Interest Rates
Nominal return represents how much money you
Nominal and Real Interest Rates
Nominal return represents how much money you
![Imagine a 1 year loan [T =1]: The lender gives](/_ipx/f_webp&q_80&fit_contain&s_1440x1080/imagesDir/jpg/612511/slide-29.jpg)
Imagine a 1 year loan [T =1]: The lender gives up
Imagine a 1 year loan [T =1]: The lender gives up
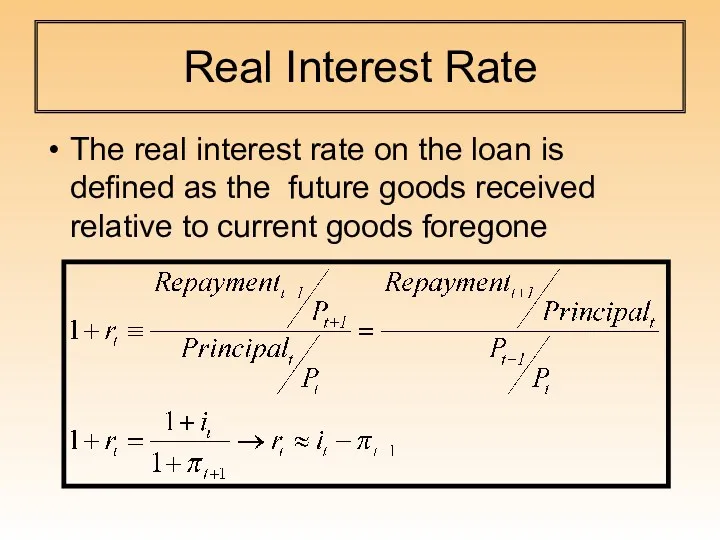
Real Interest Rate
The real interest rate on the loan is defined
Real Interest Rate
The real interest rate on the loan is defined
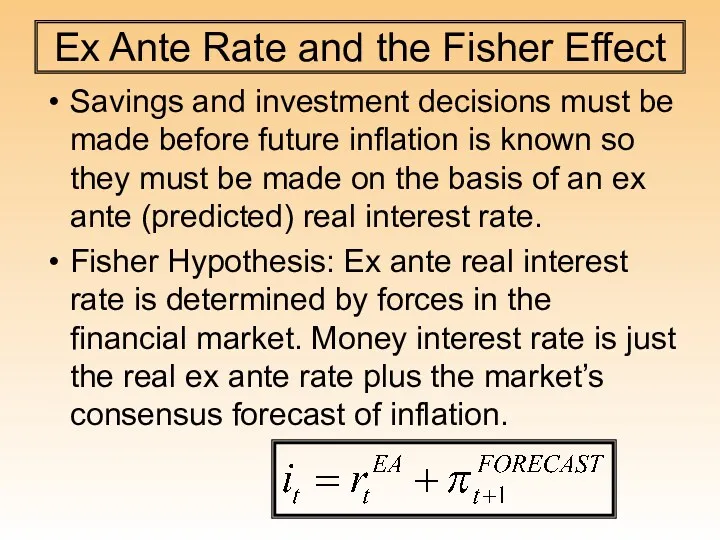
Ex Ante Rate and the Fisher Effect
Savings and investment decisions must
Ex Ante Rate and the Fisher Effect
Savings and investment decisions must
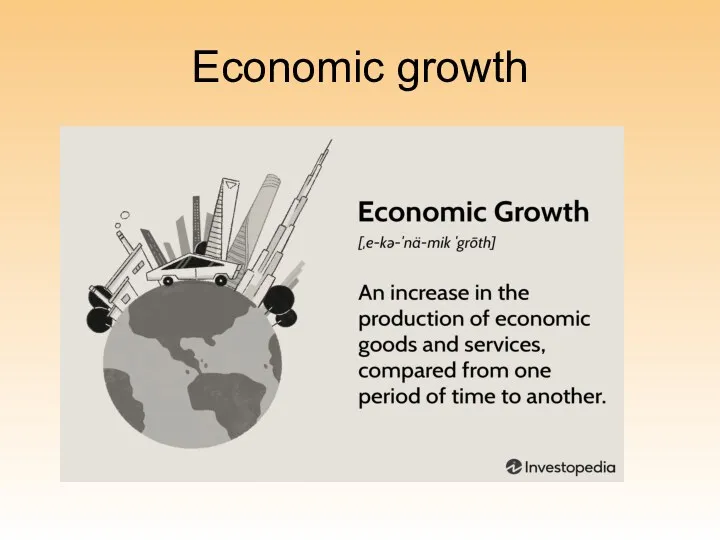
Economic growth
Economic growth
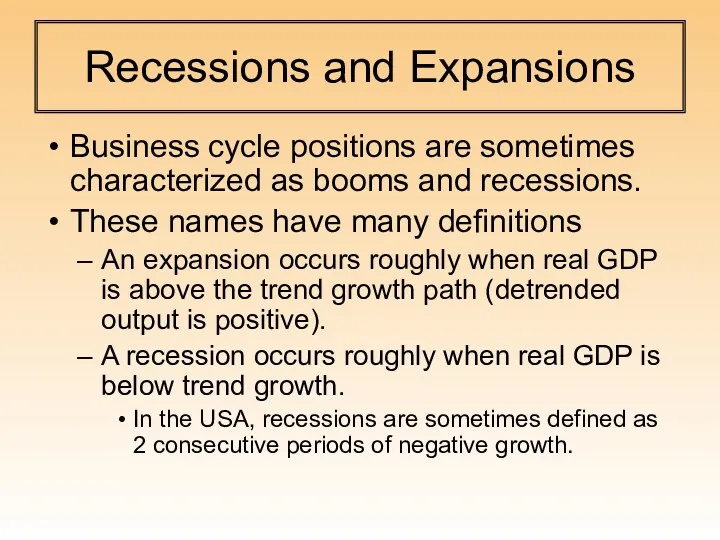
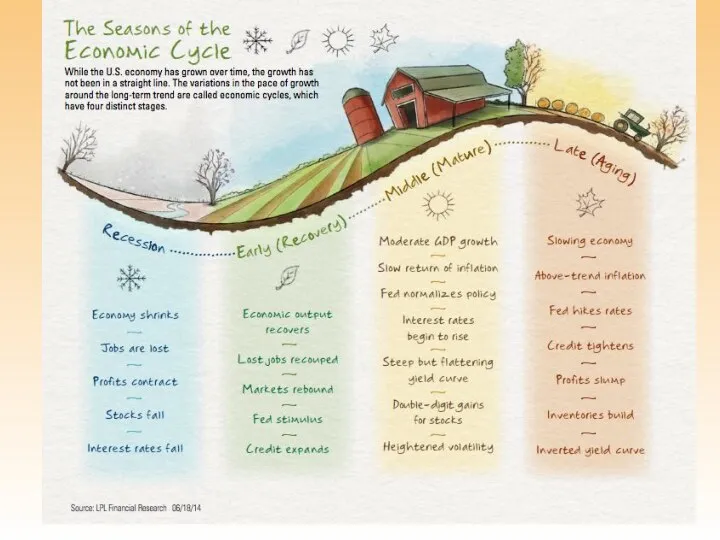
Recessions and Expansions
Business cycle positions are sometimes characterized as booms and
Recessions and Expansions
Business cycle positions are sometimes characterized as booms and
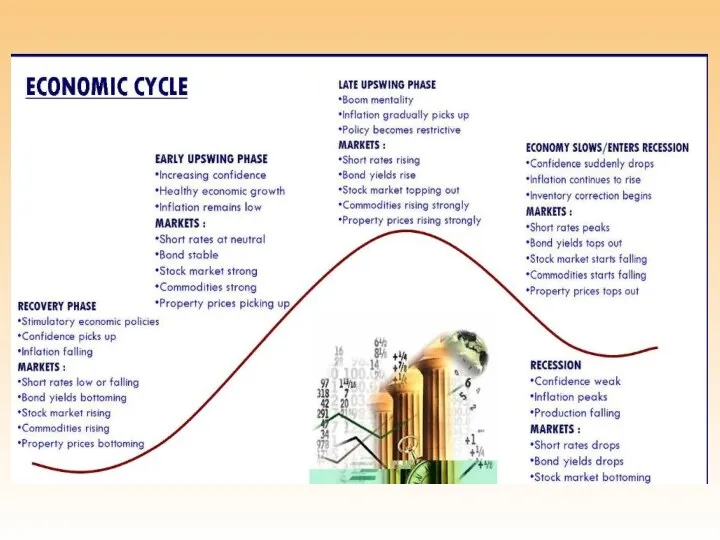
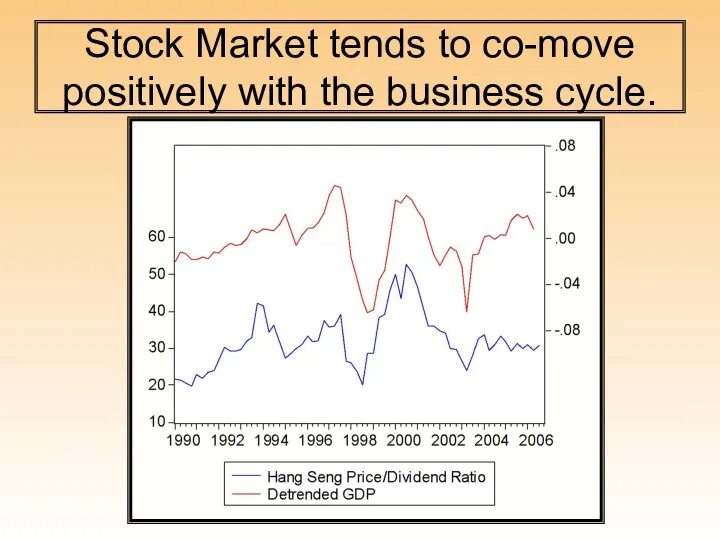
Stock Market tends to co-move positively with the business cycle.
Stock Market tends to co-move positively with the business cycle.
 Рынок недвижимости в стране Япония
 Заработная плата, как экономическая категория
 Система оценки качества продукции в производстве
 Лесное хозяйство. Охота
 Что такое заработная плата и от чего она зависит
 Вход, выход и формирование рынков. Концепции современной теории отраслевых рынков
 Экономическая география, как наука
 Цели устойчивого развития в Беларуси
 Управление затратами и ценообразование в инновационной сфере
 Экономическая социология
 Организационная структура ПАО Иркутскэнерго и ООО Иркутскэнергосбыт
 Економічна характеристика Південної Кореї
 Автоматизированные системы контроля и учета электроэнергии
 Макроэкономикалық көрсеткіш
 Национальная экономика. Основные результаты и их измерение
 Многообразие рынков. Признаки и функции рынка
 Метод функционально-стоимостного анализа (ФСА)
 Планирование деятельности компаний-участников международного бизнеса. (Тема 6)
 Финансовые рынки
 Основы моделирования социально-экономических процессов
 Развитие экологического туризма в Республике Казахстан
 Максимизация прибыли и ценовая дискриминация
 Семейный бюджет
 Конкуренция и монополия
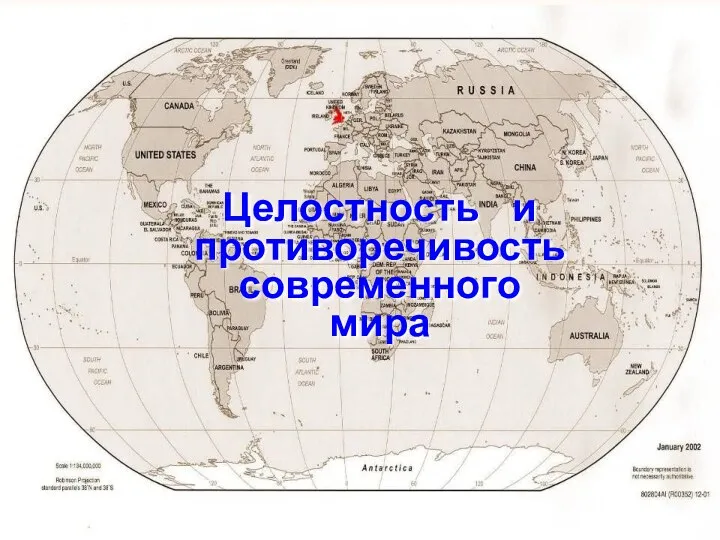 Целостность и противоречивость современного мира
 Инфляция и ее измерение
 Економічна система суспільства
 Государственное регулирование ВЭД