- Measuring a Nation’s Income. Chapter 23

Содержание
- 2. Microeconomics Microeconomics is the study of how individual households and firms make decisions and how they
- 3. Macroeconomics Macroeconomics is the study of the economy as a whole. Its goal is to explain
- 4. Macroeconomics Macroeconomics answers questions like the following: Why is average income high in some countries and
- 5. The Economy’s Income and Expenditure When judging whether the economy is doing well or poorly, it
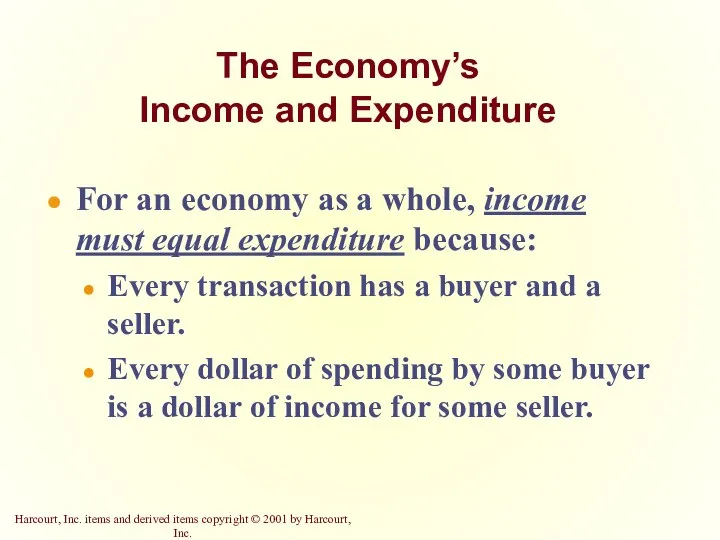
- 6. The Economy’s Income and Expenditure For an economy as a whole, income must equal expenditure because:
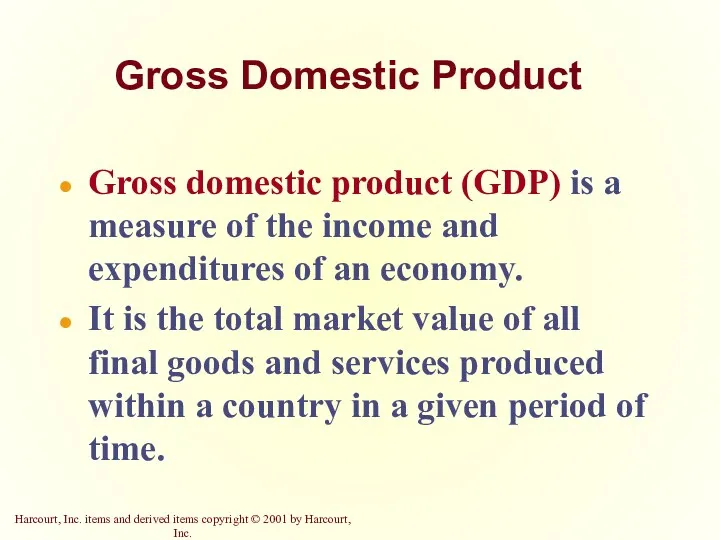
- 7. Gross domestic product (GDP) is a measure of the income and expenditures of an economy. It
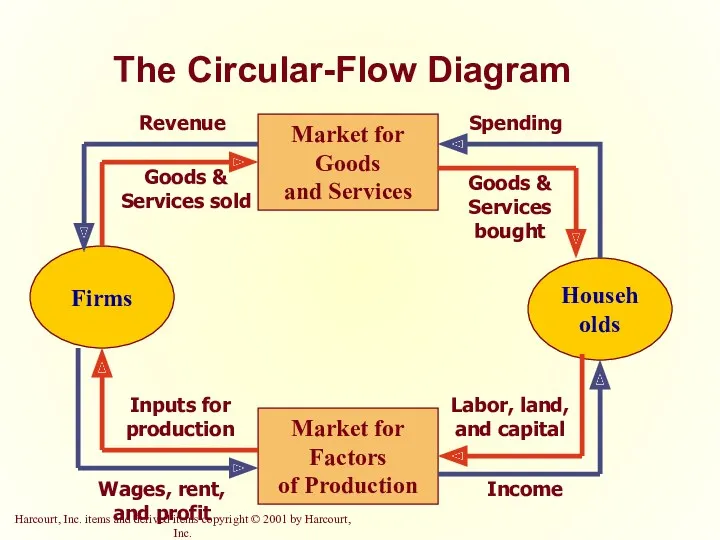
- 8. The Circular-Flow Diagram The equality of income and expenditure can be illustrated with the circular-flow diagram.
- 9. The Circular-Flow Diagram Firms Households Market for Factors of Production Market for Goods and Services
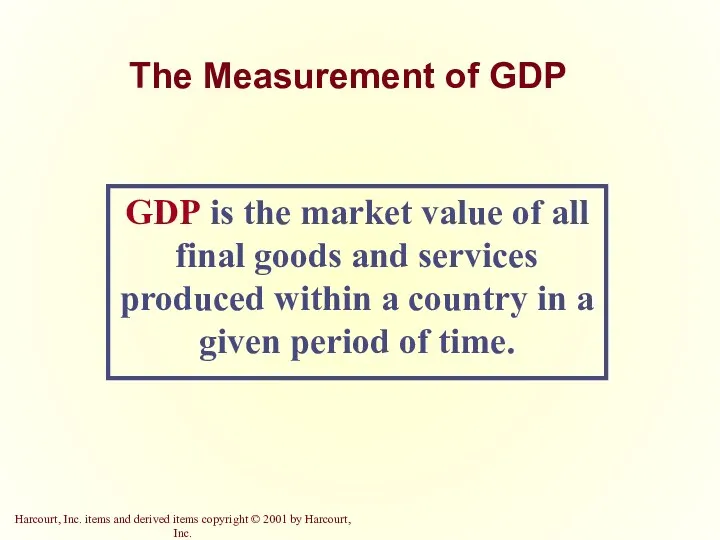
- 10. The Measurement of GDP GDP is the market value of all final goods and services produced
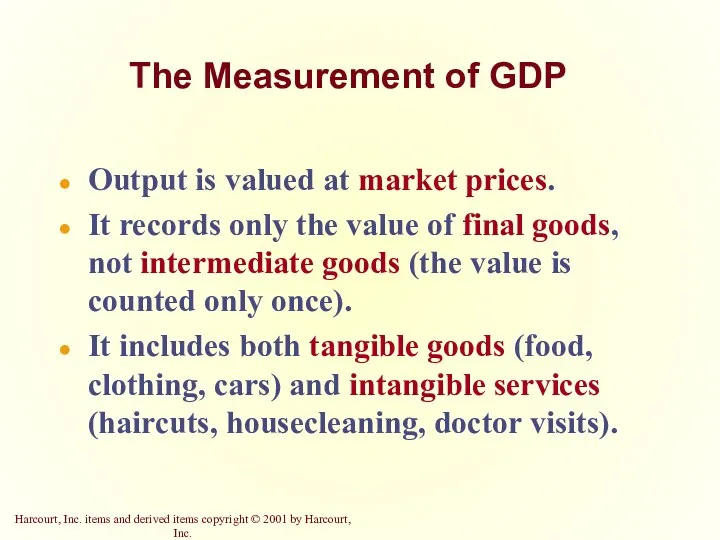
- 11. The Measurement of GDP Output is valued at market prices. It records only the value of
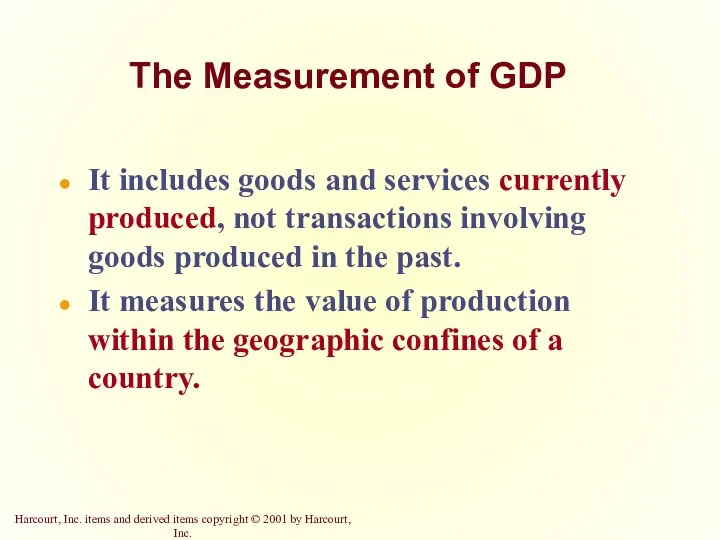
- 12. The Measurement of GDP It includes goods and services currently produced, not transactions involving goods produced
- 13. It measures the value of production that takes place within a specific interval of time, usually
- 14. What Is Counted in GDP? GDP includes all items produced in the economy and sold legally
- 15. What Is Not Counted in GDP? GDP excludes most items that are produced and consumed at
- 16. Other Measures of Income Gross National Product (GNP) Net National Product (NNP) National Income Personal Income
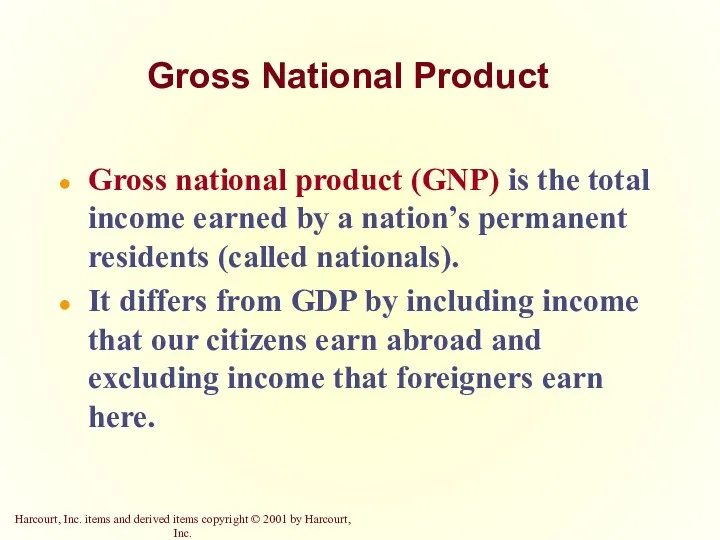
- 17. Gross National Product Gross national product (GNP) is the total income earned by a nation’s permanent
- 18. Net National Product (NNP) Net National Product (NNP) is the total income of the nation’s residents
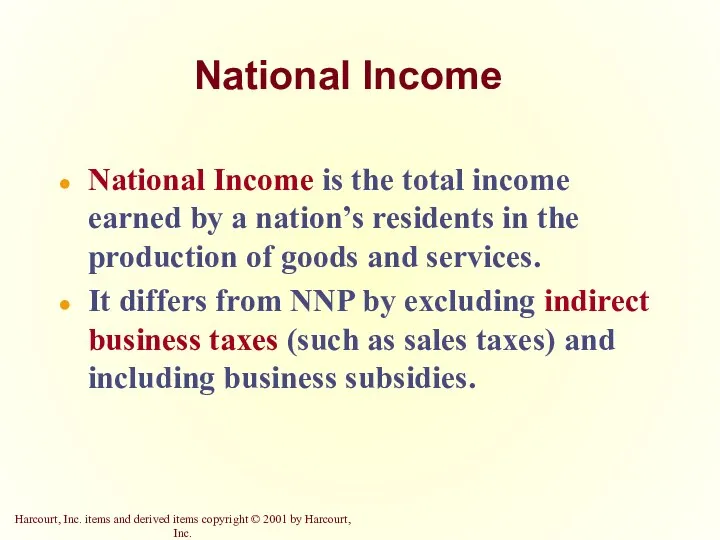
- 19. National Income National Income is the total income earned by a nation’s residents in the production
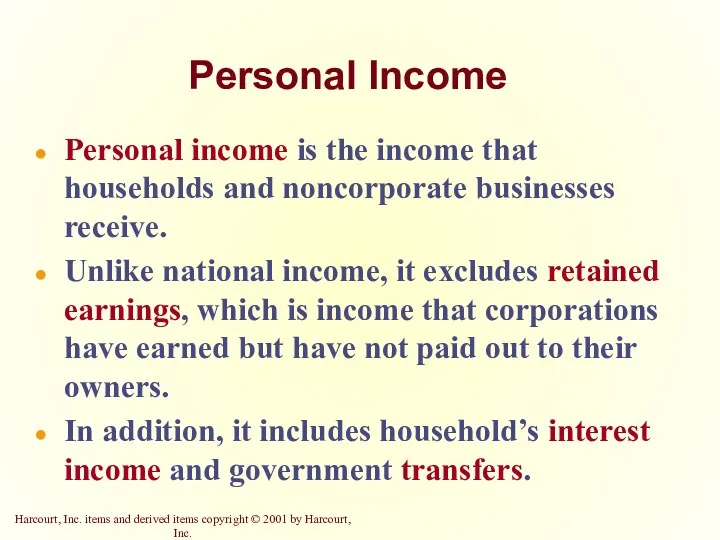
- 20. Personal Income Personal income is the income that households and noncorporate businesses receive. Unlike national income,
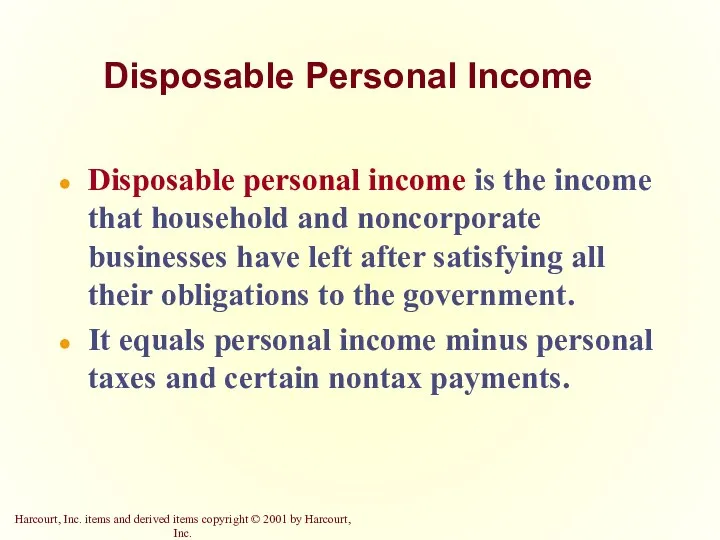
- 21. Disposable Personal Income Disposable personal income is the income that household and noncorporate businesses have left
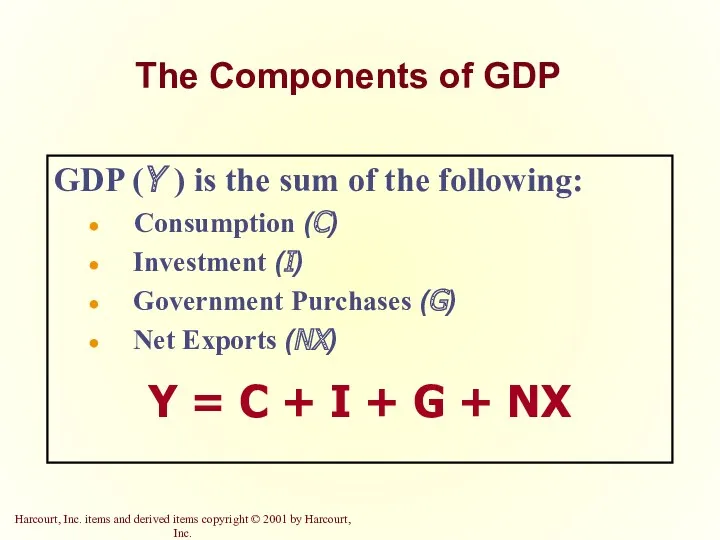
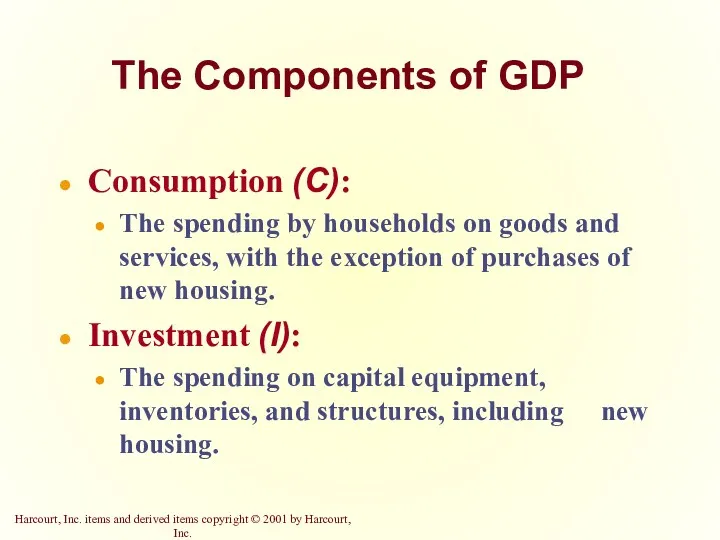
- 22. The Components of GDP GDP (Y ) is the sum of the following: Consumption (C) Investment
- 23. The Components of GDP Consumption (C): The spending by households on goods and services, with the
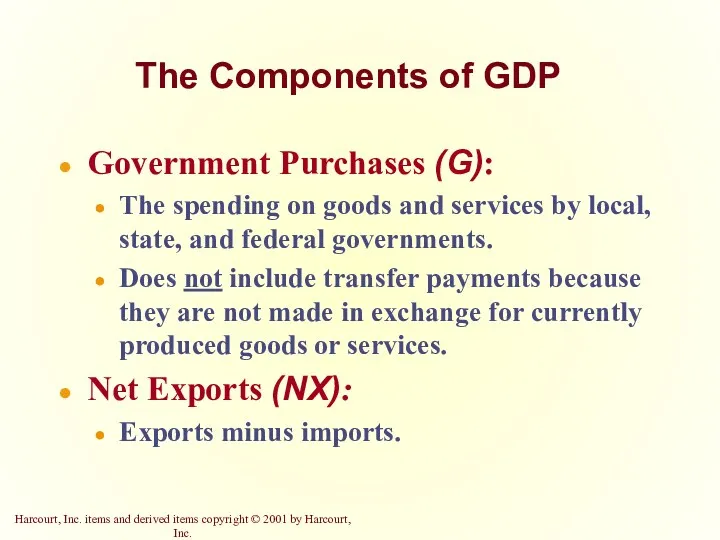
- 24. The Components of GDP Government Purchases (G): The spending on goods and services by local, state,
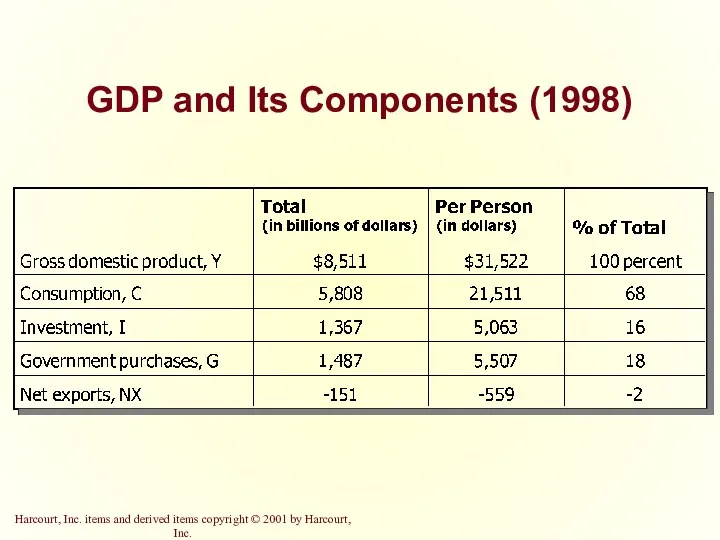
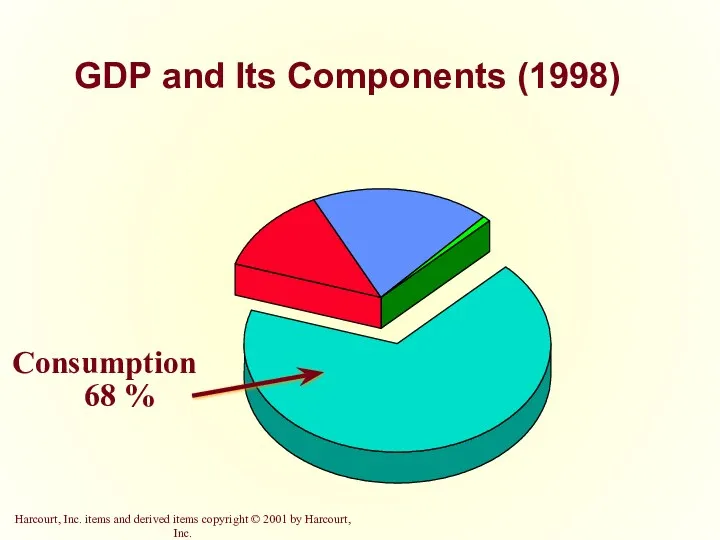
- 25. GDP and Its Components (1998)
- 26. GDP and Its Components (1998)
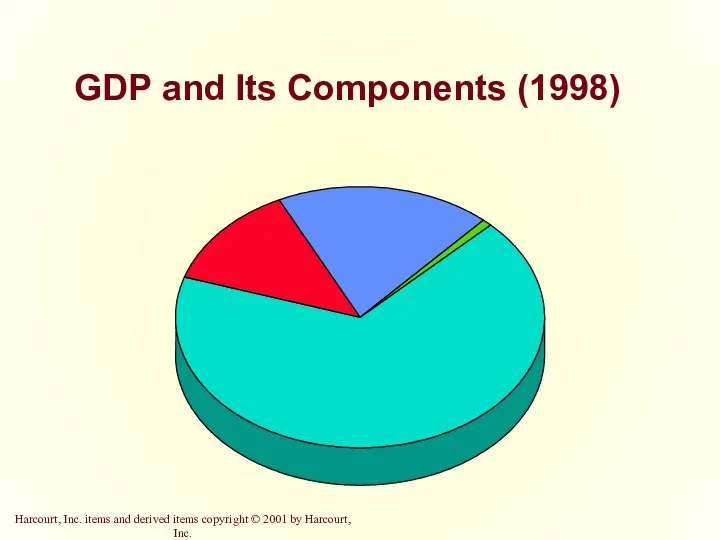
- 27. GDP and Its Components (1998) Consumption 68 %
- 28. Investment 16% GDP and Its Components (1998) Consumption 68 %
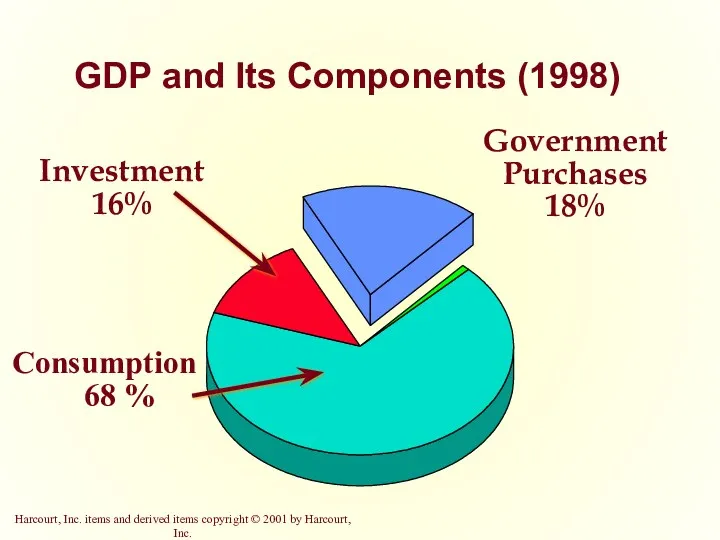
- 29. Consumption 68 % Government Purchases 18% GDP and Its Components (1998) Investment 16%
- 30. Net Exports -2 % GDP and Its Components (1998) Consumption 68 % Investment 16% Government Purchases
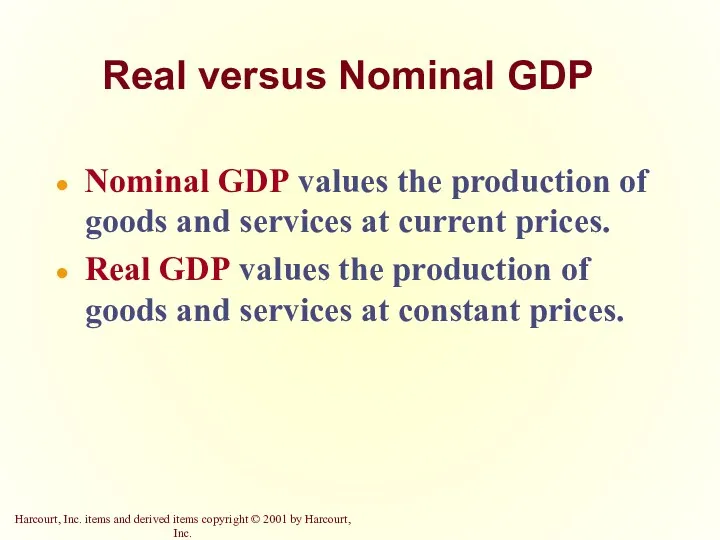
- 31. Real versus Nominal GDP Nominal GDP values the production of goods and services at current prices.
- 32. Real versus Nominal GDP An accurate view of the economy requires adjusting nominal to real GDP
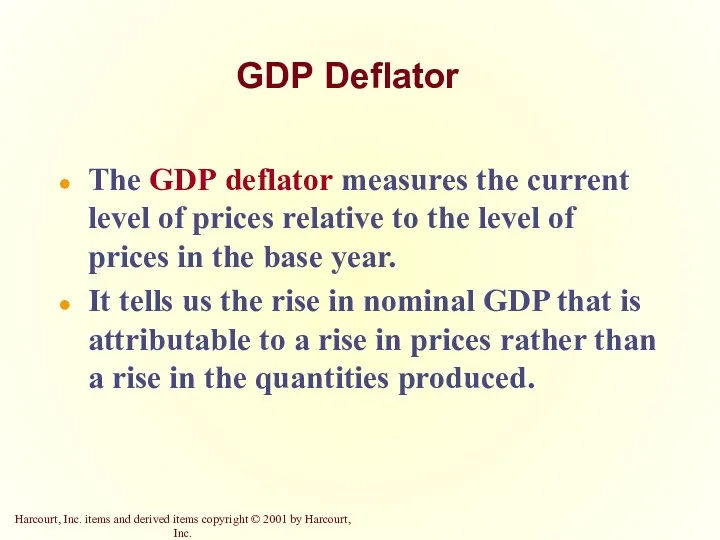
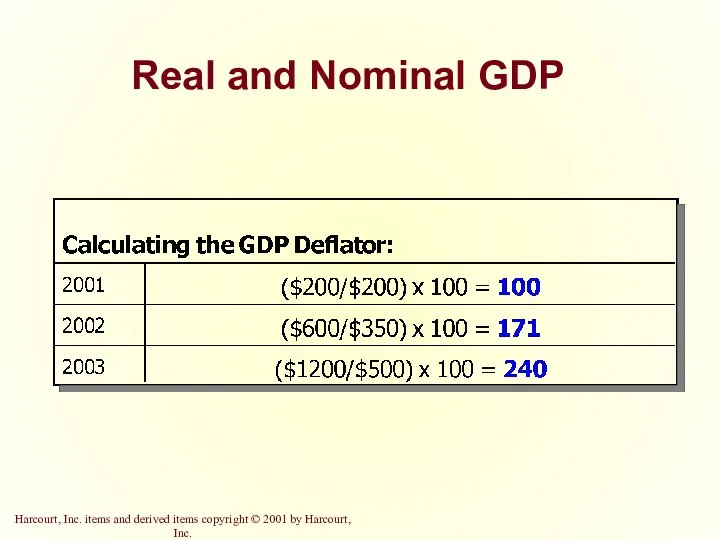
- 33. GDP Deflator The GDP deflator measures the current level of prices relative to the level of
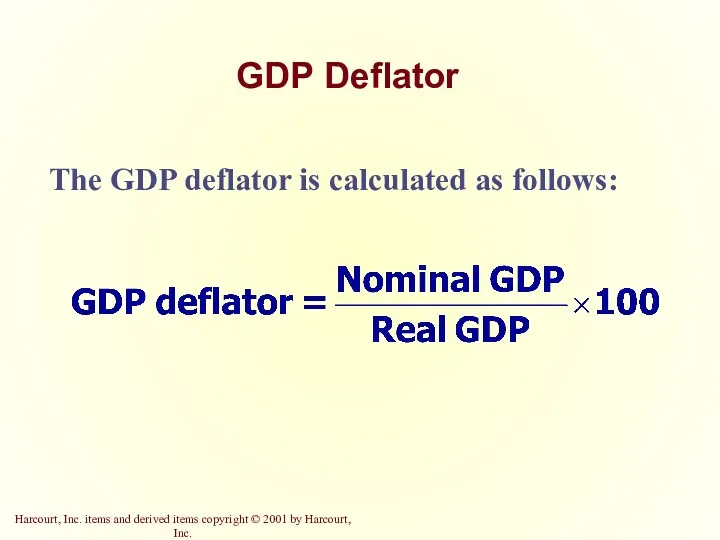
- 34. GDP Deflator The GDP deflator is calculated as follows:
- 35. Converting Nominal GDP to Real GDP Nominal GDP is converted to real GDP as follows:
- 36. Real and Nominal GDP
- 37. Real and Nominal GDP
- 38. Real and Nominal GDP
- 39. Real and Nominal GDP
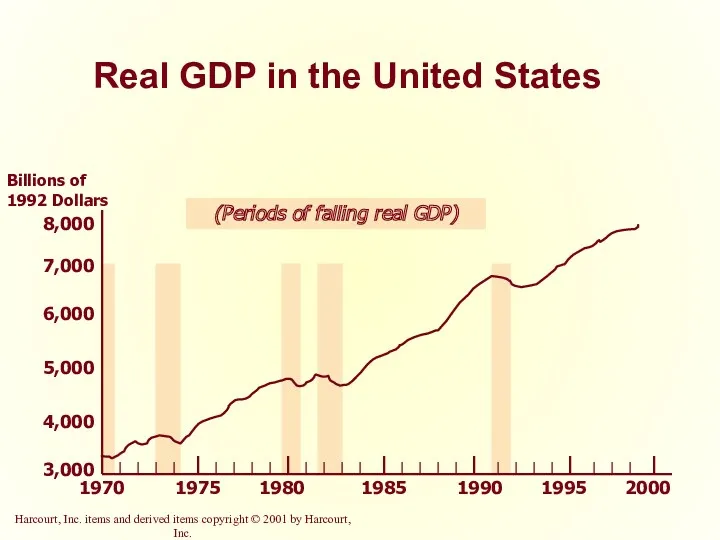
- 40. Real GDP in the United States 1970 1975 1980 1985 1990 1995 3,000 4,000 5,000 6,000
- 41. GDP and Economic Well-Being GDP is the best single measure of the economic well-being of a
- 42. GDP and Economic Well-Being Higher GDP per person indicates a higher standard of living. GDP is
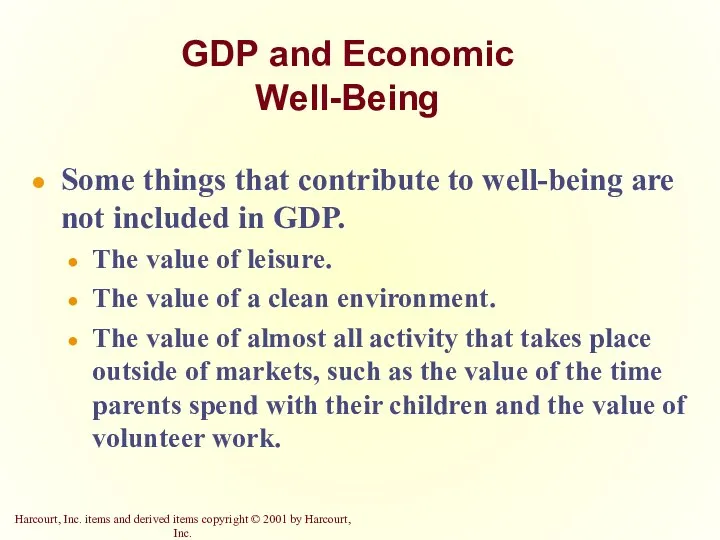
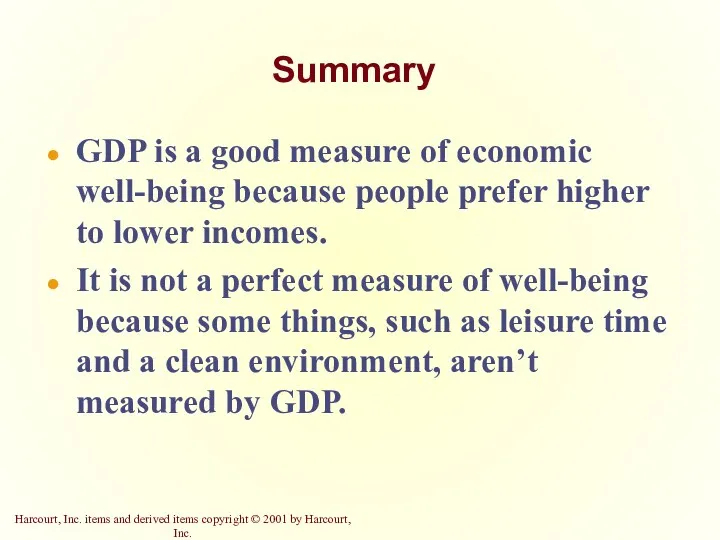
- 43. GDP and Economic Well-Being Some things that contribute to well-being are not included in GDP. The
- 44. GDP, Life Expectancy, and Literacy
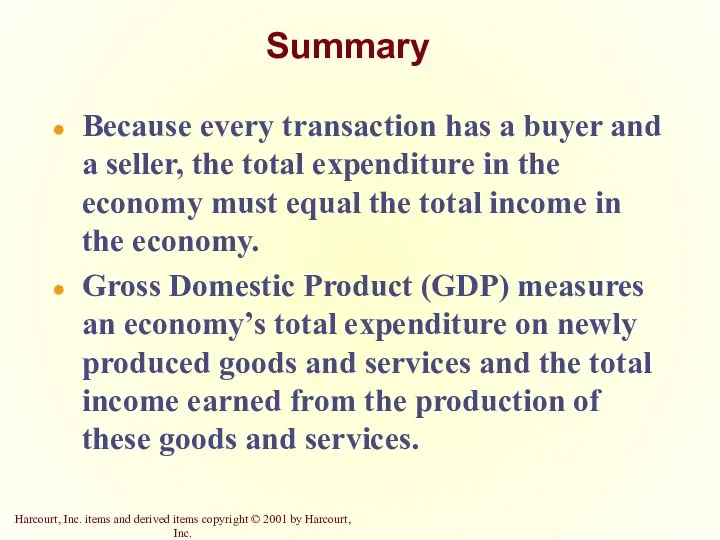
- 45. Summary Because every transaction has a buyer and a seller, the total expenditure in the economy
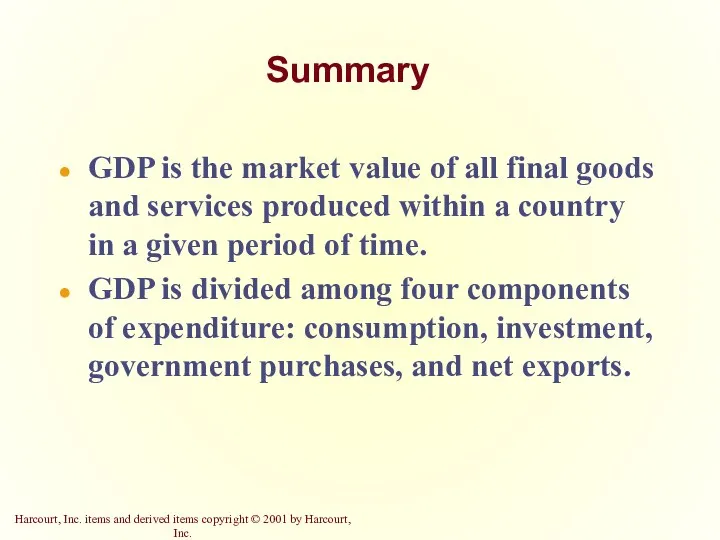
- 46. Summary GDP is the market value of all final goods and services produced within a country
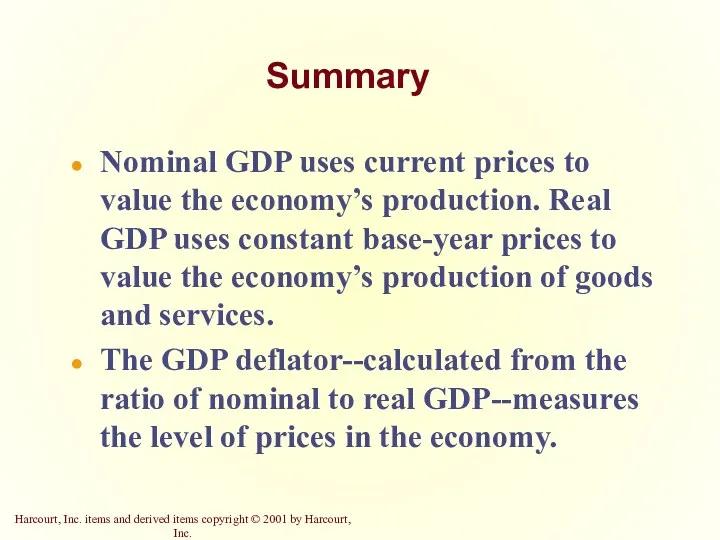
- 47. Summary Nominal GDP uses current prices to value the economy’s production. Real GDP uses constant base-year
- 48. Summary GDP is a good measure of economic well-being because people prefer higher to lower incomes.
- 50. The Circular-Flow Diagram
- 51. GDP and Its Components (1998)
- 53. Скачать презентацию
Microeconomics
Microeconomics is the study of how individual households and firms make
Microeconomics
Microeconomics is the study of how individual households and firms make
Macroeconomics
Macroeconomics is the study of the economy as a whole.
Its goal
Macroeconomics
Macroeconomics is the study of the economy as a whole.
Its goal
Macroeconomics
Macroeconomics answers questions like the following:
Why is average income high in
Macroeconomics
Macroeconomics answers questions like the following:
Why is average income high in
The Economy’s
Income and Expenditure
When judging whether the economy is doing
The Economy’s
Income and Expenditure
When judging whether the economy is doing
The Economy’s
Income and Expenditure
For an economy as a whole, income
The Economy’s
Income and Expenditure
For an economy as a whole, income
Gross domestic product (GDP) is a measure of the income and
Gross domestic product (GDP) is a measure of the income and
The Circular-Flow Diagram
The equality of income and expenditure can be illustrated
The Circular-Flow Diagram
The equality of income and expenditure can be illustrated

The Circular-Flow Diagram
Firms
Households
Market for
Factors
of Production
Market for
Goods
and Services
The Circular-Flow Diagram
Firms
Households
Market for
Factors
of Production
Market for
Goods
and Services
The Measurement of GDP
GDP is the market value of all final
The Measurement of GDP
GDP is the market value of all final
The Measurement of GDP
Output is valued at market prices.
It records only
The Measurement of GDP
Output is valued at market prices.
It records only
The Measurement of GDP
It includes goods and services currently produced, not
The Measurement of GDP
It includes goods and services currently produced, not
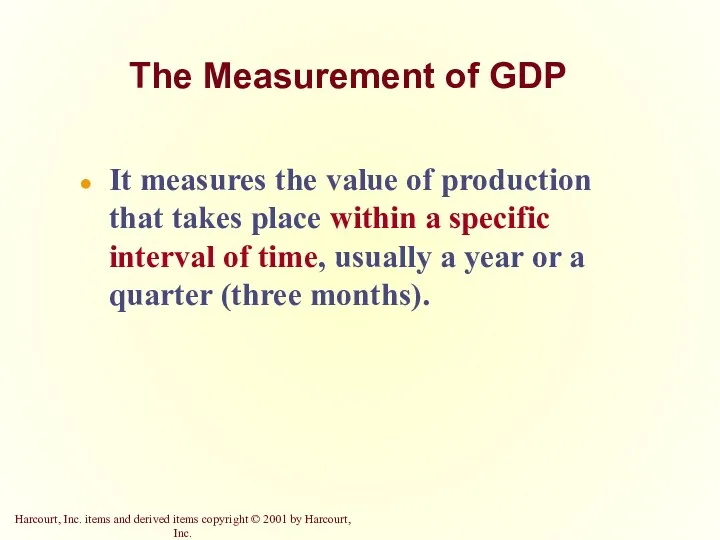
It measures the value of production that takes place within a
It measures the value of production that takes place within a
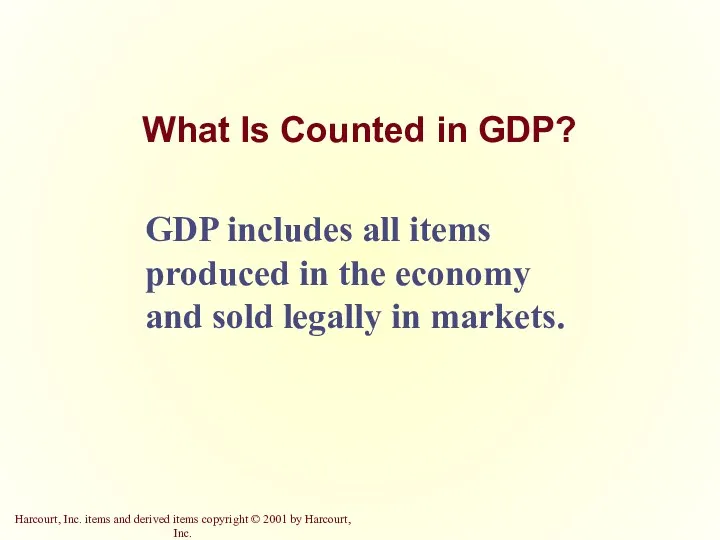
What Is Counted in GDP?
GDP includes all items produced in the
What Is Counted in GDP?
GDP includes all items produced in the
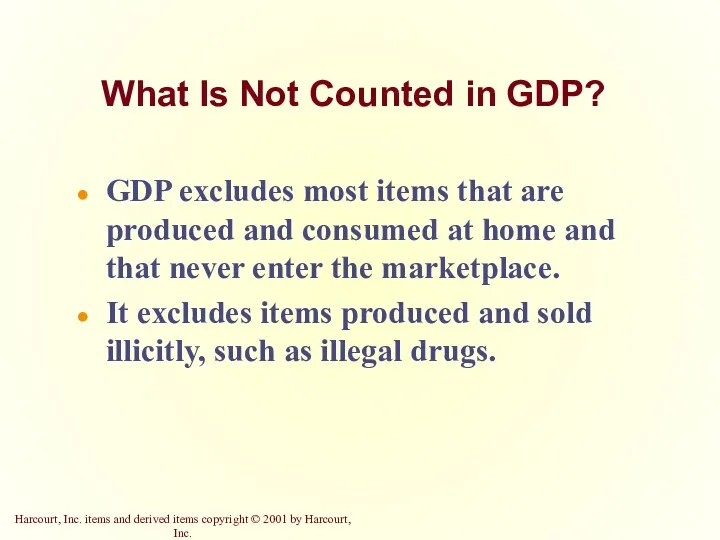
What Is Not Counted in GDP?
GDP excludes most items that are
What Is Not Counted in GDP?
GDP excludes most items that are
Other Measures of Income
Gross National Product (GNP)
Net National Product (NNP)
National Income
Personal
Other Measures of Income
Gross National Product (GNP)
Net National Product (NNP)
National Income
Personal
Gross National Product
Gross national product (GNP) is the total income earned
Gross National Product
Gross national product (GNP) is the total income earned
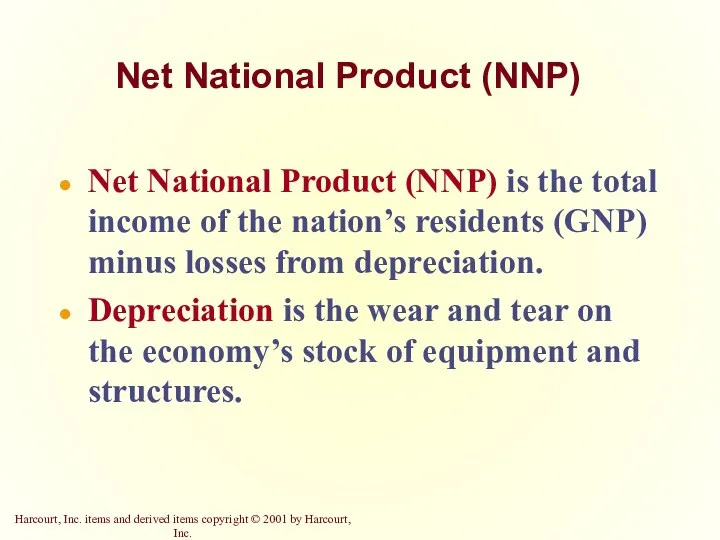
Net National Product (NNP)
Net National Product (NNP) is the total income
Net National Product (NNP)
Net National Product (NNP) is the total income
National Income
National Income is the total income earned by a nation’s
National Income
National Income is the total income earned by a nation’s
Personal Income
Personal income is the income that households and noncorporate businesses
Personal Income
Personal income is the income that households and noncorporate businesses
Disposable Personal Income
Disposable personal income is the income that household and
Disposable Personal Income
Disposable personal income is the income that household and
The Components of GDP
GDP (Y ) is the sum of the
The Components of GDP
GDP (Y ) is the sum of the
The Components of GDP
Consumption (C):
The spending by households on goods and
The Components of GDP
Consumption (C):
The spending by households on goods and
The Components of GDP
Government Purchases (G):
The spending on goods and services
The Components of GDP
Government Purchases (G):
The spending on goods and services
GDP and Its Components (1998)
GDP and Its Components (1998)
GDP and Its Components (1998)
GDP and Its Components (1998)
GDP and Its Components (1998)
Consumption
68 %
GDP and Its Components (1998)
Consumption
68 %
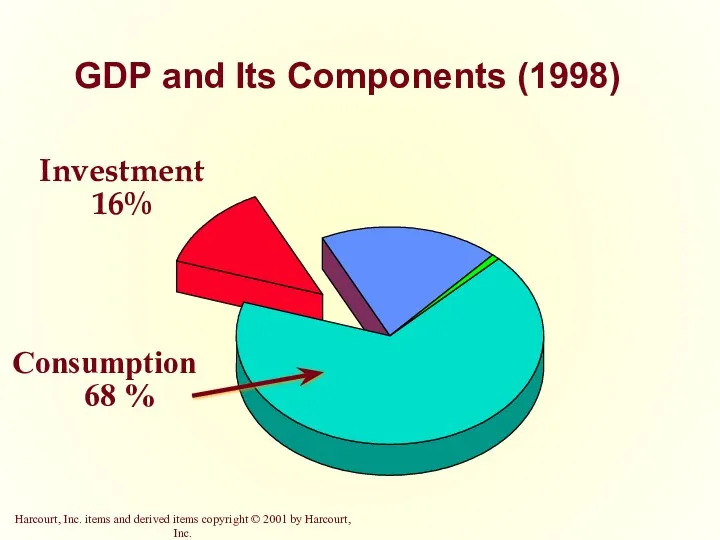
Investment
16%
GDP and Its Components (1998)
Consumption
68 %
Investment
16%
GDP and Its Components (1998)
Consumption
68 %
Consumption
68 %
Government
Purchases
18%
GDP and Its Components (1998)
Investment
16%
Consumption
68 %
Government
Purchases
18%
GDP and Its Components (1998)
Investment
16%
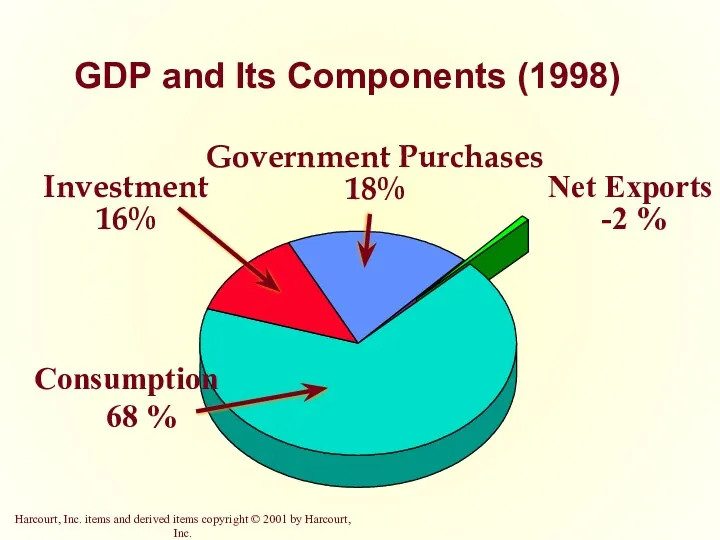
Net Exports
-2 %
GDP and Its Components (1998)
Consumption
68 %
Investment
16%
Government Purchases
18%
Net Exports
-2 %
GDP and Its Components (1998)
Consumption
68 %
Investment
16%
Government Purchases
18%
Real versus Nominal GDP
Nominal GDP values the production of goods and
Real versus Nominal GDP
Nominal GDP values the production of goods and
Real versus Nominal GDP
An accurate view of the economy requires adjusting
Real versus Nominal GDP
An accurate view of the economy requires adjusting
GDP Deflator
The GDP deflator measures the current level of prices relative
GDP Deflator
The GDP deflator measures the current level of prices relative
GDP Deflator
The GDP deflator is calculated as follows:
GDP Deflator
The GDP deflator is calculated as follows:
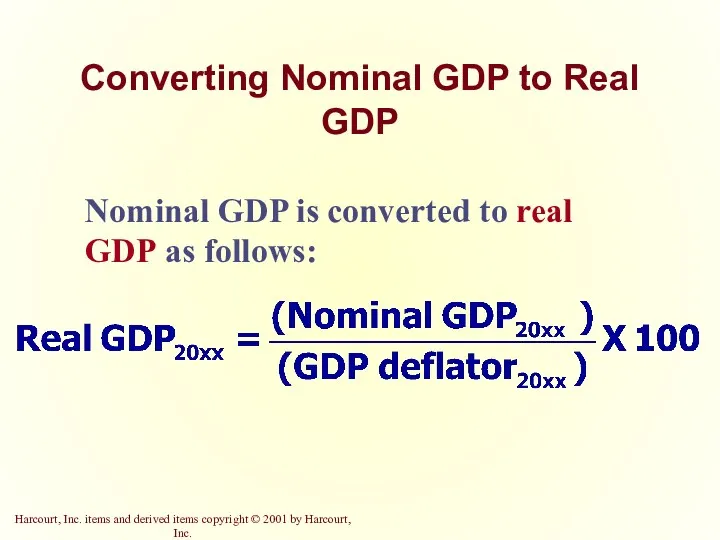
Converting Nominal GDP to Real GDP
Nominal GDP is converted to real
Converting Nominal GDP to Real GDP
Nominal GDP is converted to real
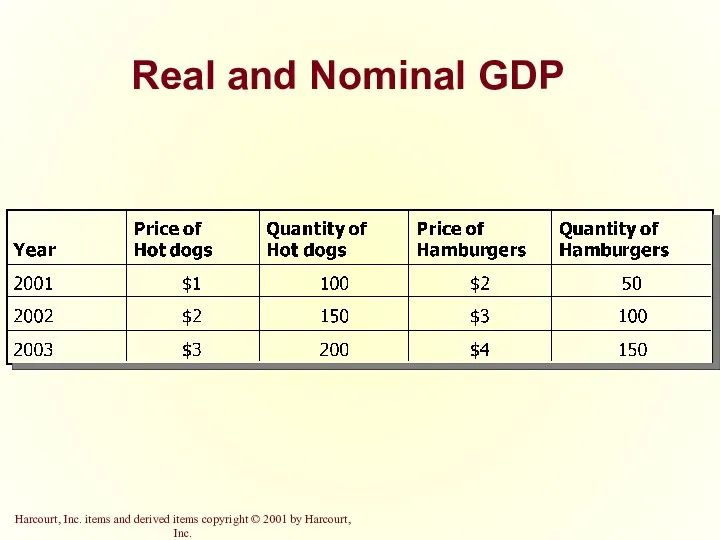
Real and Nominal GDP
Real and Nominal GDP
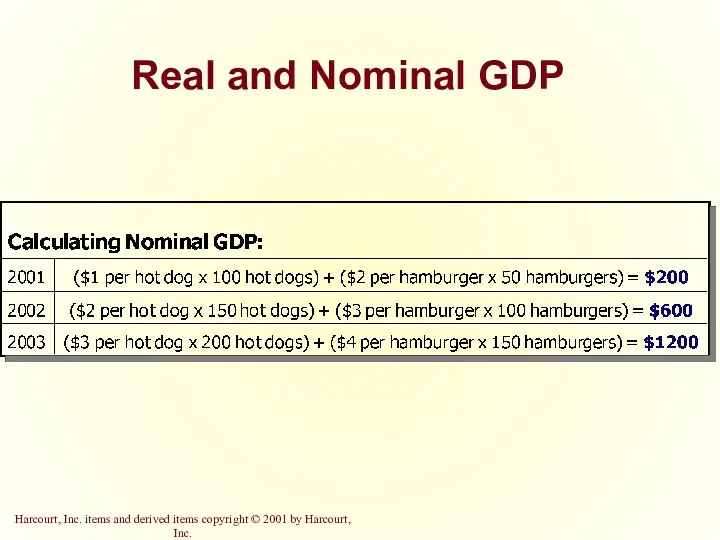
Real and Nominal GDP
Real and Nominal GDP
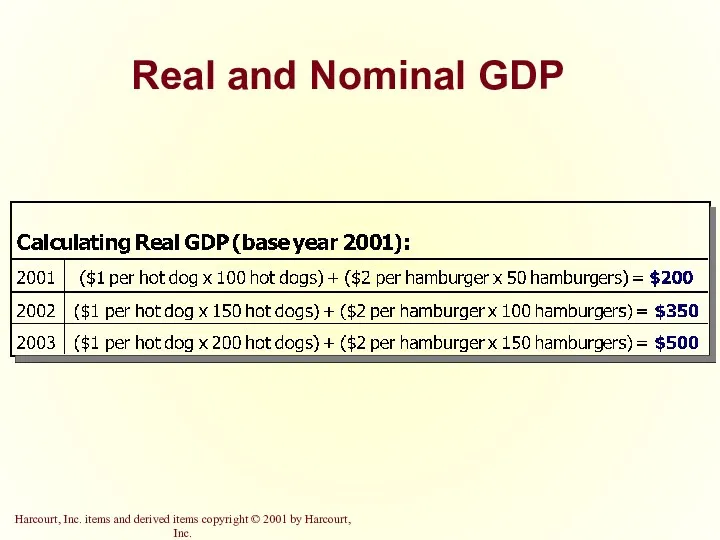
Real and Nominal GDP
Real and Nominal GDP
Real and Nominal GDP
Real and Nominal GDP
Real GDP in the United States
1970
1975
1980
1985
1990
1995
3,000
4,000
5,000
6,000
7,000
Billions of 1992 Dollars
2000
8,000
Real GDP in the United States
1970
1975
1980
1985
1990
1995
3,000
4,000
5,000
6,000
7,000
Billions of 1992 Dollars
2000
8,000
GDP and Economic
Well-Being
GDP is the best single measure of the
GDP and Economic
Well-Being
GDP is the best single measure of the
GDP and Economic
Well-Being
Higher GDP per person indicates a higher standard
GDP and Economic
Well-Being
Higher GDP per person indicates a higher standard
GDP and Economic
Well-Being
Some things that contribute to well-being are not
GDP and Economic
Well-Being
Some things that contribute to well-being are not

GDP, Life Expectancy, and Literacy
GDP, Life Expectancy, and Literacy
Summary
Because every transaction has a buyer and a seller, the total
Summary
Because every transaction has a buyer and a seller, the total
Summary
GDP is the market value of all final goods and services
Summary
GDP is the market value of all final goods and services
Summary
Nominal GDP uses current prices to value the economy’s production. Real
Summary
Nominal GDP uses current prices to value the economy’s production. Real
Summary
GDP is a good measure of economic well-being because people prefer
Summary
GDP is a good measure of economic well-being because people prefer
The Circular-Flow Diagram
The Circular-Flow Diagram

GDP and Its Components (1998)
GDP and Its Components (1998)
 Инфляция и семейная экономика
 Статус территории опережающего социально-экономического развития
 Товарные запасы торгового предприятия
 Виды и модели рынка труда
 Globalisation
 Торговая организация
 Рыночные отношения
 Бюджетно-налоговая (фискальная политика) государства
 Статистические индексы
 Особенности управления городским хозяйством
 Правовое регулирование предоставления тарифных преференций на таможенной территории Евразийского экономического союза
 Бизнес-встреча Перспективные инвестиции: 2015-2016
 Финансовая система США
 Возможности территории опережающего социально-экономического развития (ТОСЭР) Благовещенск
 Потребности, ресурсы, выбор. Экономический кругооборот
 Региональная экономика. Лекция 8. Бюджетный федерализм
 Технологічна політика ТНК
 Економіка країн світу в роки Другої світової війни. Економічні наслідки
 Категории качества. Эволюция развития и изменения понятия качество
 Введение в экономику. Тема 9. Конкуренция и монополия
 Вопросы по теме Общество
 Экономические проблемы вхождения России в мировой рынок: задачи, цели и перспективы. (Тема 9)
 Митна політика україни. Сучасність і перспективи розвитку
 Стратегия развития России до 2020 года
 Подготовка к ЕГЭ по обществознанию, работа с заданиями В-1. Экономика
 Глобальные экономические тенденции
 Планирование прибыли предприятия и пути его совершенствования (на примере ООО Комби)
 Моделирование повышения платежеспособного спроса