- Pie chart

Содержание
- 2. Contribution to the economy of Turkey by sector
- 3. Overview two main options to describe key features: find the biggest and smallest slices of each
- 5. Overall, at the beginning of the period construction contributed the least to the economy of Turkey
- 6. Percentage per sector sector X was 3% sector X made up 3% sector X accounted for
- 8. Скачать презентацию
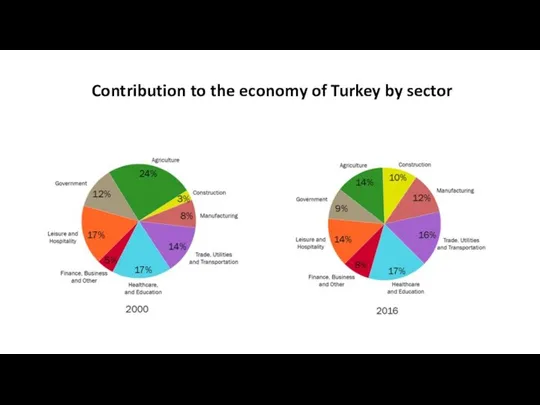
Contribution to the economy of Turkey by sector

Overview
two main options to describe key features:
find the biggest and smallest
Overview
two main options to describe key features:
find the biggest and smallest

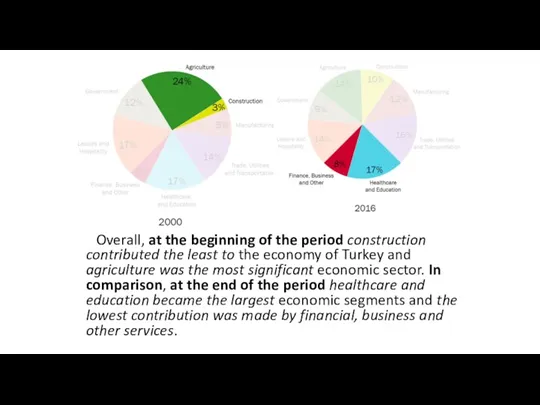
Overall, at the beginning of the period construction contributed the
Overall, at the beginning of the period construction contributed the
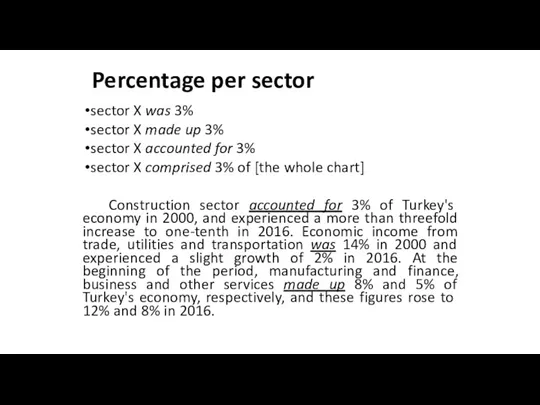
Percentage per sector
sector X was 3%
sector X made up 3%
Percentage per sector
sector X was 3%
sector X made up 3%
 Экономические аспекты деятельности САМ
 International division of labor
 Методы и приемы экономического анализа. Тема 4
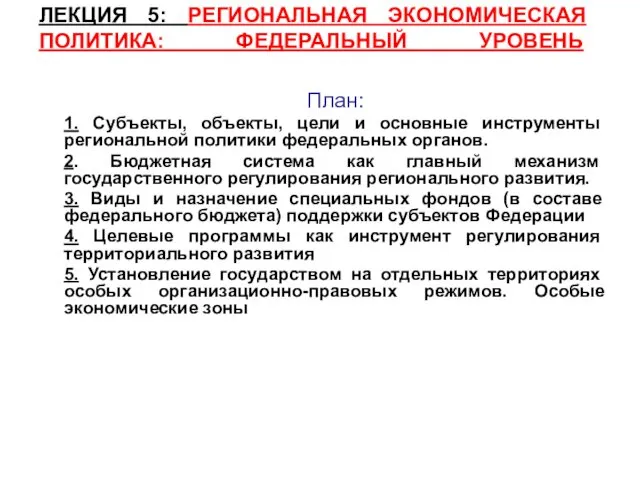 Региональная экономическая политика: федеральный уровень
 Анализ оборотных активов и пути повышения эффективности использования оборотных средств на ООО Мустанг
 Рынок труда и его неравновесие
 Основы мировой экономики
 Историческая эволюция взглядов на теневую экономику
 Инфляция. Лекция 11
 Экономика Приморского края. Россия
 Демографічна проблема
 Теория производства. Понятие изоквант, производственные множества и технологическая эффективность. (Лекция 9)
 Кадровое обеспечение предпринимательских организаций. Лекция 6
 Домашнее хозяйство. Экономика домохозяйства
 7. Потребительские свойства одежды
 Ресурсы предприятия
 Монополии. Понятие монополии
 Уходя, гасите свет
 Методы государственного финансового регулирования экономики
 Рынок труда. Безработица
 Экономический рост и институты. Лекция 6
 Понятие и сущность семейного бюджета, источники его доходов и расходов
 Країни Європи. Загальна характеристика регіону, його склад. Населення, міста
 ТНК. Отрасли
 Предмет макроэкономики
 Налоги: понятие, функции, основные виды. Роль налогового регулирования в рыночной экономике
 Процессный подход
 Организация и нормирование труда