- Risk Return and Project Decisions

Содержание
- 2. What’s the Big Idea? Earlier chapters on capital budgeting focused on the appropriate size and timing
- 3. 12.1 The Cost of Equity Capital Firm with excess cash Shareholder’s Terminal Value Shareholder invests in
- 4. The Cost of Equity From the firm’s perspective, the expected return is the Cost of Equity
- 5. Example Suppose the stock of Stansfield Enterprises, a publisher of PowerPoint presentations, has a beta of
- 6. Example (continued) Suppose Stansfield Enterprises is evaluating the following non-mutually exclusive projects. Each costs $100 and
- 7. Using the SML to Estimate the Risk-Adjusted Discount Rate for Projects An all-equity firm should accept
- 8. 12.2 Estimation of Beta: Measuring Market Risk Market Portfolio - Portfolio of all assets in the
- 9. 12.2 Estimation of Beta Theoretically, the calculation of beta is straightforward: Problems Betas may vary over
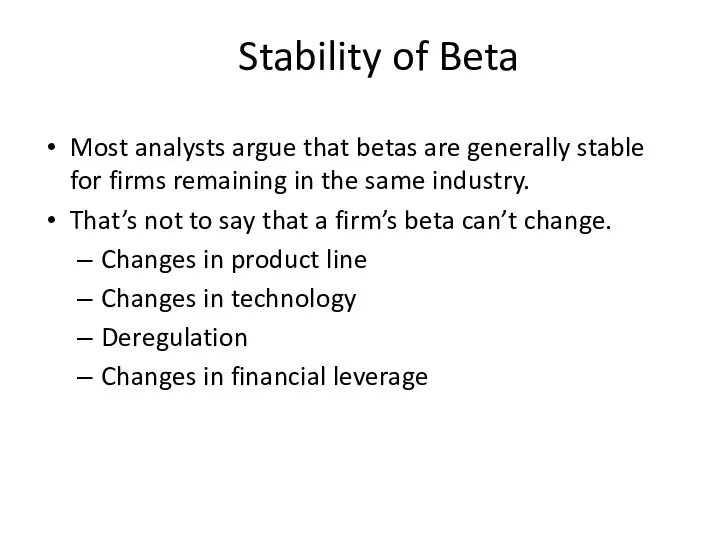
- 10. Stability of Beta Most analysts argue that betas are generally stable for firms remaining in the
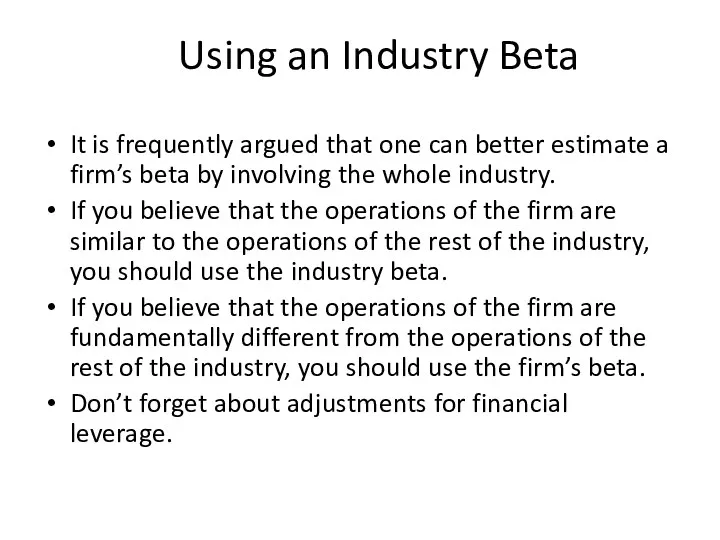
- 11. Using an Industry Beta It is frequently argued that one can better estimate a firm’s beta
- 12. 12.3 Determinants of Beta Business Risk Cyclicity of Revenues Operating Leverage Financial Risk Financial Leverage
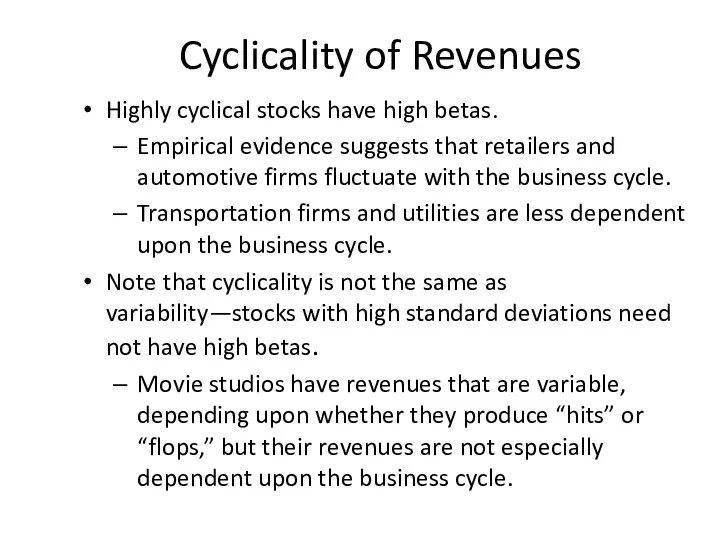
- 13. Cyclicality of Revenues Highly cyclical stocks have high betas. Empirical evidence suggests that retailers and automotive
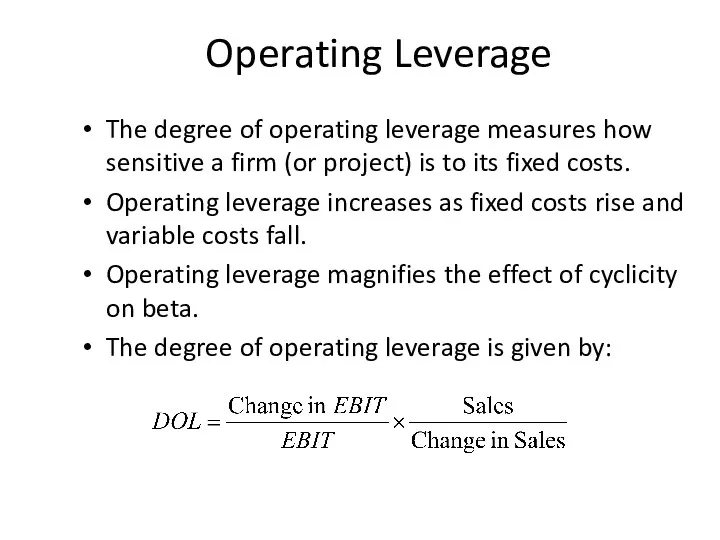
- 14. Operating Leverage The degree of operating leverage measures how sensitive a firm (or project) is to
- 15. Operating Leverage Volume $ Fixed costs Total costs Δ EBIT Δ Volume Operating leverage increases as
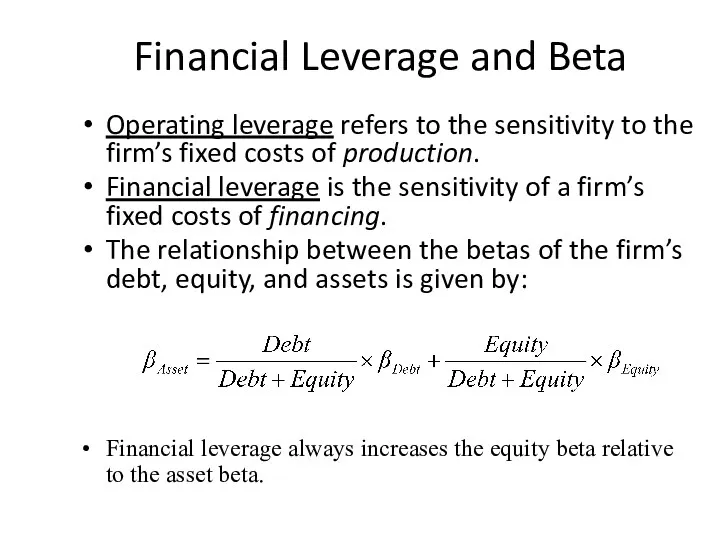
- 16. Financial Leverage and Beta Operating leverage refers to the sensitivity to the firm’s fixed costs of
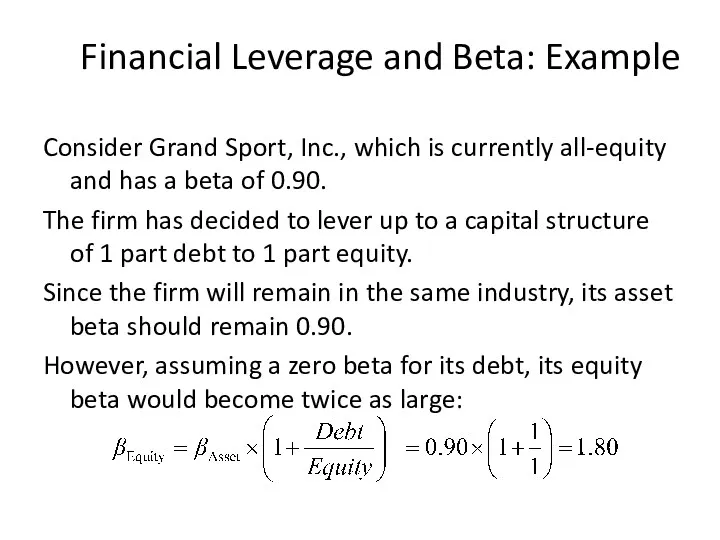
- 17. Financial Leverage and Beta: Example Consider Grand Sport, Inc., which is currently all-equity and has a
- 18. 12.4 Extensions of the Basic Model The Firm versus the Project The Cost of Capital with
- 19. The Firm versus the Project Any project’s cost of capital depends on the use to which
- 20. Capital Budgeting & Project Risk A firm that uses one discount rate for all projects may
- 21. Capital Budgeting & Project Risk Suppose the Conglomerate Company has a cost of capital, based on
- 22. Capital Budgeting & Project Risk Project IRR Firm’s risk (beta) r = 4% + 0.6×(14% –
- 23. The Cost of Capital with Debt The Weighted Average Cost of Capital is given by: It
- 24. 12.5 Estimating Bombardier’s Cost of Capital We aim at estimating Bombardier’s cost of capital, as of
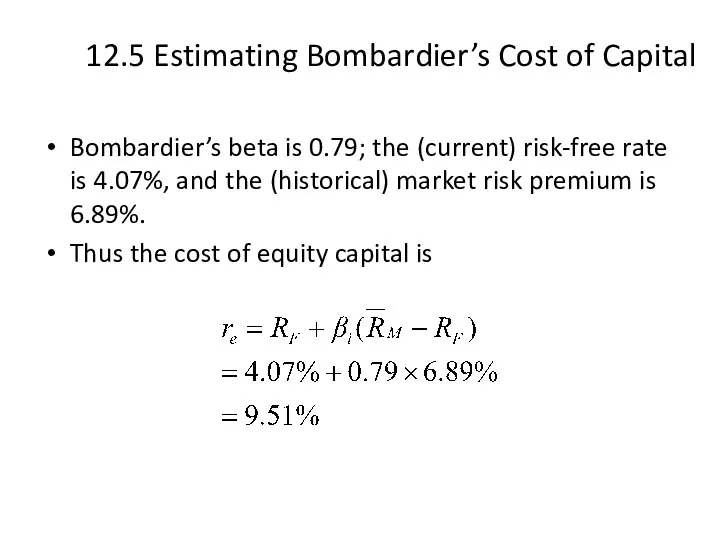
- 25. 12.5 Estimating Bombardier’s Cost of Capital Bombardier’s beta is 0.79; the (current) risk-free rate is 4.07%,
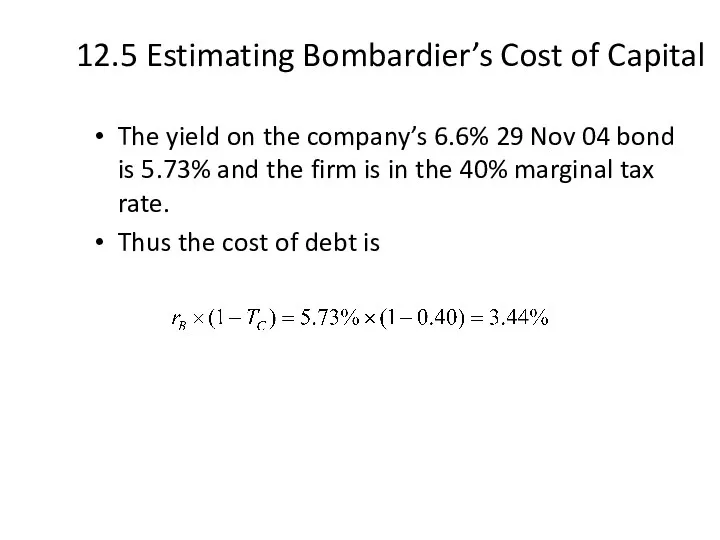
- 26. 12.5 Estimating Bombardier’s Cost of Capital The yield on the company’s 6.6% 29 Nov 04 bond
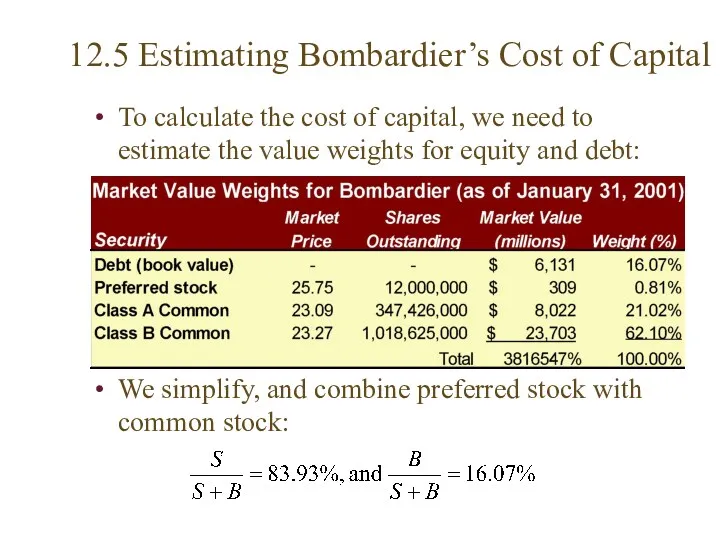
- 27. 12.5 Estimating Bombardier’s Cost of Capital To calculate the cost of capital, we need to estimate
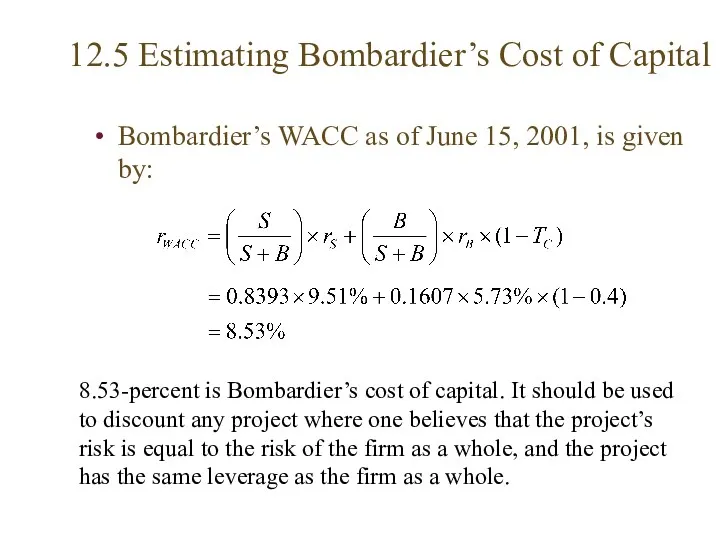
- 28. 12.5 Estimating Bombardier’s Cost of Capital Bombardier’s WACC as of June 15, 2001, is given by:
- 29. 12.6 Reducing the Cost of Capital What is Liquidity? Liquidity, Expected Returns, and the Cost of
- 30. What is Liquidity? The idea that the expected return on a stock and the firm’s cost
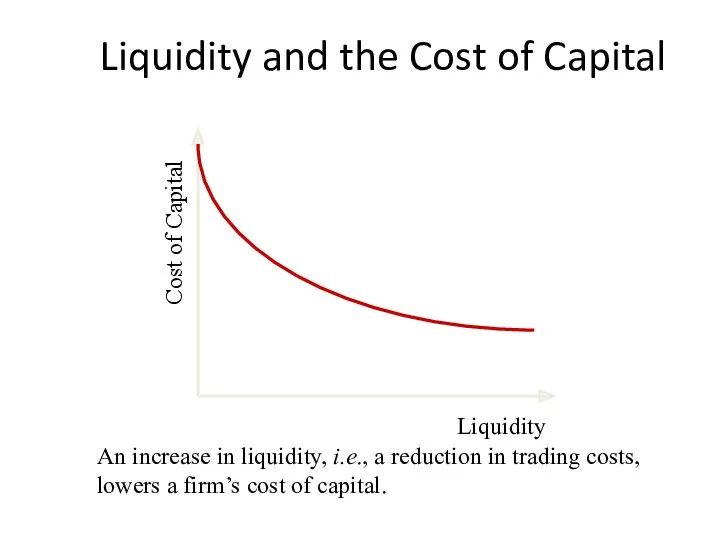
- 31. Liquidity, Expected Returns, and the Cost of Capital The cost of trading an illiquid stock reduces
- 32. Liquidity and the Cost of Capital Cost of Capital Liquidity An increase in liquidity, i.e., a
- 33. Liquidity and Adverse Selection There are a number of factors that determine the liquidity of a
- 34. What the Corporation Can Do The corporation has an incentive to lower trading costs since this
- 35. What the Corporation Can Do Companies can also facilitate stock purchases through the Internet. Direct stock
- 37. Скачать презентацию
What’s the Big Idea?
Earlier chapters on capital budgeting focused on the
What’s the Big Idea?
Earlier chapters on capital budgeting focused on the
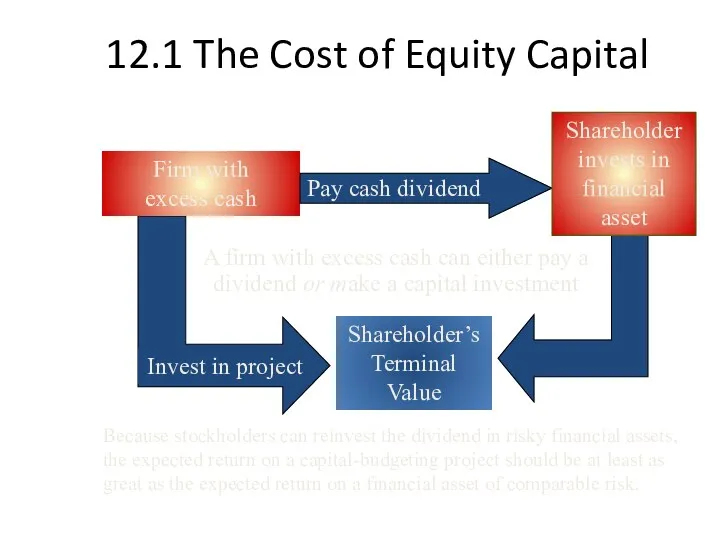
12.1 The Cost of Equity Capital
Firm with
excess cash
Shareholder’s Terminal Value
Shareholder invests
12.1 The Cost of Equity Capital
Firm with
excess cash
Shareholder’s Terminal Value
Shareholder invests
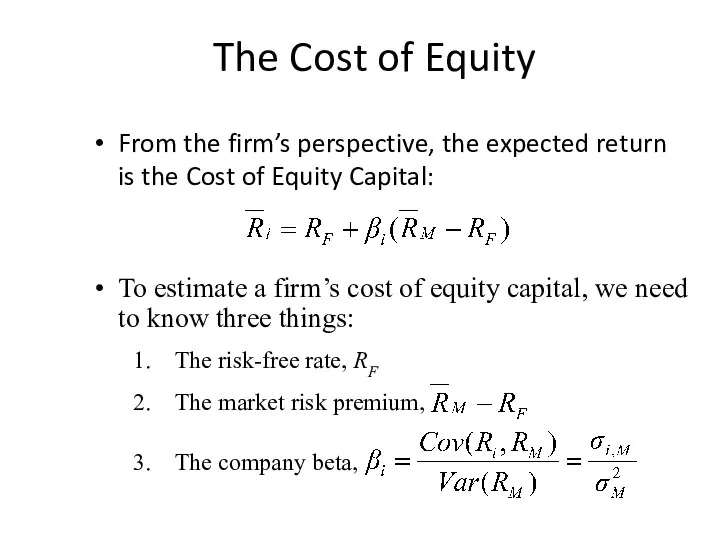
The Cost of Equity
From the firm’s perspective, the expected return is
The Cost of Equity
From the firm’s perspective, the expected return is
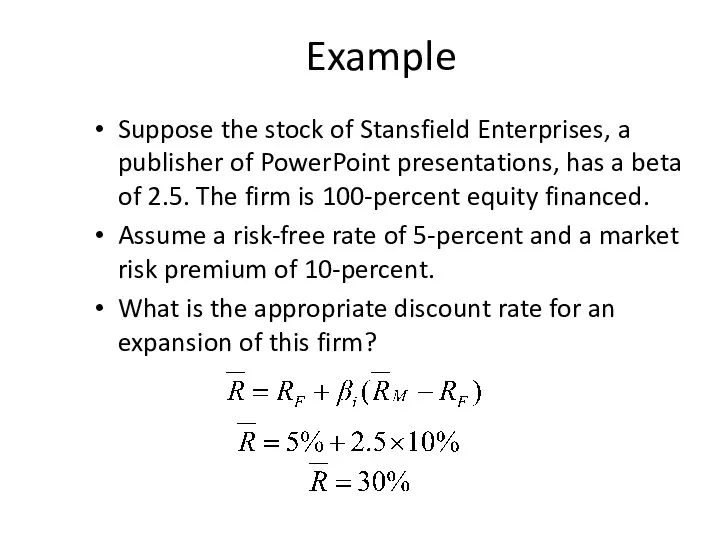
Example
Suppose the stock of Stansfield Enterprises, a publisher of PowerPoint presentations,
Example
Suppose the stock of Stansfield Enterprises, a publisher of PowerPoint presentations,
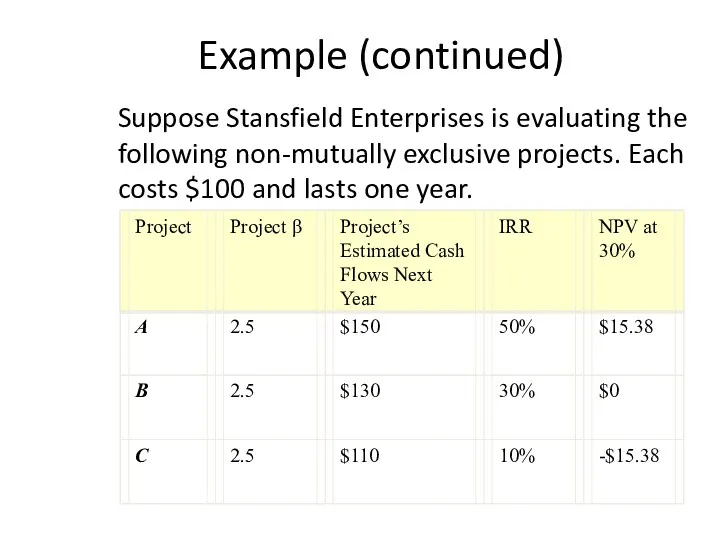
Example (continued)
Suppose Stansfield Enterprises is evaluating the following non-mutually exclusive
Example (continued)
Suppose Stansfield Enterprises is evaluating the following non-mutually exclusive
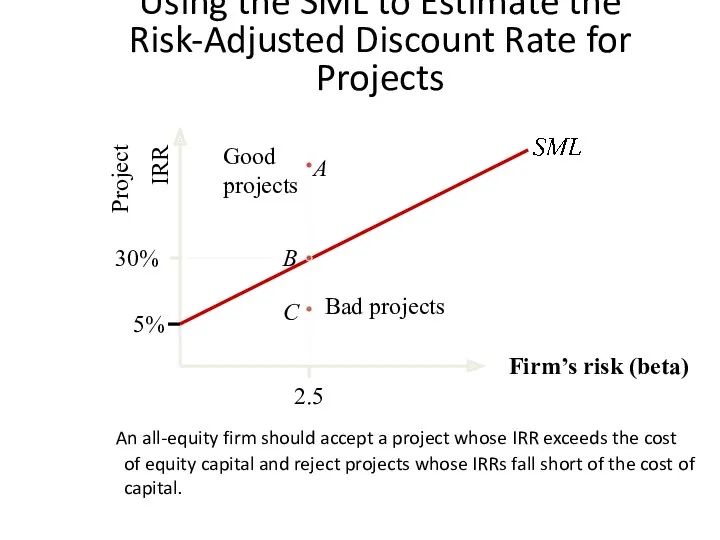
Using the SML to Estimate the Risk-Adjusted Discount Rate for Projects
Using the SML to Estimate the Risk-Adjusted Discount Rate for Projects
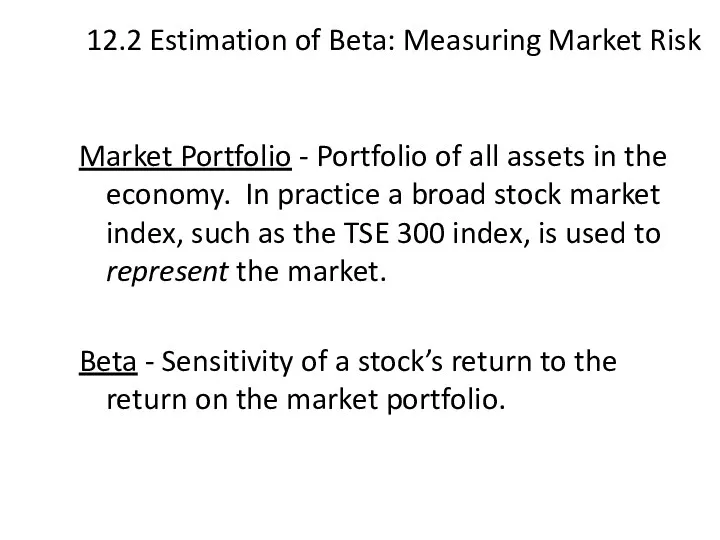
12.2 Estimation of Beta: Measuring Market Risk
Market Portfolio - Portfolio of
12.2 Estimation of Beta: Measuring Market Risk
Market Portfolio - Portfolio of
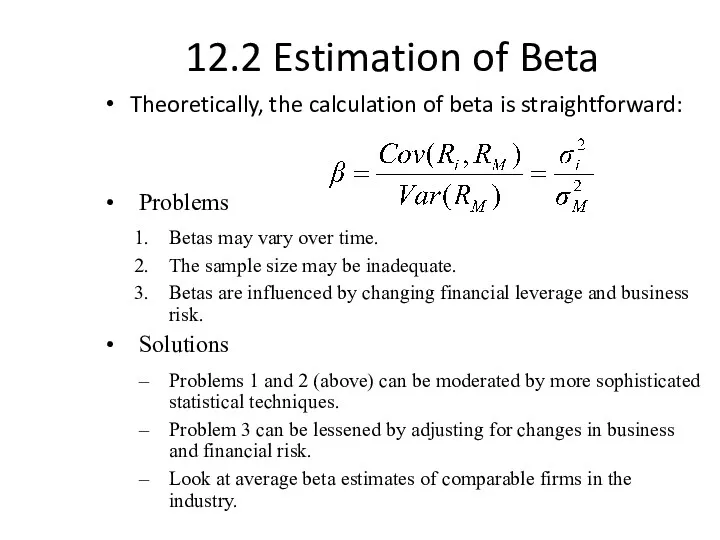
12.2 Estimation of Beta
Theoretically, the calculation of beta is straightforward:
Problems
Betas may
12.2 Estimation of Beta
Theoretically, the calculation of beta is straightforward:
Problems
Betas may
Stability of Beta
Most analysts argue that betas are generally stable for
Stability of Beta
Most analysts argue that betas are generally stable for
Using an Industry Beta
It is frequently argued that one can better
Using an Industry Beta
It is frequently argued that one can better
12.3 Determinants of Beta
Business Risk
Cyclicity of Revenues
Operating Leverage
Financial Risk
Financial Leverage
12.3 Determinants of Beta
Business Risk
Cyclicity of Revenues
Operating Leverage
Financial Risk
Financial Leverage
Cyclicality of Revenues
Highly cyclical stocks have high betas.
Empirical evidence suggests that
Cyclicality of Revenues
Highly cyclical stocks have high betas.
Empirical evidence suggests that
Operating Leverage
The degree of operating leverage measures how sensitive a firm
Operating Leverage
The degree of operating leverage measures how sensitive a firm
Operating Leverage
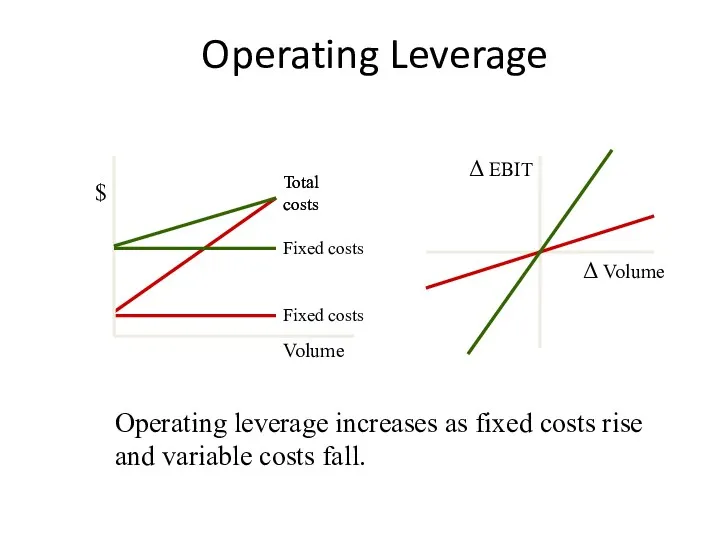
Volume
$
Fixed costs
Total costs
Δ EBIT
Δ Volume
Operating leverage increases as fixed costs
Operating Leverage
Volume
$
Fixed costs
Total costs
Δ EBIT
Δ Volume
Operating leverage increases as fixed costs
Financial Leverage and Beta
Operating leverage refers to the sensitivity to the
Financial Leverage and Beta
Operating leverage refers to the sensitivity to the
Financial Leverage and Beta: Example
Consider Grand Sport, Inc., which is currently
Financial Leverage and Beta: Example
Consider Grand Sport, Inc., which is currently
12.4 Extensions of the Basic Model
The Firm versus the Project
The Cost
12.4 Extensions of the Basic Model
The Firm versus the Project
The Cost
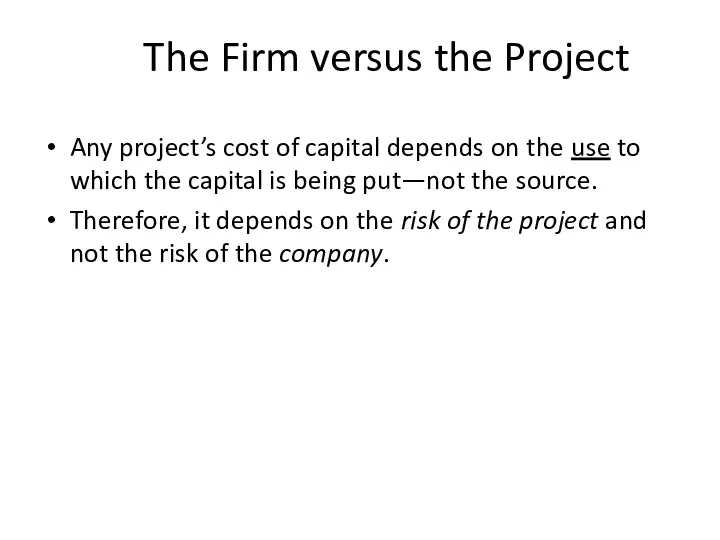
The Firm versus the Project
Any project’s cost of capital depends on
The Firm versus the Project
Any project’s cost of capital depends on
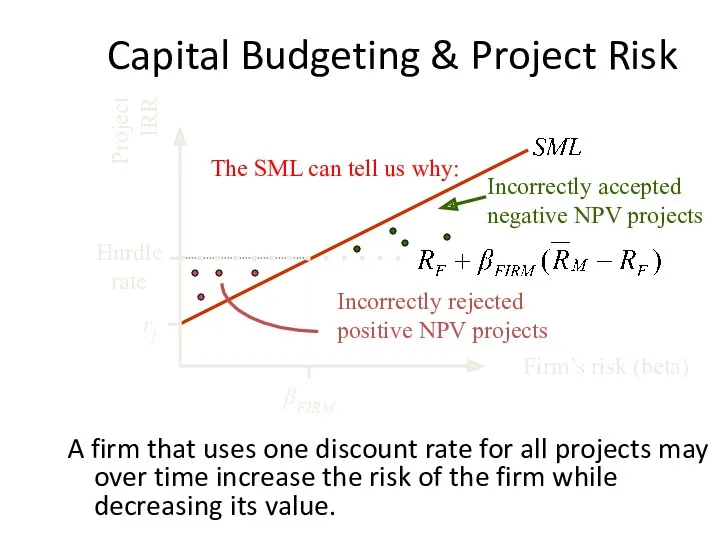
Capital Budgeting & Project Risk
A firm that uses one discount rate
Capital Budgeting & Project Risk
A firm that uses one discount rate

Capital Budgeting & Project Risk
Suppose the Conglomerate Company has a cost
Capital Budgeting & Project Risk
Suppose the Conglomerate Company has a cost
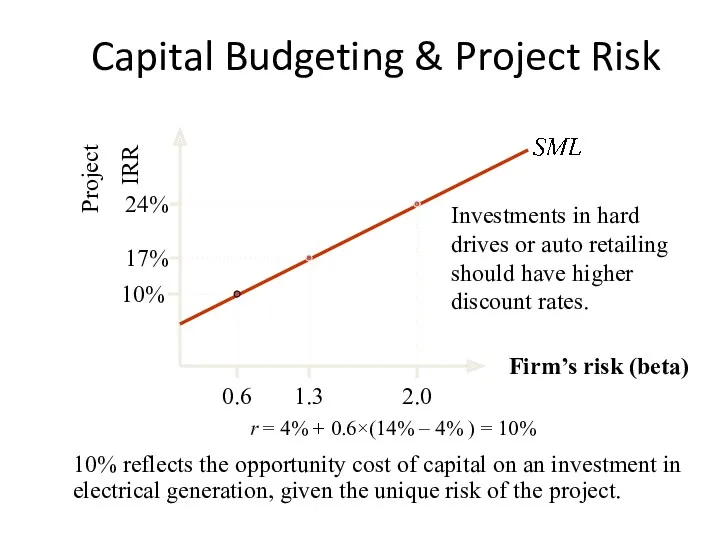
Capital Budgeting & Project Risk
Project
IRR
Firm’s risk (beta)
r = 4% +
Capital Budgeting & Project Risk
Project
IRR
Firm’s risk (beta)
r = 4% +

The Cost of Capital with Debt
The Weighted Average Cost of Capital
The Cost of Capital with Debt
The Weighted Average Cost of Capital
12.5 Estimating Bombardier’s Cost of Capital
We aim at estimating Bombardier’s cost
12.5 Estimating Bombardier’s Cost of Capital
We aim at estimating Bombardier’s cost
12.5 Estimating Bombardier’s Cost of Capital
Bombardier’s beta is 0.79; the (current)
12.5 Estimating Bombardier’s Cost of Capital
Bombardier’s beta is 0.79; the (current)
12.5 Estimating Bombardier’s Cost of Capital
The yield on the company’s 6.6%
12.5 Estimating Bombardier’s Cost of Capital
The yield on the company’s 6.6%
12.5 Estimating Bombardier’s Cost of Capital
To calculate the cost of capital,
12.5 Estimating Bombardier’s Cost of Capital
To calculate the cost of capital,
12.5 Estimating Bombardier’s Cost of Capital
Bombardier’s WACC as of June 15,
12.5 Estimating Bombardier’s Cost of Capital
Bombardier’s WACC as of June 15,
12.6 Reducing the Cost of Capital
What is Liquidity?
Liquidity, Expected Returns, and
12.6 Reducing the Cost of Capital
What is Liquidity?
Liquidity, Expected Returns, and
What is Liquidity?
The idea that the expected return on a stock
What is Liquidity?
The idea that the expected return on a stock
Liquidity, Expected Returns, and the Cost of Capital
The cost of trading
Liquidity, Expected Returns, and the Cost of Capital
The cost of trading
Liquidity and the Cost of Capital
Cost of Capital
Liquidity
An increase in liquidity,
Liquidity and the Cost of Capital
Cost of Capital
Liquidity
An increase in liquidity,
Liquidity and Adverse Selection
There are a number of factors that determine
Liquidity and Adverse Selection
There are a number of factors that determine
What the Corporation Can Do
The corporation has an incentive to lower
What the Corporation Can Do
The corporation has an incentive to lower
What the Corporation Can Do
Companies can also facilitate stock purchases through
What the Corporation Can Do
Companies can also facilitate stock purchases through
 Основы управления, планирования, экономики и финансирования здравоохранения. Всемирная организация здравоохранения
 Глобальные проблемы человечества
 Глобальные проблемы человечества
 Экономическая динамика
 Основные фонды и производственные мощности предприятия
 Методы расчета валового внутреннего продукта
 ЕГЭ по Обществознанию.Экономика
 Меркосур. Руководящие органы. Развитие интеграции
 Альтернативні джерела енергії
 Макроэкономика. Система национальных счетов
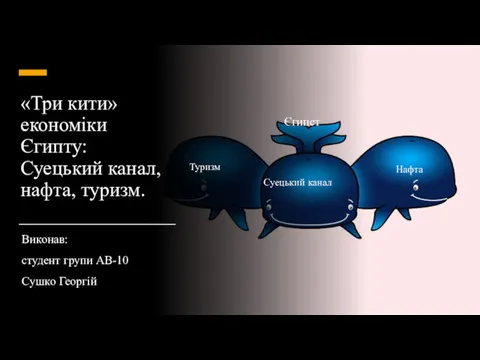 Три кити економіки Єгипту
 О реализации мер по обеспечению доступа негосударственных организаций к предоставлению услуг в социальной сфере
 Предпринимательский всеобуч
 Моделирование социально-экономических процессов в экономике
 Формирование политики доходов населения в Монако
 Модель основанная на не кооперативной стратегии. Модель Курно
 Влияние кризиса 2014-2015 на экономику РФ
 Унікальність економічної системи Китаю
 Цели устойчивого развития в Беларуси
 DeltaSecurity. System to check contractors for reliability to provide economical security of the company
 Стратегии социально-экономического развития макрорегионов РФ
 Глобальные проблемы современности
 Экономика - искусство ведения хозяйства
 Инфляция: сущность, причины, измерение
 Постоянные и переменные затраты
 Теоретические основы оценки финансовой устойчивости предприятия
 Структура советского общества
 Саны экономикалық белсенді халық