- Technical Analysis

Содержание
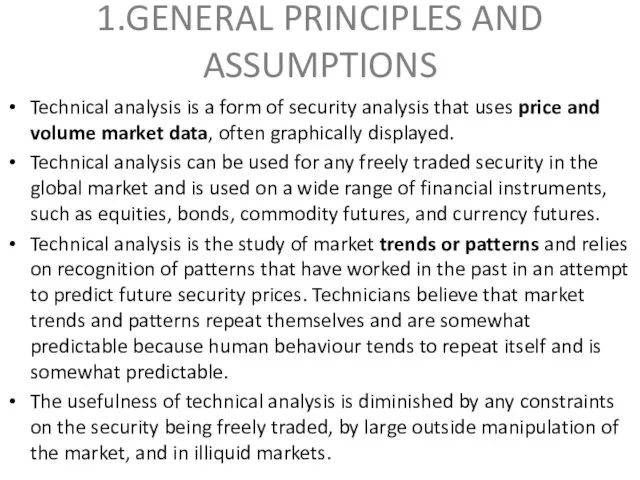
- 2. 1.GENERAL PRINCIPLES AND ASSUMPTIONS Technical analysis is a form of security analysis that uses price and
- 3. Another tenet of technical analysis is that the market brings together the collective wisdom of multiple
- 4. 2.TECHNICAL ANALYSIS TOOLS The primary tools used in technical analysis are charts and indicators. Charts provide
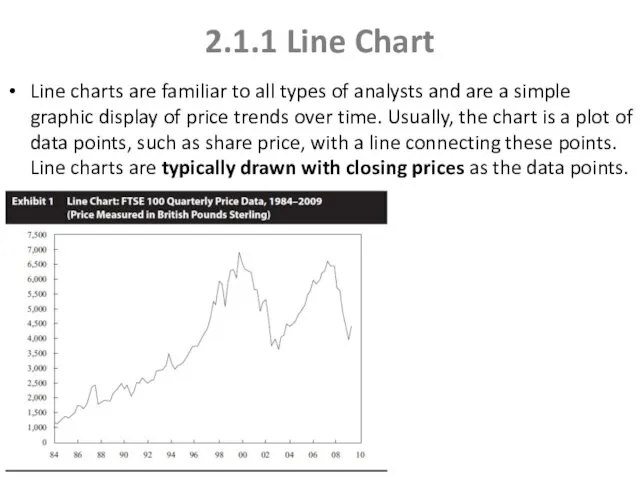
- 5. 2.1.1 Line Chart Line charts are familiar to all types of analysts and are a simple
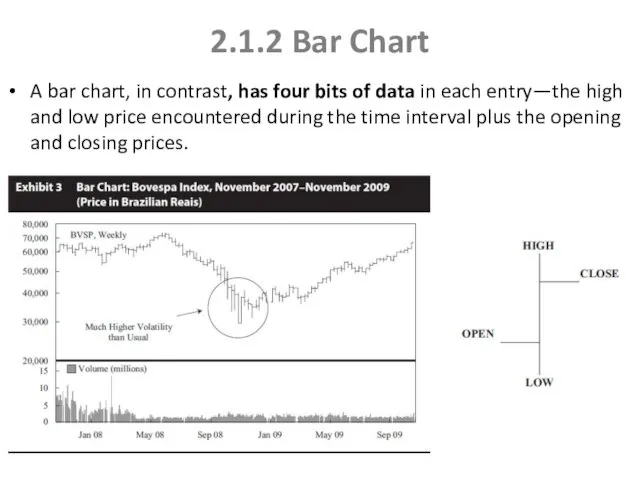
- 6. 2.1.2 Bar Chart A bar chart, in contrast, has four bits of data in each entry—the
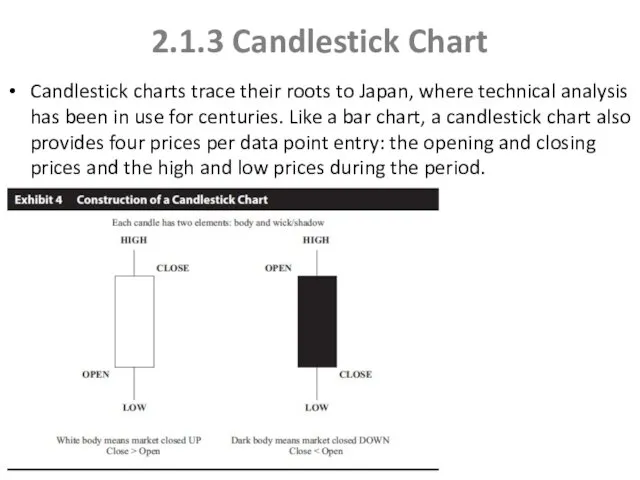
- 7. 2.1.3 Candlestick Chart Candlestick charts trace their roots to Japan, where technical analysis has been in
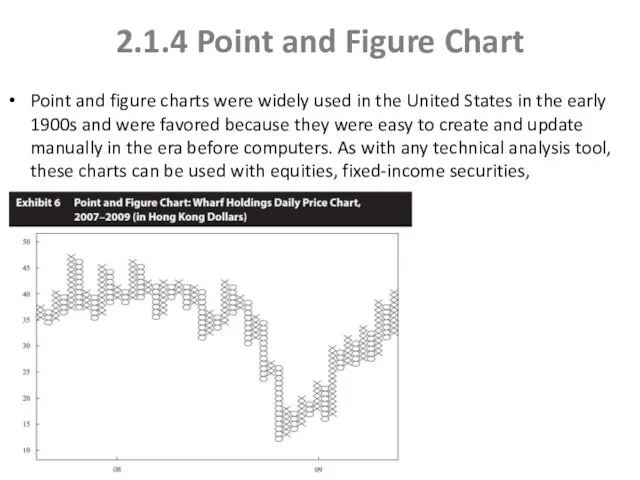
- 8. 2.1.4 Point and Figure Chart Point and figure charts were widely used in the United States
- 9. Volume, Time Intervals Volume is used to assess the strength or conviction of buyers and sellers
- 10. Relative Strength Analysis Relative strength analysis is widely used to compare the performance of a particular
- 11. TREND The concept of a trend is perhaps the most important aspect of technical analysis. Trend
- 12. CHART PATTERNS Chart patterns are formations that appear in price charts that create some type of
- 13. Head and shoulders pattern Volume is an important characteristic in interpreting this pattern. Because head and
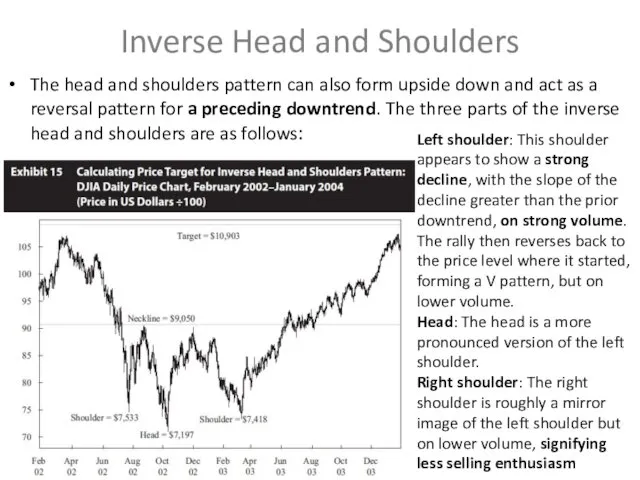
- 14. Inverse Head and Shoulders The head and shoulders pattern can also form upside down and act
- 15. Setting Price Targets with Head and Shoulders Patterns Once the neckline is breached, the security is
- 16. Double Tops A double top is when an uptrend reverses twice at roughly the same high
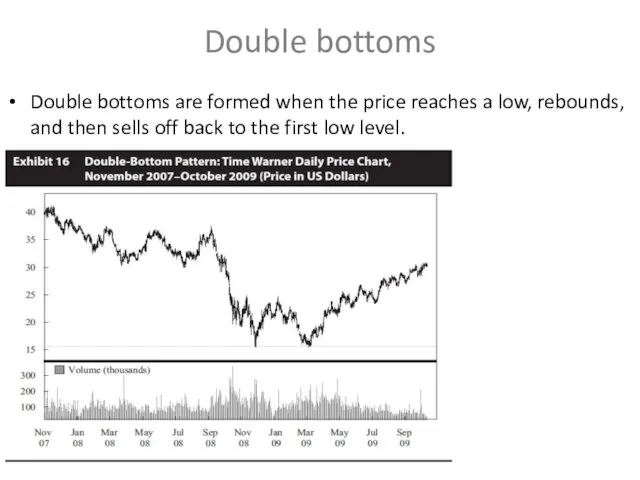
- 17. Double bottoms Double bottoms are formed when the price reaches a low, rebounds, and then sells
- 18. The reason of Double Tops and Bottoms patterns For an uptrend, a double top implies that
- 19. Triple Tops and Bottoms Triple tops consist of three peaks at roughly the same price level,
- 20. Continuation Patterns Continuation patterns indicate that a market trend in place prior to the pattern formation
- 21. Ascending triangles An ascending triangle typically forms in an uptrend. The horizontal line represents sellers taking
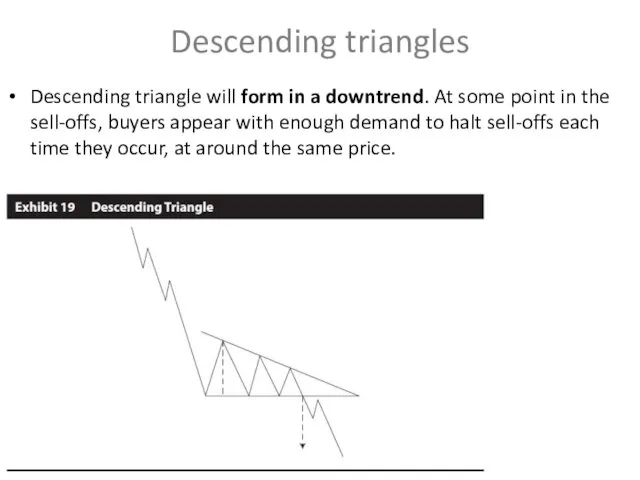
- 22. Descending triangles Descending triangle will form in a downtrend. At some point in the sell-offs, buyers
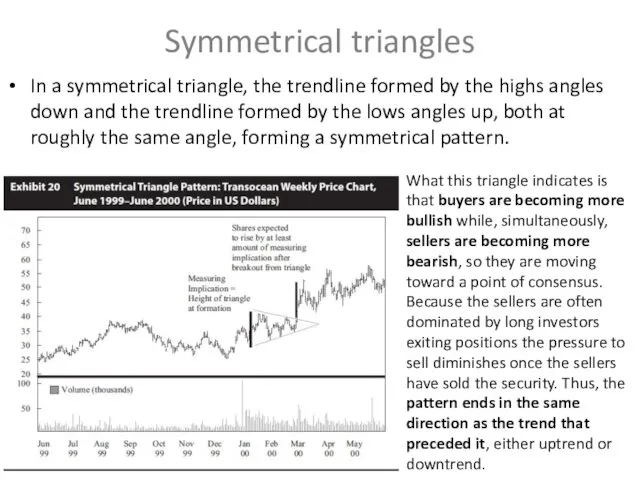
- 23. Symmetrical triangles In a symmetrical triangle, the trendline formed by the highs angles down and the
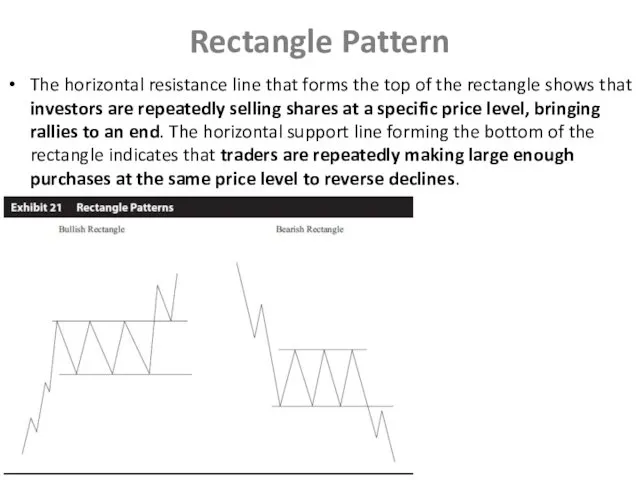
- 24. Rectangle Pattern The horizontal resistance line that forms the top of the rectangle shows that investors
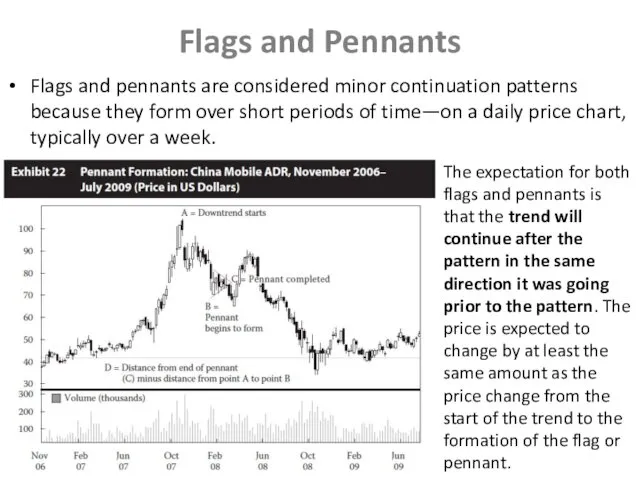
- 25. Flags and Pennants Flags and pennants are considered minor continuation patterns because they form over short
- 26. 2.2 Technical Indicators The technical analyst uses a variety of technical indicators to supplement the information
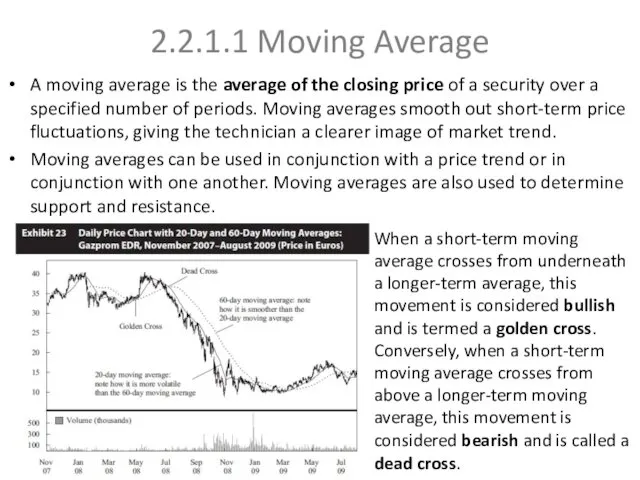
- 27. 2.2.1.1 Moving Average A moving average is the average of the closing price of a security
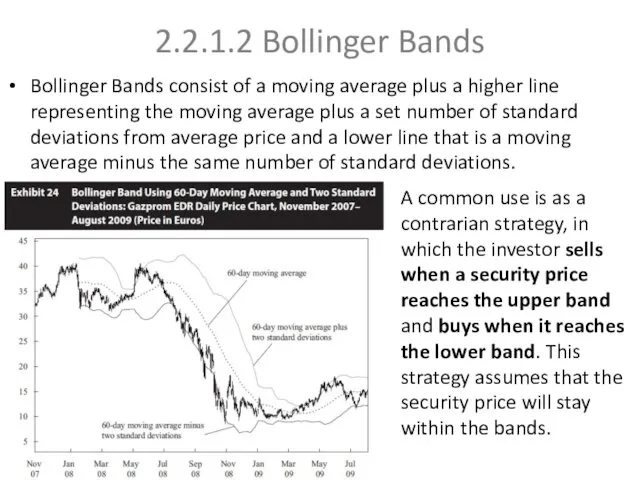
- 28. 2.2.1.2 Bollinger Bands Bollinger Bands consist of a moving average plus a higher line representing the
- 29. 2.2.2 Momentum Oscillators One of the key challenges in using indicators overlaid on a price chart
- 30. 2.2.2.1 Momentum or Rate of Change Oscillator An alternative method of constructing this oscillator is to
- 31. 2.2.2.2Relative Strength Index The index construction forces the RSI to lie within 0 and 100. A
- 32. 2.2.2.3 Stochastic Oscillator The stochastic oscillator is based on the observation that in uptrends, prices tend
- 33. 2.2.2.4 Moving-Average Convergence/Divergence Oscillator The MACD is the difference between a short-term and a long-term moving
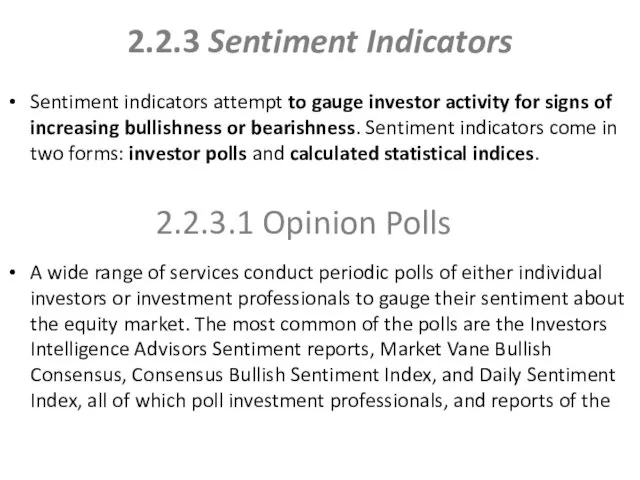
- 34. 2.2.3 Sentiment Indicators Sentiment indicators attempt to gauge investor activity for signs of increasing bullishness or
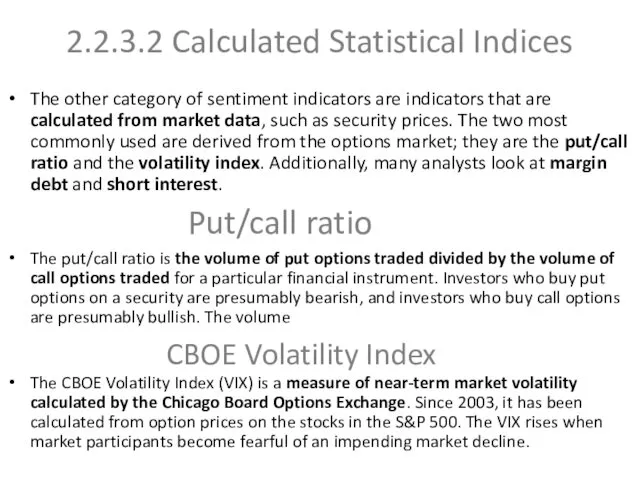
- 35. 2.2.3.2 Calculated Statistical Indices The other category of sentiment indicators are indicators that are calculated from
- 36. Margin debt and Short interest Margin debt is also often used as an indication of sentiment.
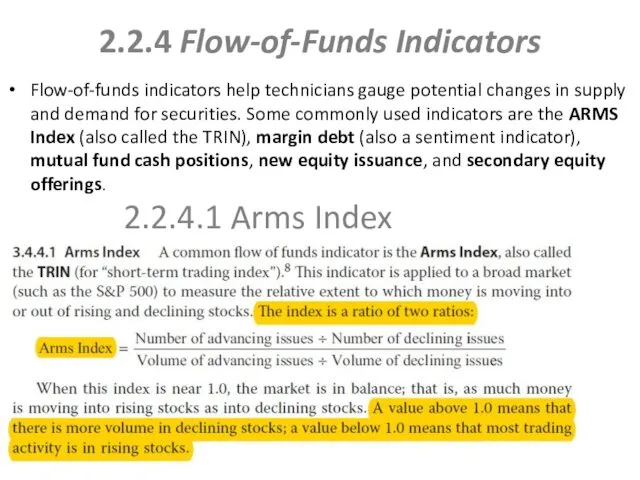
- 37. 2.2.4 Flow-of-Funds Indicators Flow-of-funds indicators help technicians gauge potential changes in supply and demand for securities.
- 38. Margin debt is also widely used as a flow-of-funds indicator because margin loans may increase the
- 39. Putting more shares on the market increases the aggregate supply of shares available for investors to
- 40. INTERMARKET ANALYSIS Intermarket analysis is based on the principle that all markets are interrelated and influence
- 42. Скачать презентацию
1.GENERAL PRINCIPLES AND ASSUMPTIONS
Technical analysis is a form of security analysis
1.GENERAL PRINCIPLES AND ASSUMPTIONS
Technical analysis is a form of security analysis
Another tenet of technical analysis is that the market brings together
Another tenet of technical analysis is that the market brings together
2.TECHNICAL ANALYSIS TOOLS
The primary tools used in technical analysis are charts
2.TECHNICAL ANALYSIS TOOLS
The primary tools used in technical analysis are charts
2.1.1 Line Chart
Line charts are familiar to all types of analysts
2.1.1 Line Chart
Line charts are familiar to all types of analysts
2.1.2 Bar Chart
A bar chart, in contrast, has four bits of
2.1.2 Bar Chart
A bar chart, in contrast, has four bits of
2.1.3 Candlestick Chart
Candlestick charts trace their roots to Japan, where technical
2.1.3 Candlestick Chart
Candlestick charts trace their roots to Japan, where technical
2.1.4 Point and Figure Chart
Point and figure charts were widely used
2.1.4 Point and Figure Chart
Point and figure charts were widely used
Volume, Time Intervals
Volume is used to assess the strength or conviction
Volume, Time Intervals
Volume is used to assess the strength or conviction
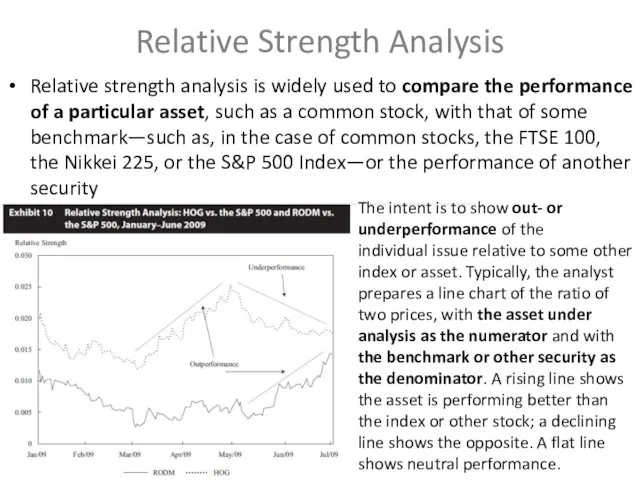
Relative Strength Analysis
Relative strength analysis is widely used to compare the
Relative Strength Analysis
Relative strength analysis is widely used to compare the
TREND
The concept of a trend is perhaps the most important aspect
TREND
The concept of a trend is perhaps the most important aspect
CHART PATTERNS
Chart patterns are formations that appear in price charts that
CHART PATTERNS
Chart patterns are formations that appear in price charts that
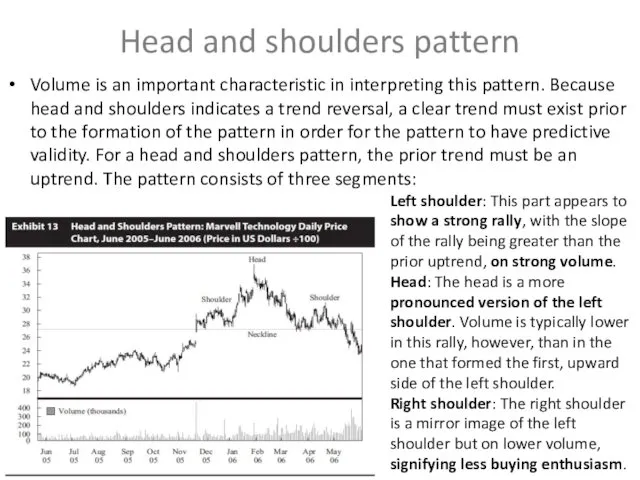
Head and shoulders pattern
Volume is an important characteristic in interpreting this
Head and shoulders pattern
Volume is an important characteristic in interpreting this
Inverse Head and Shoulders
The head and shoulders pattern can also form
Inverse Head and Shoulders
The head and shoulders pattern can also form
Setting Price Targets with Head and Shoulders Patterns
Once the neckline is
Setting Price Targets with Head and Shoulders Patterns
Once the neckline is
Double Tops
A double top is when an uptrend reverses twice at
Double Tops
A double top is when an uptrend reverses twice at
Double bottoms
Double bottoms are formed when the price reaches a low,
Double bottoms
Double bottoms are formed when the price reaches a low,
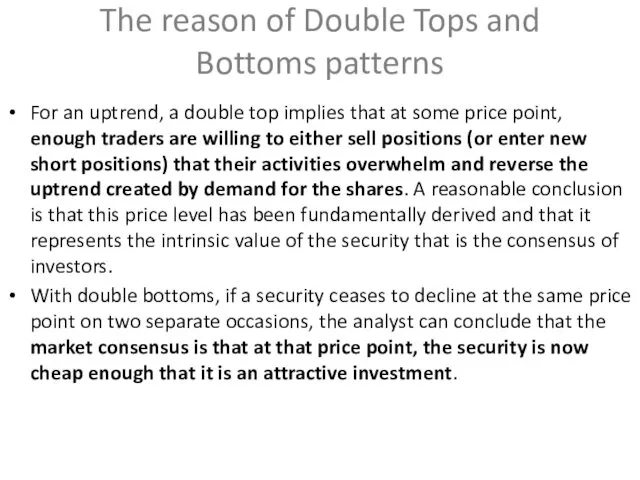
The reason of Double Tops and Bottoms patterns
For an uptrend, a
The reason of Double Tops and Bottoms patterns
For an uptrend, a
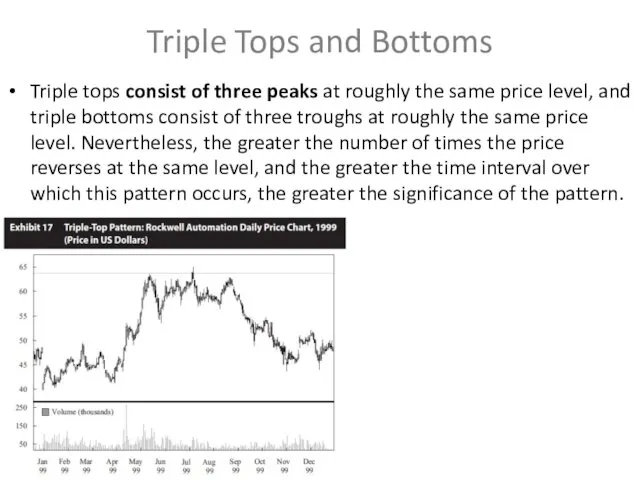
Triple Tops and Bottoms
Triple tops consist of three peaks at roughly
Triple Tops and Bottoms
Triple tops consist of three peaks at roughly
Continuation Patterns
Continuation patterns indicate that a market trend in place prior
Continuation Patterns
Continuation patterns indicate that a market trend in place prior
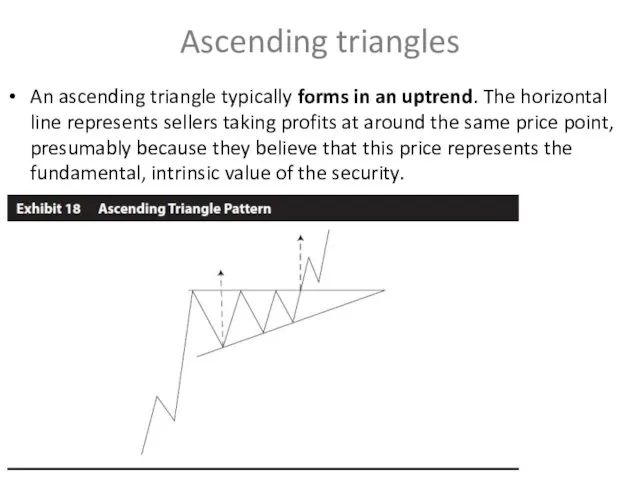
Ascending triangles
An ascending triangle typically forms in an uptrend. The horizontal
Ascending triangles
An ascending triangle typically forms in an uptrend. The horizontal
Descending triangles
Descending triangle will form in a downtrend. At some point
Descending triangles
Descending triangle will form in a downtrend. At some point
Symmetrical triangles
In a symmetrical triangle, the trendline formed by the highs
Symmetrical triangles
In a symmetrical triangle, the trendline formed by the highs
Rectangle Pattern
The horizontal resistance line that forms the top of the
Rectangle Pattern
The horizontal resistance line that forms the top of the
Flags and Pennants
Flags and pennants are considered minor continuation patterns because
Flags and Pennants
Flags and pennants are considered minor continuation patterns because
2.2 Technical Indicators
The technical analyst uses a variety of technical indicators
2.2 Technical Indicators
The technical analyst uses a variety of technical indicators
2.2.1.1 Moving Average
A moving average is the average of the closing
2.2.1.1 Moving Average
A moving average is the average of the closing
2.2.1.2 Bollinger Bands
Bollinger Bands consist of a moving average plus a
2.2.1.2 Bollinger Bands
Bollinger Bands consist of a moving average plus a
2.2.2 Momentum Oscillators
One of the key challenges in using indicators overlaid
2.2.2 Momentum Oscillators
One of the key challenges in using indicators overlaid
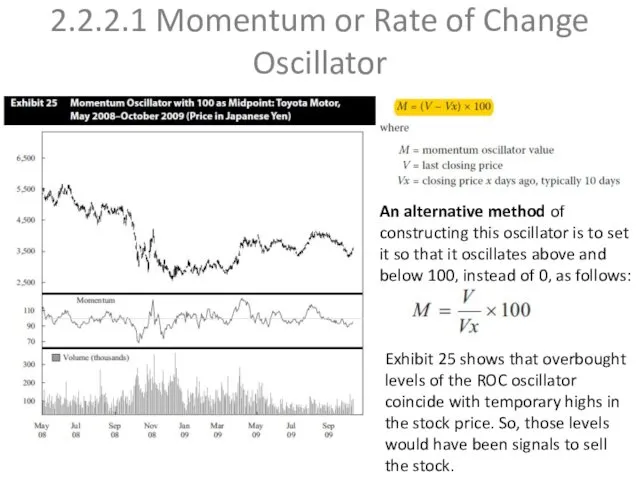
2.2.2.1 Momentum or Rate of Change Oscillator
An alternative method of constructing
2.2.2.1 Momentum or Rate of Change Oscillator
An alternative method of constructing
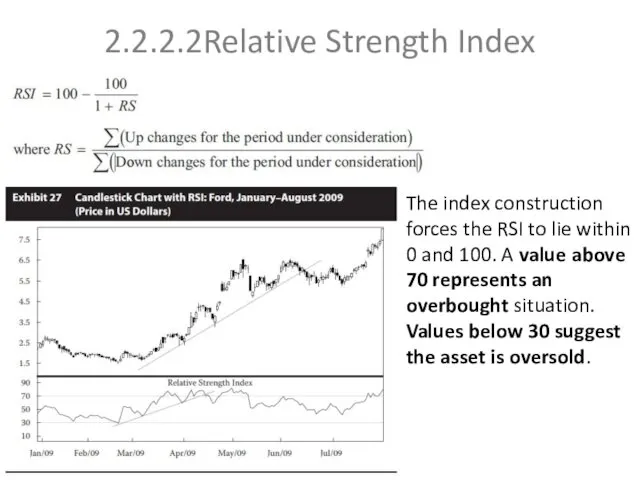
2.2.2.2Relative Strength Index
The index construction forces the RSI to lie within
2.2.2.2Relative Strength Index
The index construction forces the RSI to lie within
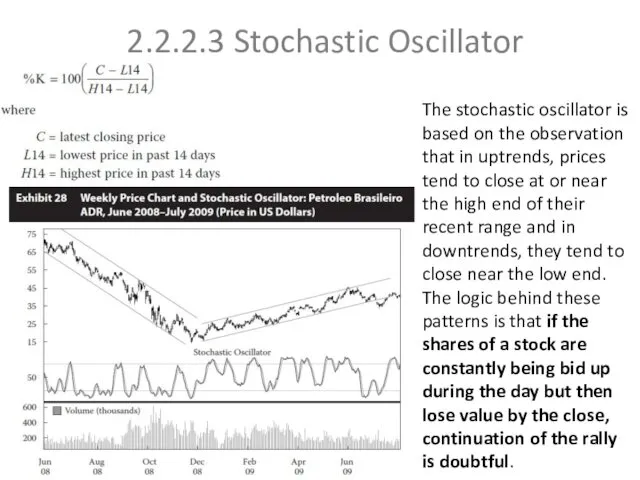
2.2.2.3 Stochastic Oscillator
The stochastic oscillator is based on the observation that
2.2.2.3 Stochastic Oscillator
The stochastic oscillator is based on the observation that
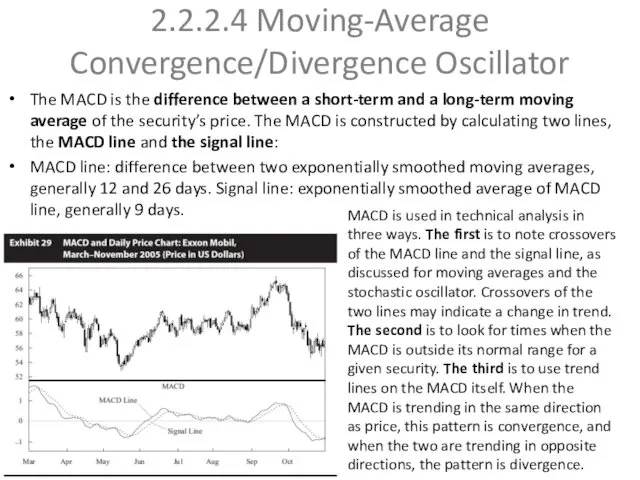
2.2.2.4 Moving-Average Convergence/Divergence Oscillator
The MACD is the difference between a short-term
2.2.2.4 Moving-Average Convergence/Divergence Oscillator
The MACD is the difference between a short-term
2.2.3 Sentiment Indicators
Sentiment indicators attempt to gauge investor activity for signs
2.2.3 Sentiment Indicators
Sentiment indicators attempt to gauge investor activity for signs
2.2.3.2 Calculated Statistical Indices
The other category of sentiment indicators are indicators
2.2.3.2 Calculated Statistical Indices
The other category of sentiment indicators are indicators
Margin debt and Short interest
Margin debt is also often used
Margin debt and Short interest
Margin debt is also often used
2.2.4 Flow-of-Funds Indicators
Flow-of-funds indicators help technicians gauge potential changes in supply
2.2.4 Flow-of-Funds Indicators
Flow-of-funds indicators help technicians gauge potential changes in supply
Margin debt is also widely used as a flow-of-funds indicator because
Margin debt is also widely used as a flow-of-funds indicator because
Putting more shares on the market increases the aggregate supply of
INTERMARKET ANALYSIS
Intermarket analysis is based on the principle that all markets
INTERMARKET ANALYSIS
Intermarket analysis is based on the principle that all markets
 World economics intro
 Изучение динамики социально-экономических явлений
 Голландская болезнь в России 2000-х годов. Негативный эффект, оказываемый укреплением реального курса национальной валюты
 Экономика и ее роль в жизни общества
 Қазақстанның үшінші жаңғыруы: жахандық бəссекеге кабілектіллік
 Экономический анализ. Анализ маркетинговой деятельности предприятия
 Совокупный спрос и совокупное предложение
 Особенности инвестиционной деятельности в Австрии
 Рынок и его функции
 Основные макроэкономические показатели
 Особенности методики школьного экономического образования. (Лекция 2)
 Действие основных экономических законов на фармацевтическом рынке
 Первичный сектор экономики. (8 класс)
 Потребительский рынок
 Economics of innovation. Lecture 3: Innovation, Demand and Consumption
 Тема 7. Кругооборот і оборот капіталу. Лекція 1. Рух капіталу, його стадії і форми. Функціональні форми капіталу
 Формы и методы государственного регулирования
 Теория спроса и предложения
 Экономическое районирование Калужской области
 Основы общественного производства. (Тема 2)
 Евросоюз: начало распада или временные трудности?
 Предмет и методы ЭТ. Базовые экономические категории. Лекция 1
 Сущность прогнозирования и планирования в экономике
 Жүкті қоймалау, жүк тарасы, орау және қайта өңдеу
 Альтернативная стоимость
 Обмен. Виды обмена
 Обеспечение экономической состоятельности организации
 Прогнозирование и планирование сбыта продукции