- The measurement and structure of the national economy. (Chapter 2)

Содержание
- 2. Chapter Outline National Income Accounting: The Measurement of Production, Income, and Expenditure Gross Domestic Product Saving
- 3. National Income Accounting National income accounts: an accounting framework used in measuring current economic activity Three
- 4. National Income Accounting The national income accounts is an accounting framework used in measuring current economic
- 5. National Income Accounting (continued) The income approach measures the incomes received by the producers of output.
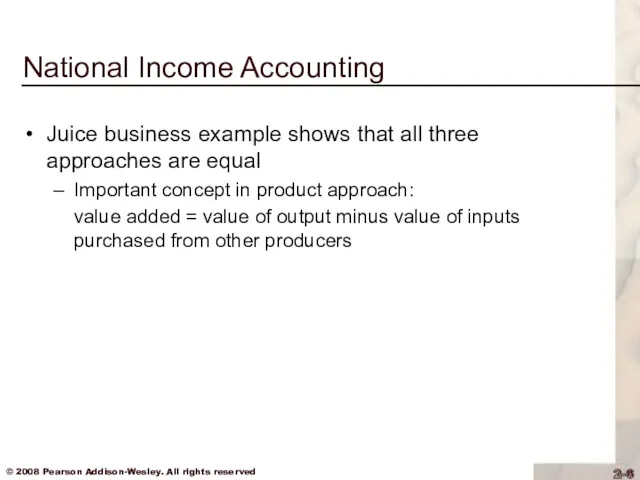
- 6. National Income Accounting Juice business example shows that all three approaches are equal Important concept in
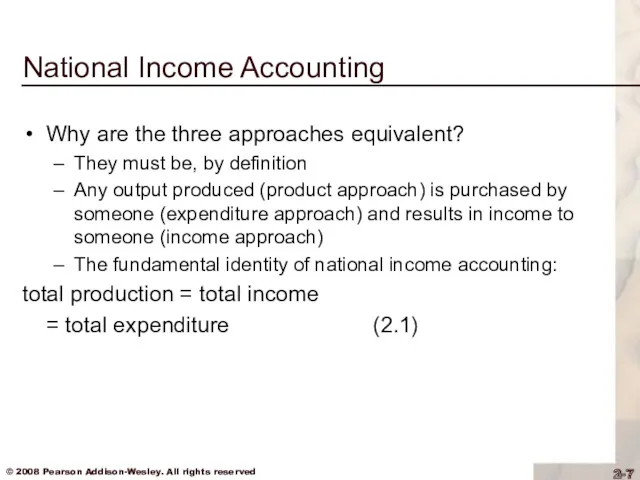
- 7. National Income Accounting Why are the three approaches equivalent? They must be, by definition Any output
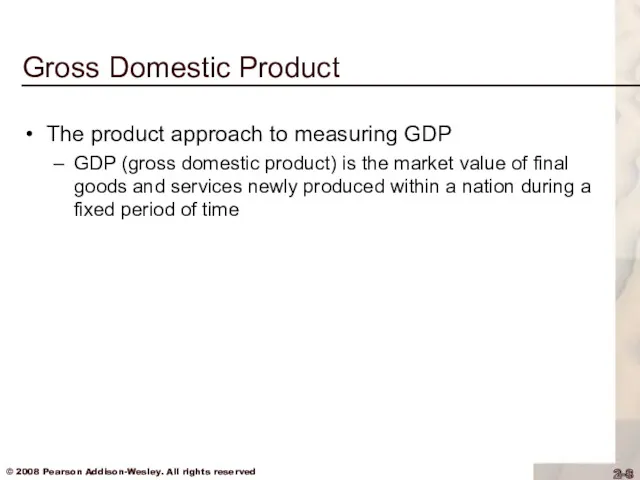
- 8. Gross Domestic Product The product approach to measuring GDP GDP (gross domestic product) is the market
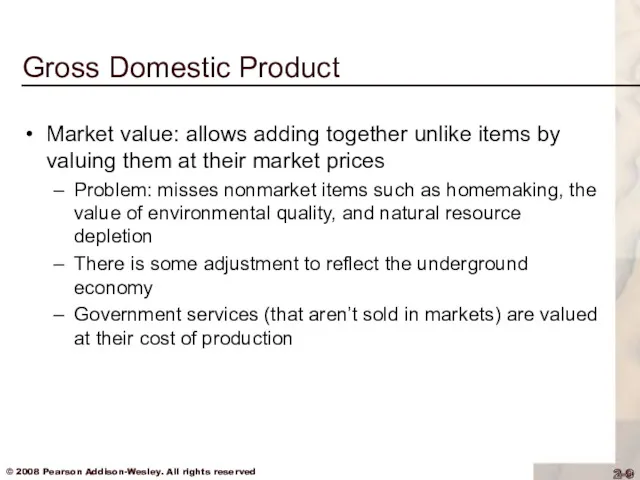
- 9. Gross Domestic Product Market value: allows adding together unlike items by valuing them at their market
- 10. Gross Domestic Product Newly produced: counts only things produced in the given period; excludes things produced
- 11. Gross Domestic Product Final goods and services Don’t count intermediate goods and services (those used up
- 12. Gross Domestic Product Final goods and services Inventory investment (the amount that inventories of unsold finished
- 13. Gross Domestic Product GNP vs. GDP GNP (gross national product) = output produced by domestically owned
- 14. Gross Domestic Product GNP vs. GDP Example: Engineering revenues for a road built by a U.S.
- 15. Gross Domestic Product The expenditure approach to measuring GDP Measures total spending on final goods and
- 16. Gross Domestic Product The expenditure approach to measuring GDP Consumption: spending by domestic households on final
- 17. Gross Domestic Product The expenditure approach to measuring GDP Investment: spending for new capital goods (fixed
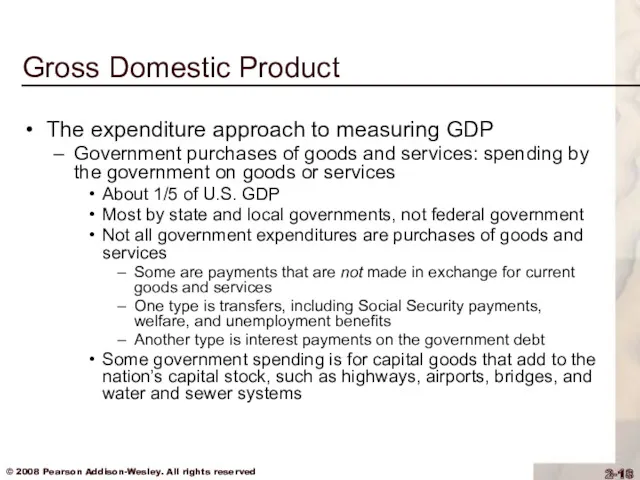
- 18. Gross Domestic Product The expenditure approach to measuring GDP Government purchases of goods and services: spending
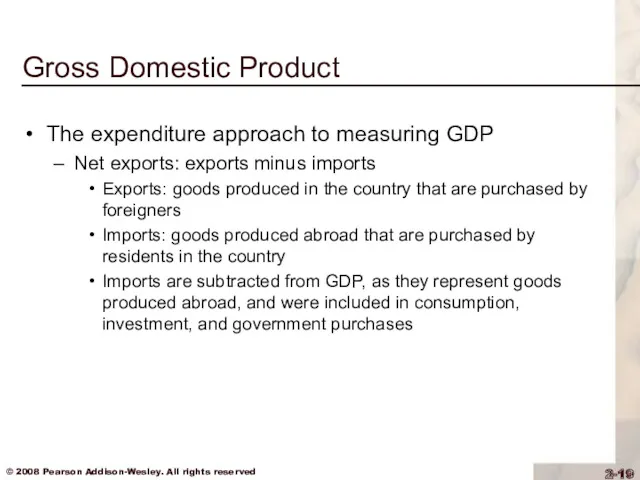
- 19. Gross Domestic Product The expenditure approach to measuring GDP Net exports: exports minus imports Exports: goods
- 20. Table 2.1 Expenditure Approach to Measuring GDP in the United States, 2005
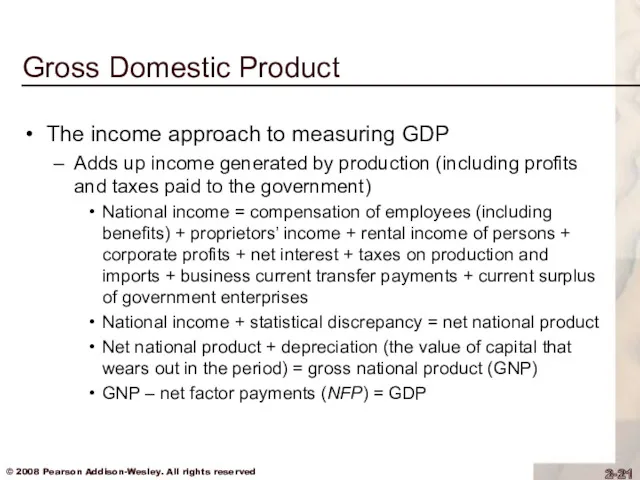
- 21. Gross Domestic Product The income approach to measuring GDP Adds up income generated by production (including
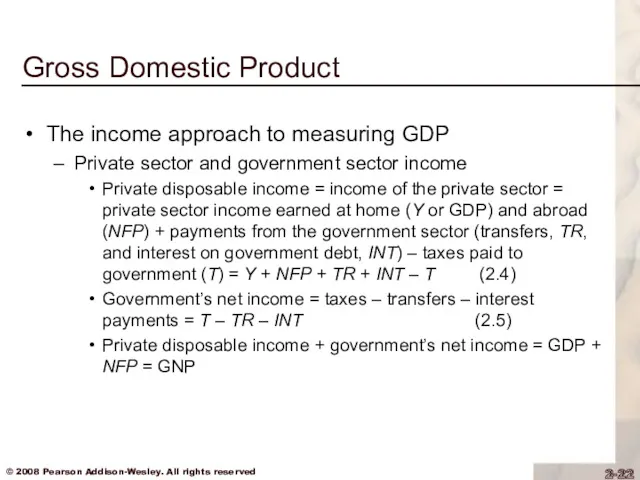
- 22. Gross Domestic Product The income approach to measuring GDP Private sector and government sector income Private
- 23. Table 2.2 Income Approach to Measuring GDP in the United States, 2005
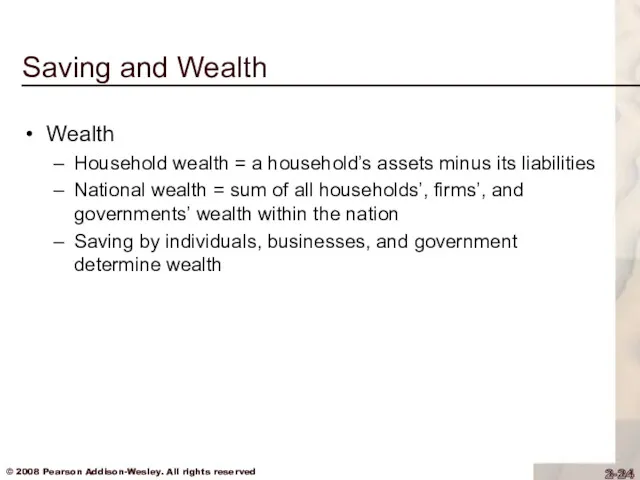
- 24. Saving and Wealth Wealth Household wealth = a household’s assets minus its liabilities National wealth =
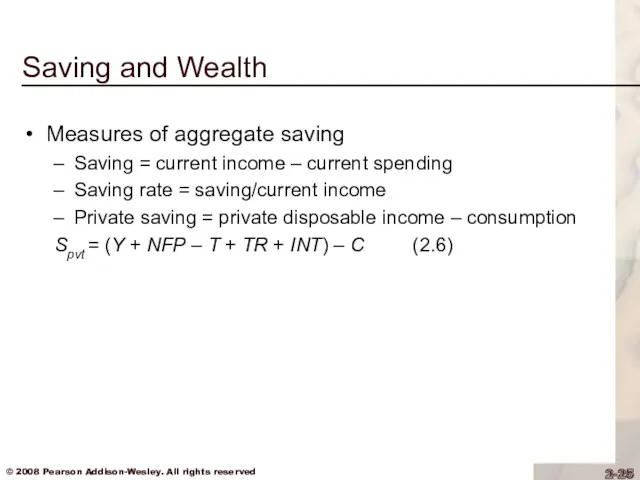
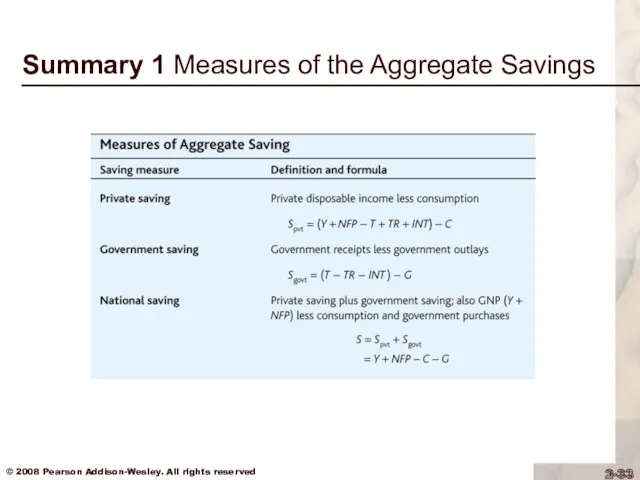
- 25. Saving and Wealth Measures of aggregate saving Saving = current income – current spending Saving rate
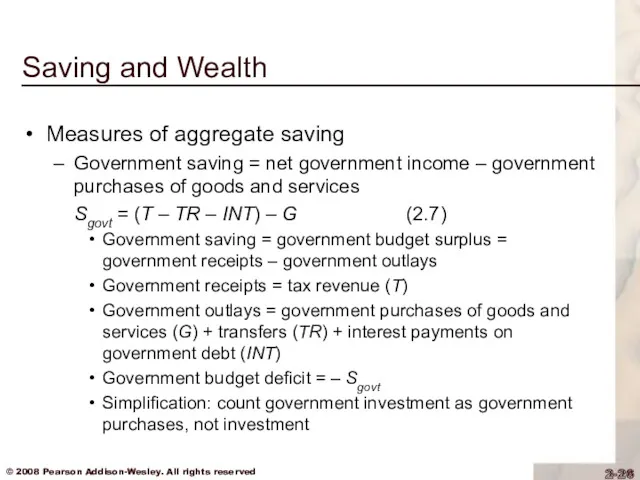
- 26. Saving and Wealth Measures of aggregate saving Government saving = net government income – government purchases
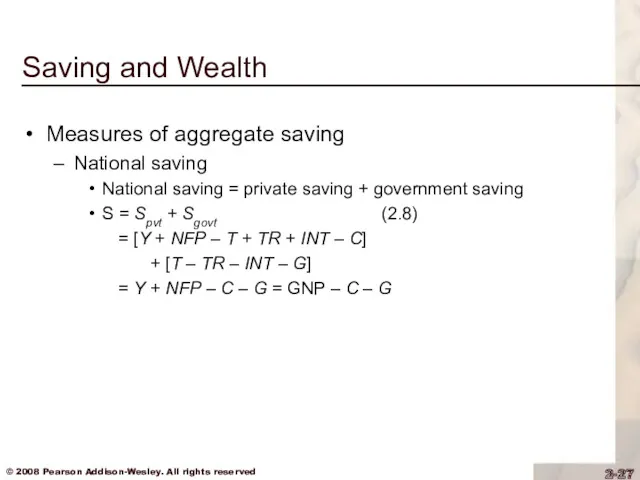
- 27. Saving and Wealth Measures of aggregate saving National saving National saving = private saving + government
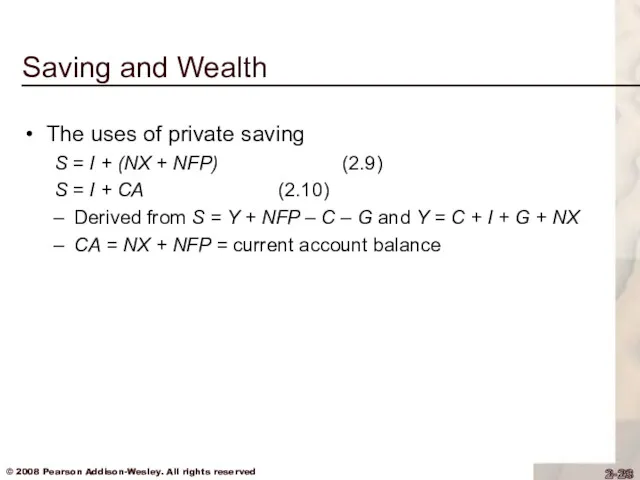
- 28. Saving and Wealth The uses of private saving S = I + (NX + NFP) (2.9)
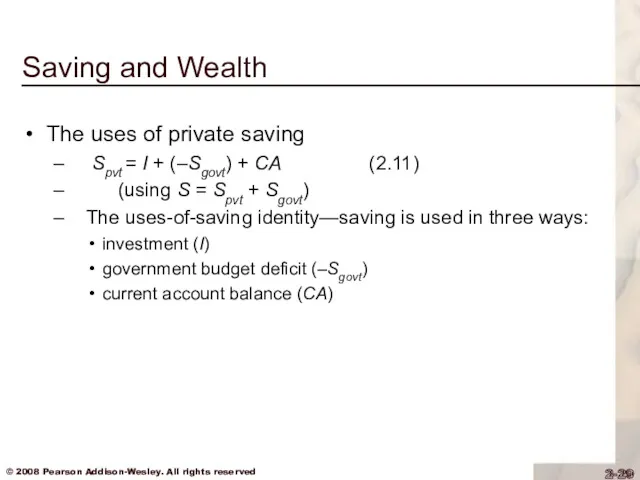
- 29. Saving and Wealth The uses of private saving Spvt = I + (–Sgovt) + CA (2.11)
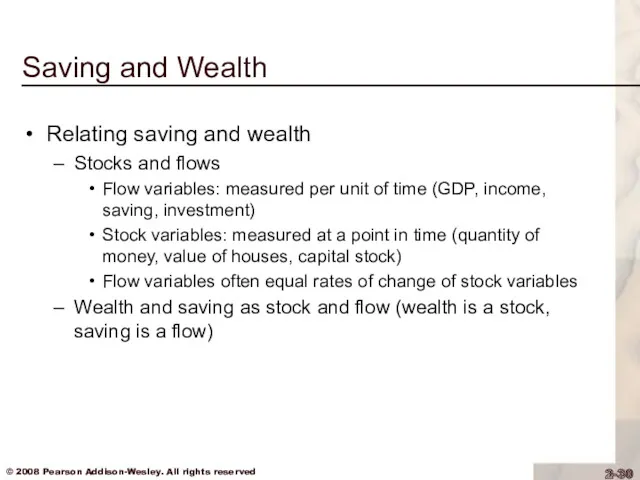
- 30. Saving and Wealth Relating saving and wealth Stocks and flows Flow variables: measured per unit of
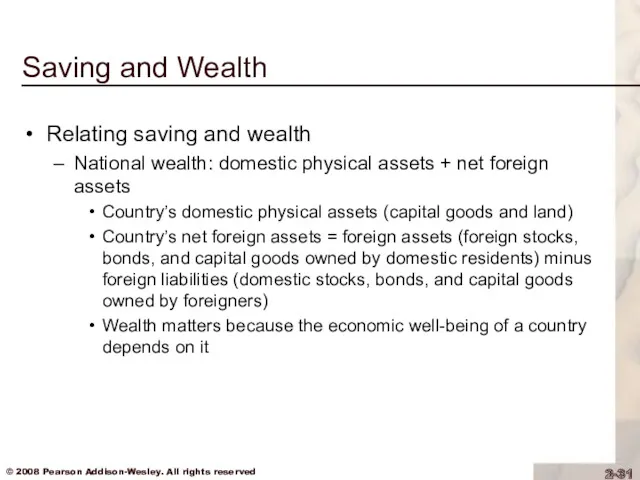
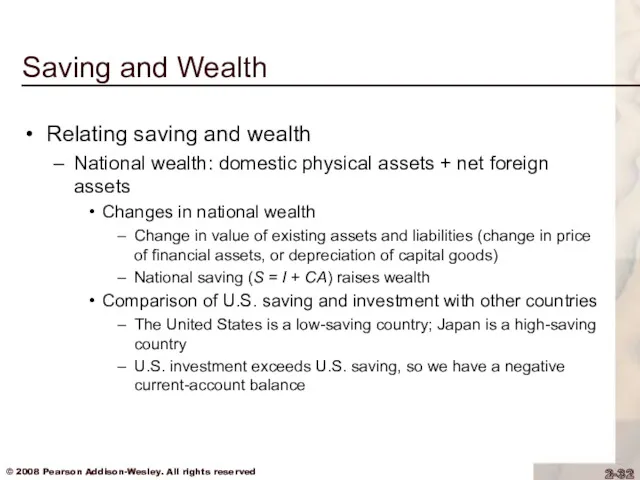
- 31. Saving and Wealth Relating saving and wealth National wealth: domestic physical assets + net foreign assets
- 32. Saving and Wealth Relating saving and wealth National wealth: domestic physical assets + net foreign assets
- 33. Summary 1 Measures of the Aggregate Savings
- 34. Saving and Wealth Application: Wealth Versus Saving The personal saving rate has declined dramatically in recent
- 35. Figure 2.1 Personal Saving Rate, 1947-2006
- 36. Saving and Wealth Application: Wealth Versus Saving We might not need to worry about the decline
- 37. Figure 2.2 Personal Saving Rate Reported by the Government At Different Vintage Dates, 1995-2006
- 38. Saving and Wealth Application: Wealth Versus Saving We might not need to worry about the decline
- 39. Figure 2.3 Annual change in net worth divided by disposable personal income, 1953-2006
- 40. Real GDP, Price Indexes, and Inflation Real GDP Nominal variables are those in dollar terms Problem:
- 41. Real GDP, Price Indexes, and Inflation Real GDP Example of computers and bicycles Nominal GDP is
- 42. Table 2.3 Production and Price Data
- 43. Table 2.4 Calculation of Real Output with Alternative Base Years
- 44. Real GDP, Price Indexes, and Inflation Price Indexes A price index measures the average level of
- 45. Real GDP, Price Indexes, and Inflation Price Indexes Consumer Price Index (CPI) Monthly index of consumer
- 46. Real GDP, Price Indexes, and Inflation Price Indexes Box 2.2 on the computer revolution and chain-weighted
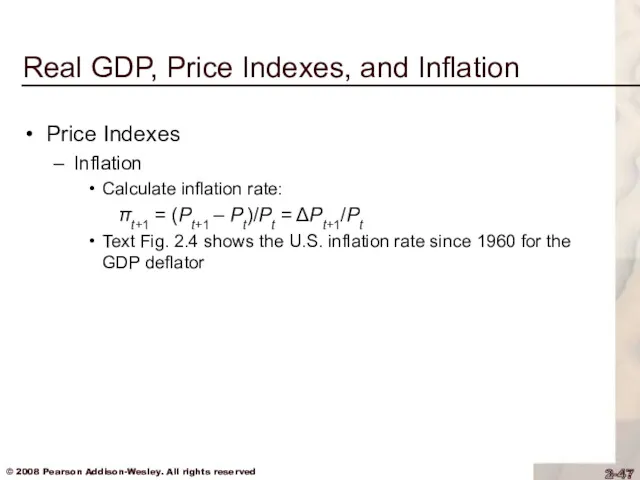
- 47. Real GDP, Price Indexes, and Inflation Price Indexes Inflation Calculate inflation rate: πt+1 = (Pt+1 –
- 48. Figure 2.4 The Inflation Rate in the United States, 1960-2005
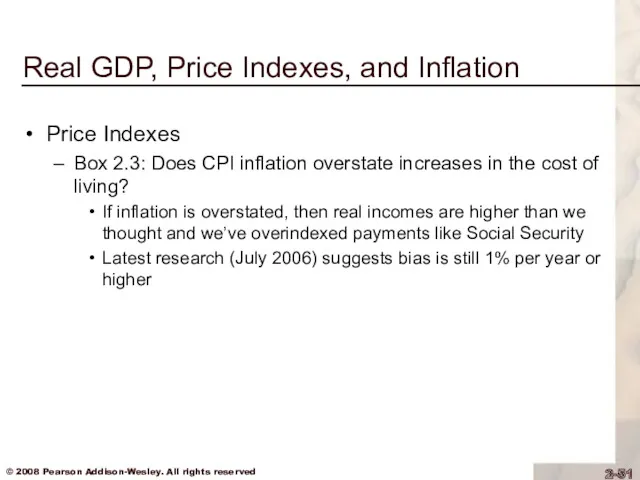
- 49. Real GDP, Price Indexes, and Inflation Price Indexes Box 2.3: Does CPI inflation overstate increases in
- 50. Real GDP, Price Indexes, and Inflation Price Indexes Box 2.3: Does CPI inflation overstate increases in
- 51. Real GDP, Price Indexes, and Inflation Price Indexes Box 2.3: Does CPI inflation overstate increases in
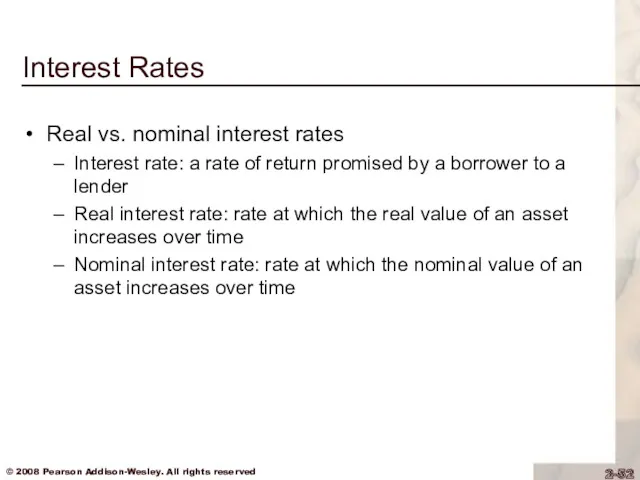
- 52. Interest Rates Real vs. nominal interest rates Interest rate: a rate of return promised by a
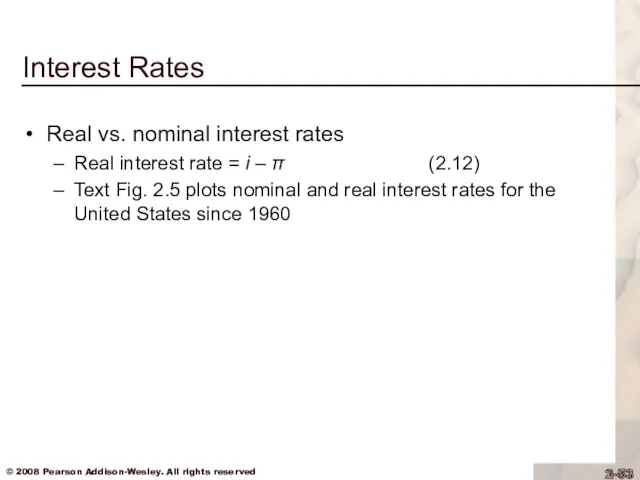
- 53. Interest Rates Real vs. nominal interest rates Real interest rate = i – π (2.12) Text
- 54. Figure 2.5 Nominal and real interest rates in the United States, 1960-2005”
- 56. Скачать презентацию
Chapter Outline
National Income Accounting: The Measurement of Production, Income, and Expenditure
Gross
Chapter Outline
National Income Accounting: The Measurement of Production, Income, and Expenditure
Gross
National Income Accounting
National income accounts: an accounting framework used in measuring
National Income Accounting
National income accounts: an accounting framework used in measuring
National Income Accounting
The national income accounts is an accounting framework used
National Income Accounting
The national income accounts is an accounting framework used
National Income Accounting (continued)
The income approach measures the incomes received by
National Income Accounting (continued)
The income approach measures the incomes received by
National Income Accounting
Juice business example shows that all three approaches are
National Income Accounting
Juice business example shows that all three approaches are
National Income Accounting
Why are the three approaches equivalent?
They must be, by
National Income Accounting
Why are the three approaches equivalent?
They must be, by
Gross Domestic Product
The product approach to measuring GDP
GDP (gross domestic product)
Gross Domestic Product
The product approach to measuring GDP
GDP (gross domestic product)
Gross Domestic Product
Market value: allows adding together unlike items by valuing
Gross Domestic Product
Market value: allows adding together unlike items by valuing
Gross Domestic Product
Newly produced: counts only things produced in the given
Gross Domestic Product
Newly produced: counts only things produced in the given
Gross Domestic Product
Final goods and services
Don’t count intermediate goods and services
Gross Domestic Product
Final goods and services
Don’t count intermediate goods and services
Gross Domestic Product
Final goods and services
Inventory investment (the amount that inventories
Gross Domestic Product
Final goods and services
Inventory investment (the amount that inventories
Gross Domestic Product
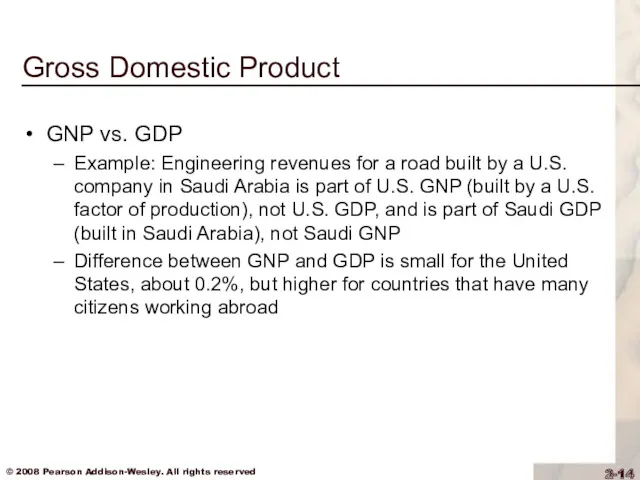
GNP vs. GDP
GNP (gross national product) = output produced
Gross Domestic Product
GNP vs. GDP
GNP (gross national product) = output produced
Gross Domestic Product
GNP vs. GDP
Example: Engineering revenues for a road built
Gross Domestic Product
GNP vs. GDP
Example: Engineering revenues for a road built
Gross Domestic Product
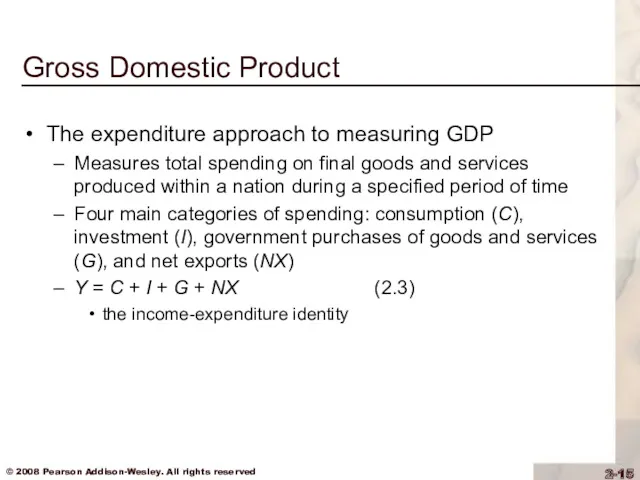
The expenditure approach to measuring GDP
Measures total spending on
Gross Domestic Product
The expenditure approach to measuring GDP
Measures total spending on
Gross Domestic Product
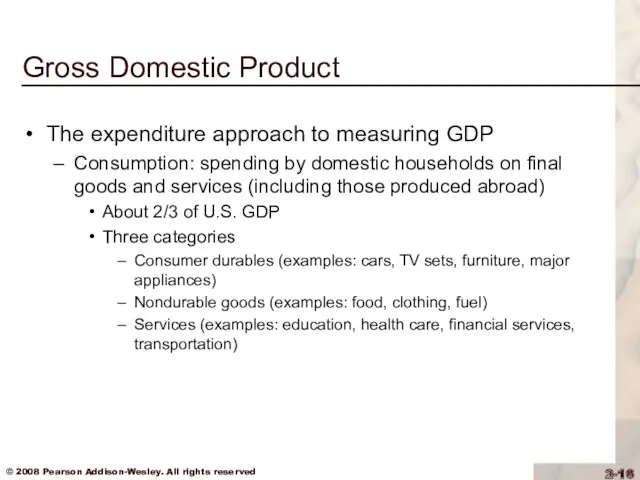
The expenditure approach to measuring GDP
Consumption: spending by domestic
Gross Domestic Product
The expenditure approach to measuring GDP
Consumption: spending by domestic
Gross Domestic Product
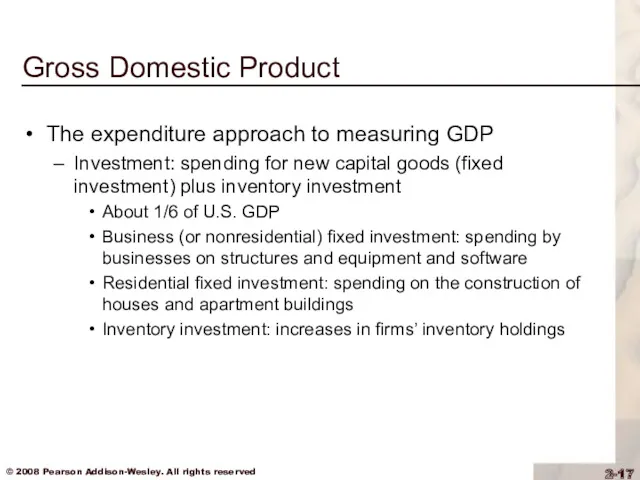
The expenditure approach to measuring GDP
Investment: spending for new
Gross Domestic Product
The expenditure approach to measuring GDP
Investment: spending for new
Gross Domestic Product
The expenditure approach to measuring GDP
Government purchases of goods
Gross Domestic Product
The expenditure approach to measuring GDP
Government purchases of goods
Gross Domestic Product
The expenditure approach to measuring GDP
Net exports: exports minus
Gross Domestic Product
The expenditure approach to measuring GDP
Net exports: exports minus
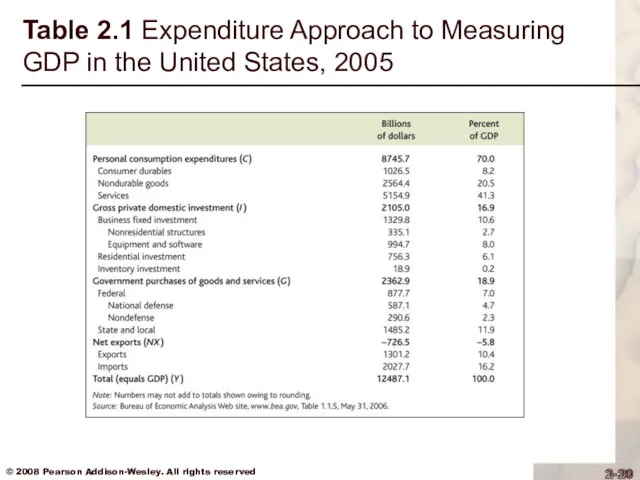
Table 2.1 Expenditure Approach to Measuring GDP in the United States,
Table 2.1 Expenditure Approach to Measuring GDP in the United States,
Gross Domestic Product
The income approach to measuring GDP
Adds up income generated
Gross Domestic Product
The income approach to measuring GDP
Adds up income generated
Gross Domestic Product
The income approach to measuring GDP
Private sector and government
Gross Domestic Product
The income approach to measuring GDP
Private sector and government
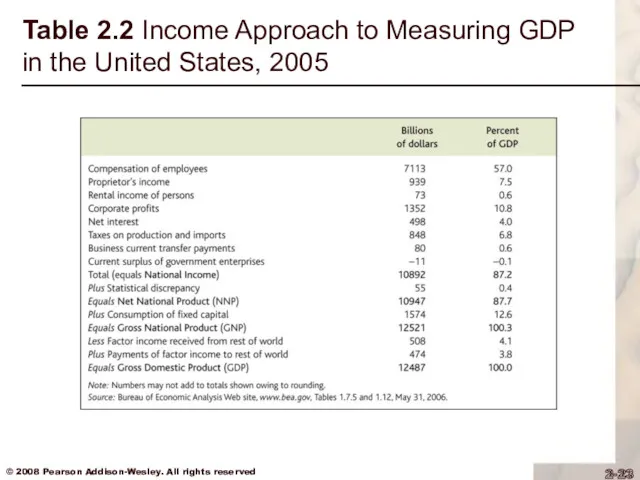
Table 2.2 Income Approach to Measuring GDP in the United States,
Table 2.2 Income Approach to Measuring GDP in the United States,
Saving and Wealth
Wealth
Household wealth = a household’s assets minus its
Saving and Wealth
Wealth
Household wealth = a household’s assets minus its
Saving and Wealth
Measures of aggregate saving
Saving = current income – current
Saving and Wealth
Measures of aggregate saving
Saving = current income – current
Saving and Wealth
Measures of aggregate saving
Government saving = net government income
Saving and Wealth
Measures of aggregate saving
Government saving = net government income
Saving and Wealth
Measures of aggregate saving
National saving
National saving = private saving
Saving and Wealth
Measures of aggregate saving
National saving
National saving = private saving
Saving and Wealth
The uses of private saving
S = I + (NX
Saving and Wealth
The uses of private saving
S = I + (NX
Saving and Wealth
The uses of private saving
Spvt = I +
Saving and Wealth
The uses of private saving
Spvt = I +
Saving and Wealth
Relating saving and wealth
Stocks and flows
Flow variables: measured per
Saving and Wealth
Relating saving and wealth
Stocks and flows
Flow variables: measured per
Saving and Wealth
Relating saving and wealth
National wealth: domestic physical assets +
Saving and Wealth
Relating saving and wealth
National wealth: domestic physical assets +
Saving and Wealth
Relating saving and wealth
National wealth: domestic physical assets +
Saving and Wealth
Relating saving and wealth
National wealth: domestic physical assets +
Summary 1 Measures of the Aggregate Savings
Summary 1 Measures of the Aggregate Savings
Saving and Wealth
Application: Wealth Versus Saving
The personal saving rate has declined
Saving and Wealth
Application: Wealth Versus Saving
The personal saving rate has declined
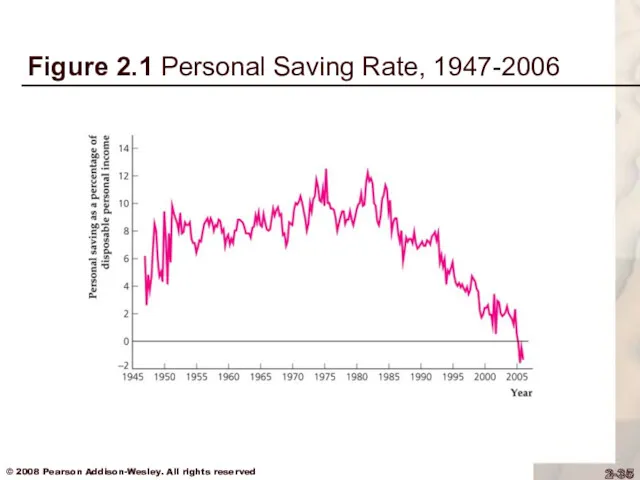
Figure 2.1 Personal Saving Rate, 1947-2006
Figure 2.1 Personal Saving Rate, 1947-2006
Saving and Wealth
Application: Wealth Versus Saving
We might not need to worry
Saving and Wealth
Application: Wealth Versus Saving
We might not need to worry
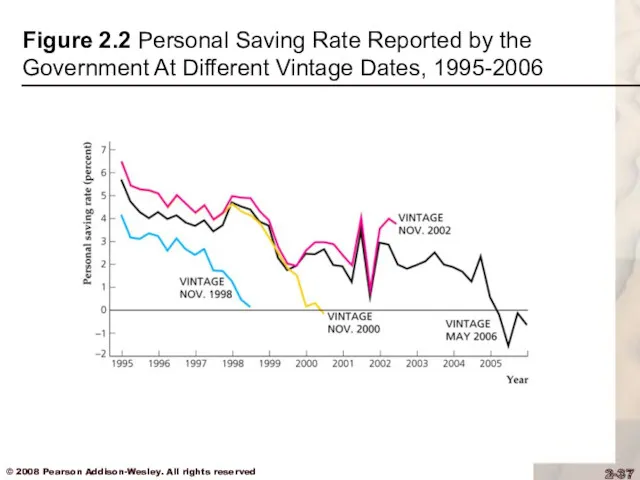
Figure 2.2 Personal Saving Rate Reported by the Government At Different
Figure 2.2 Personal Saving Rate Reported by the Government At Different

Saving and Wealth
Application: Wealth Versus Saving
We might not need to worry
Saving and Wealth
Application: Wealth Versus Saving
We might not need to worry
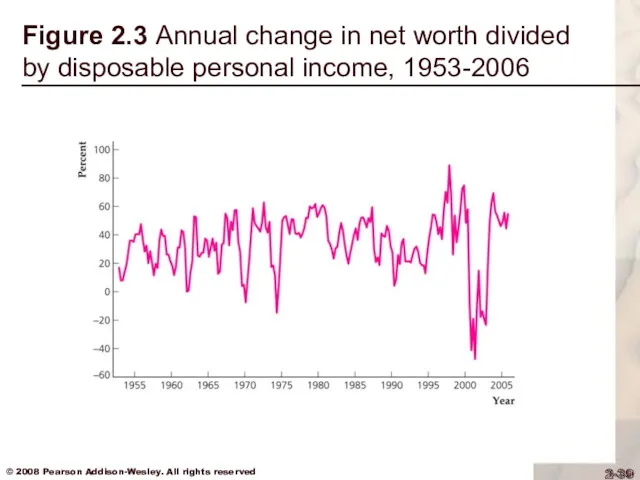
Figure 2.3 Annual change in net worth divided by disposable personal
Figure 2.3 Annual change in net worth divided by disposable personal
Real GDP, Price Indexes, and Inflation
Real GDP
Nominal variables are those
Real GDP, Price Indexes, and Inflation
Real GDP
Nominal variables are those
Real GDP, Price Indexes, and Inflation
Real GDP
Example of computers and
Real GDP, Price Indexes, and Inflation
Real GDP
Example of computers and
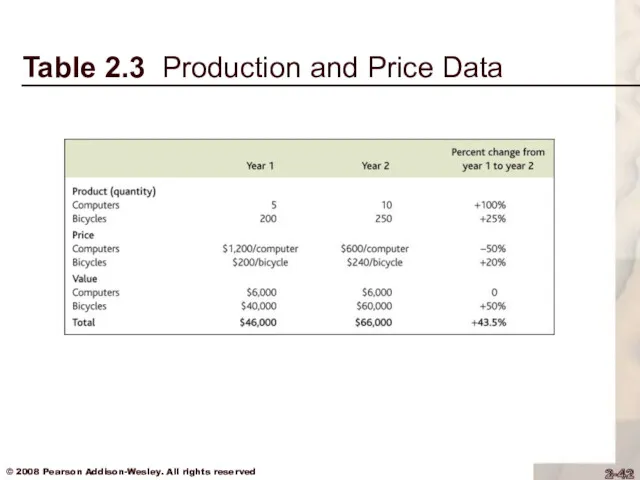
Table 2.3 Production and Price Data
Table 2.3 Production and Price Data
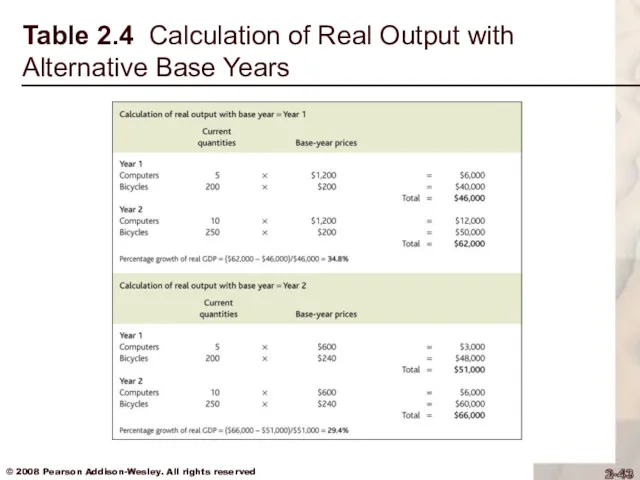
Table 2.4 Calculation of Real Output with Alternative Base Years
Table 2.4 Calculation of Real Output with Alternative Base Years
Real GDP, Price Indexes, and Inflation
Price Indexes
A price index
Real GDP, Price Indexes, and Inflation
Price Indexes
A price index
Real GDP, Price Indexes, and Inflation
Price Indexes
Consumer Price Index
Real GDP, Price Indexes, and Inflation
Price Indexes
Consumer Price Index
Real GDP, Price Indexes, and Inflation
Price Indexes
Box 2.2 on
Real GDP, Price Indexes, and Inflation
Price Indexes
Box 2.2 on
Real GDP, Price Indexes, and Inflation
Price Indexes
Inflation
Calculate inflation rate:
Real GDP, Price Indexes, and Inflation
Price Indexes
Inflation
Calculate inflation rate:
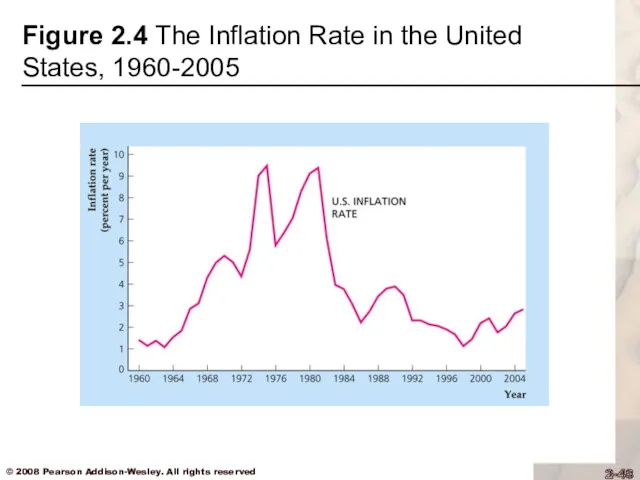
Figure 2.4 The Inflation Rate in the United States, 1960-2005
Figure 2.4 The Inflation Rate in the United States, 1960-2005
Real GDP, Price Indexes, and Inflation
Price Indexes
Box 2.3: Does
Real GDP, Price Indexes, and Inflation
Price Indexes
Box 2.3: Does
Real GDP, Price Indexes, and Inflation
Price Indexes
Box 2.3: Does
Real GDP, Price Indexes, and Inflation
Price Indexes
Box 2.3: Does
Real GDP, Price Indexes, and Inflation
Price Indexes
Box 2.3: Does
Real GDP, Price Indexes, and Inflation
Price Indexes
Box 2.3: Does
Interest Rates
Real vs. nominal interest rates
Interest rate: a rate of
Interest Rates
Real vs. nominal interest rates
Interest rate: a rate of
Interest Rates
Real vs. nominal interest rates
Real interest rate = i
Interest Rates
Real vs. nominal interest rates
Real interest rate = i
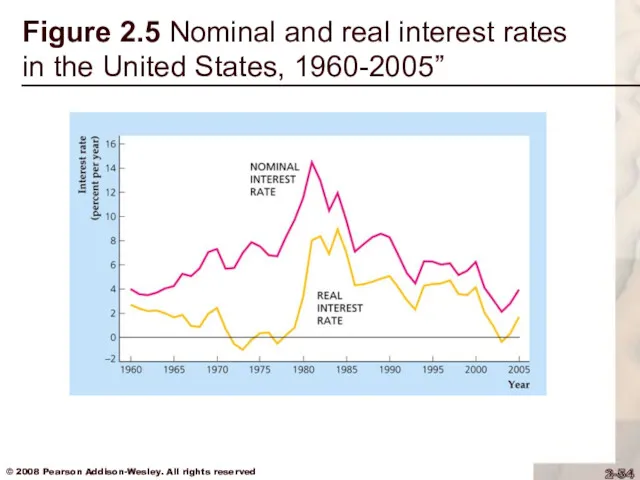
Figure 2.5 Nominal and real interest rates in the United States,
Figure 2.5 Nominal and real interest rates in the United States,
 Лекция_презентация_Материальные ресурсы_Нематериальные активы
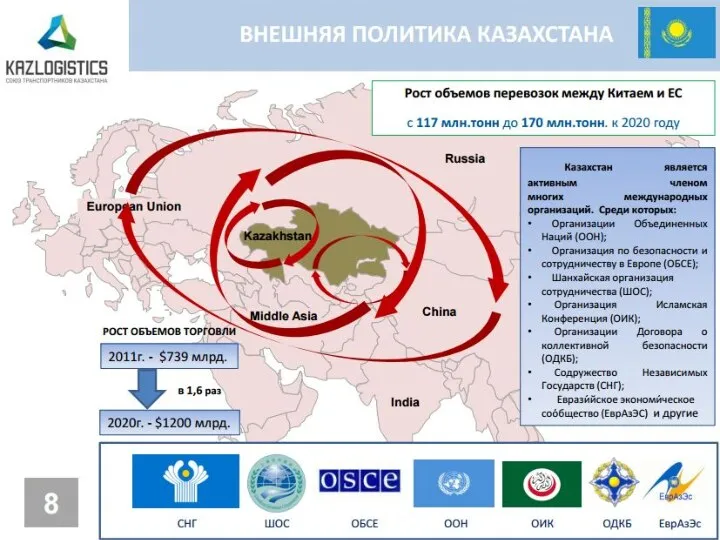 Внешняя политика Казахстана
 Прогнозирование и государственное регулирование цен и инфляции
 Globalization
 Основные макроэкономические показатели и макроэкономическое равновесие
 Введение в макроэкономику. Макроэкономические показатели. Макроэкономика и ее основные проблемы
 Диагностика и прогнозирование угроз промышленного предприятия
 Рыночные отношения в экономике
 Новые явления в экономике России 17 века
 Рынки факторов производства. Лекция 5
 Внешнеэкономическая деятельность Забайкальского края в условиях ограниченных государственных инвестиций
 Анализ использования основного капитала предприятия
 Анализ формирования и использования прибыли и оценки рентабельности предприятия (предприятие ООО Золотая балка)
 Социально-экономическое развитие стран мира. Ранжирование стран мира по различным социально-экономическим показателям. Урок 37
 Фінансові послуги
 Институционализм
 Қазақстан Республикасының Президенті – Елбасы Н.Ә. Назарбаевтың
 Социальная защита безработных
 Климат и бедность. Экономические оценки России
 Модель Кагана
 Информационные системы в экономике
 Анализ эффективности деятельности предприятия
 Регион как субъект устойчивого развития
 Международная миграция рабочей силы
 Порядок организации экспортного контроля
 Ресурсы хозяйствующих субъектов и эффективность их использования
 Ценовая эластичность спроса. Эластичность спроса и доход производителей
 Тіньовий сектор в економічному відтворенні