- World economics: Modern Factors of Economic Growth and Economic Development

Содержание
- 2. FACTORS THAT AFFECT ECONOMIC GROWTH Natural Resources. The discovery of more natural resources like oil, or
- 3. FACTORS THAT AFFECT ECONOMIC GROWTH Human Capital. An increase in investment in human capital can improve
- 4. FACTORS THAT LIMIT ECONOMIC GROWTH Poor health and low levels of education. People who don’t have
- 5. FACTORS OF ECONOMIC GROWTH Boom and Bust Business Cycles. If economic growth is high-speed and inflationary,
- 6. HOFSTEDE-INSIGHTS Power Distance is defined as the extent to which the less powerful members of institutions
- 7. PATH DEPENDENCY Path dependency is an idea that tries to explain the continued use of a
- 8. MIDDLE CLASS Different, partly overlapping concepts of ‘class’ Statistical partitioning of distribution in discrete, partly arbitrary,
- 9. MIDDLE CLASS no single OECD definition of the ‘middle-class’ analogue that what we use for income
- 10. MIDDLE CLASS DEPENDS ON EARNINGS AS MAIN INCOME SOURCE
- 11. INCREASINGLY DUAL-EARNINGS HOUSEHOLDS
- 12. PREDOMINANTLY PRIME-AGED (WITH CHILDREN)
- 13. SIGNIFICANTLY CHANGES IN THE US (LOWER) AND SPAIN (HIGHER), SMALLER CHANGES ELSEWHERE
- 14. ‘Middle class’ is a political construct, used to convey images of greater contiguity with upper classes
- 15. FINANCIAL CRISES The amount of subprime mortgage debt, which was guaranteed by Freddie Mac and Fannie
- 16. THE GREAT RECESSION The Great Recession is a term that represents the sharp decline in economic
- 17. BEFORE GREAT RECESSION The investment banks, looking for easy profits in the wake of the dotcom
- 18. DOTCOM BUBBLE The dotcom bubble occurred in the late 1990s and was characterized by a rapid
- 19. LESSONS Originators need to be "incentivized" to make loans to high-quality borrowers and to monitor loan
- 20. EIU GLOBAL FORECAST - HIGHER INTEREST RATES ARE COMING The US economy will continue to motor
- 21. DEVELOPED WORLD The US economy is in good shape, and we have revised up economic growth
- 22. EMERGING MARKETS Conditions for emerging markets to become more challenging in the first half of the
- 23. EMERGING MARKETS The ongoing economic recovery in Latin America is forecast to gather momentum in 2018‑19,
- 24. EXCHANGE RATES The US dollar has continued to depreciate in early 2018, in spite of solid
- 25. COMMODITIES The price of crude oil is likely to remain range-bound, at US$60‑70/barrel in 2018‑19 for
- 26. WORLD ECONOMY: FORECAST SUMMARY
- 28. Скачать презентацию

FACTORS THAT AFFECT ECONOMIC GROWTH
Natural Resources. The discovery of more natural
FACTORS THAT AFFECT ECONOMIC GROWTH
Natural Resources. The discovery of more natural

FACTORS THAT AFFECT ECONOMIC GROWTH
Human Capital. An increase in investment in
FACTORS THAT AFFECT ECONOMIC GROWTH
Human Capital. An increase in investment in

FACTORS THAT LIMIT ECONOMIC GROWTH
Poor health and low levels of education.
FACTORS THAT LIMIT ECONOMIC GROWTH
Poor health and low levels of education.

FACTORS OF ECONOMIC GROWTH
Boom and Bust Business Cycles. If economic growth
FACTORS OF ECONOMIC GROWTH
Boom and Bust Business Cycles. If economic growth

HOFSTEDE-INSIGHTS
Power Distance is defined as the extent to which the less
HOFSTEDE-INSIGHTS
Power Distance is defined as the extent to which the less

PATH DEPENDENCY
Path dependency is an idea that tries to explain the
PATH DEPENDENCY
Path dependency is an idea that tries to explain the

MIDDLE CLASS
Different, partly overlapping concepts of ‘class’
Statistical partitioning of distribution
MIDDLE CLASS
Different, partly overlapping concepts of ‘class’
Statistical partitioning of distribution

MIDDLE CLASS
no single OECD definition of the ‘middle-class’ analogue that what
MIDDLE CLASS
no single OECD definition of the ‘middle-class’ analogue that what

MIDDLE CLASS DEPENDS ON EARNINGS AS MAIN INCOME SOURCE
MIDDLE CLASS DEPENDS ON EARNINGS AS MAIN INCOME SOURCE

INCREASINGLY DUAL-EARNINGS HOUSEHOLDS
INCREASINGLY DUAL-EARNINGS HOUSEHOLDS

PREDOMINANTLY PRIME-AGED (WITH CHILDREN)
PREDOMINANTLY PRIME-AGED (WITH CHILDREN)

SIGNIFICANTLY CHANGES IN THE US (LOWER) AND SPAIN (HIGHER), SMALLER CHANGES
SIGNIFICANTLY CHANGES IN THE US (LOWER) AND SPAIN (HIGHER), SMALLER CHANGES

‘Middle class’ is a political construct, used to convey images of
‘Middle class’ is a political construct, used to convey images of

FINANCIAL CRISES
The amount of subprime mortgage debt, which was guaranteed by Freddie
FINANCIAL CRISES
The amount of subprime mortgage debt, which was guaranteed by Freddie

THE GREAT RECESSION
The Great Recession is a term that represents the
THE GREAT RECESSION
The Great Recession is a term that represents the

BEFORE GREAT RECESSION
The investment banks, looking for easy profits in the
BEFORE GREAT RECESSION
The investment banks, looking for easy profits in the

DOTCOM BUBBLE
The dotcom bubble occurred in the late 1990s and was characterized by
DOTCOM BUBBLE
The dotcom bubble occurred in the late 1990s and was characterized by

LESSONS
Originators need to be "incentivized" to make loans to high-quality borrowers
LESSONS
Originators need to be "incentivized" to make loans to high-quality borrowers

EIU GLOBAL FORECAST - HIGHER INTEREST RATES ARE COMING
The US economy
EIU GLOBAL FORECAST - HIGHER INTEREST RATES ARE COMING
The US economy

DEVELOPED WORLD
The US economy is in good shape, and we have
DEVELOPED WORLD
The US economy is in good shape, and we have

EMERGING MARKETS
Conditions for emerging markets to become more challenging in the
EMERGING MARKETS
Conditions for emerging markets to become more challenging in the

EMERGING MARKETS
The ongoing economic recovery in Latin America is forecast to
EMERGING MARKETS
The ongoing economic recovery in Latin America is forecast to

EXCHANGE RATES
The US dollar has continued to depreciate in early 2018,
EXCHANGE RATES
The US dollar has continued to depreciate in early 2018,

COMMODITIES
The price of crude oil is likely to remain range-bound, at
COMMODITIES
The price of crude oil is likely to remain range-bound, at

WORLD ECONOMY: FORECAST SUMMARY
WORLD ECONOMY: FORECAST SUMMARY
 Мое отношение к коррупции
 Роль государства в обеспечении устойчивости и конкурентоспособности предприятий горнодобывающей отрасли Арктической зоны РФ
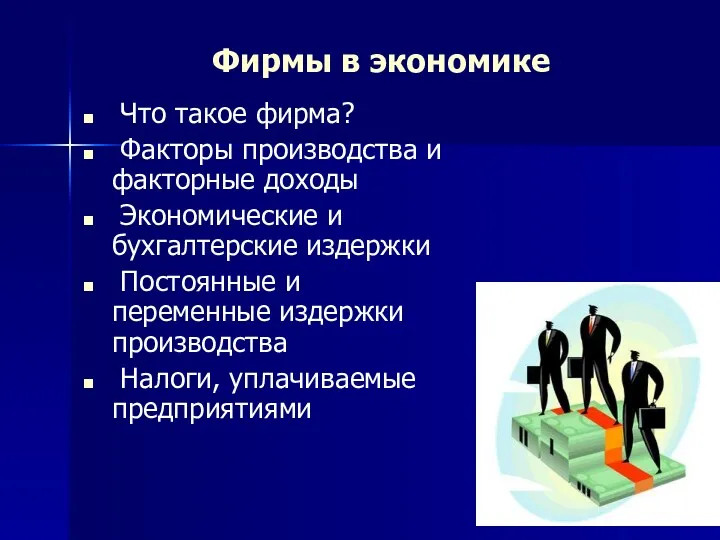 Фирмы в экономике
 Инновационные центры в Австралии
 Трудовой потенциал и трудовые ресурсы общества
 Факторы производства и экономические системы
 Теоретичні засади економічного ризику
 Статистика труда. Численность персонала предприятия. Фонды рабочего времени. Эффективность использования рабочего времени
 Безлицензионный экспорт контролируемых товаров
 Рынок труда и безработица
 Заработная плата. Рынок труда
 Оцінка інвестиційних проектів. (Заняття 9)
 Продовольственная безопасность страны и здоровье граждан
 A Tour of the World
 Náklady a nákladová funkce
 Анализ и менеджмент экономической деятельности
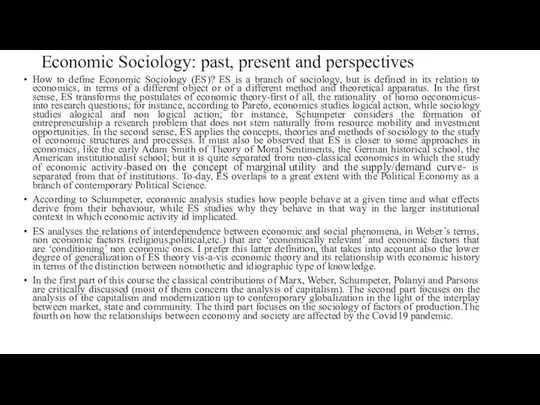 Economic Sociology: past, present and perspectives
 Ընդհանուր պատկերացումներ տնտեսության մասին
 Формирование рыночных цен. Рынок на практике или как реально реорганизована торговля
 Современные особенности развития мирового хозяйства
 Итоги декабря, января, февраля
 Реінжиніринг бізнес-процесів
 Olygopoly. Between monopoly and perfect competition. (Lecture 16)
 Собственность в рыночной экономике
 Международная миграция рабочей силы: сущность, причины и эволюция
 Экономические циклы. Безработица
 Мемлекеттік реттеу нысандары
 Основные понятия и классификации СНС