- Lake ice climatology

Содержание
- 2. Lake ice season Ice thickness --- stable ice --- Unstable periods (fixed) H tF tb t1
- 3. Warming climate ? ? Will the lake freeze in future ? How much are freezing date
- 4. Ice phenology Freezing date Strongly connected to air temperature (long-wave radiation, turbulent fluxes) Connection depends on
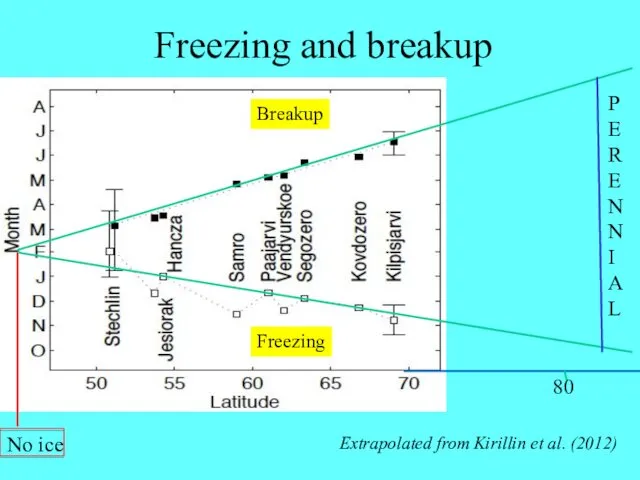
- 5. Breakup Freezing 80 P E R E N N I A L Freezing and breakup Extrapolated
- 6. Lake ice time series Ice phenology freezing date breakup date How to define? Ice cover properties
- 7. Lake Kallavesi, Finland 1830 – 2014 Trend 10 days/100 years Aperiodic Variability 80 days Extrema far
- 8. Colder climate ? less variability Kirillin et al. (2012)
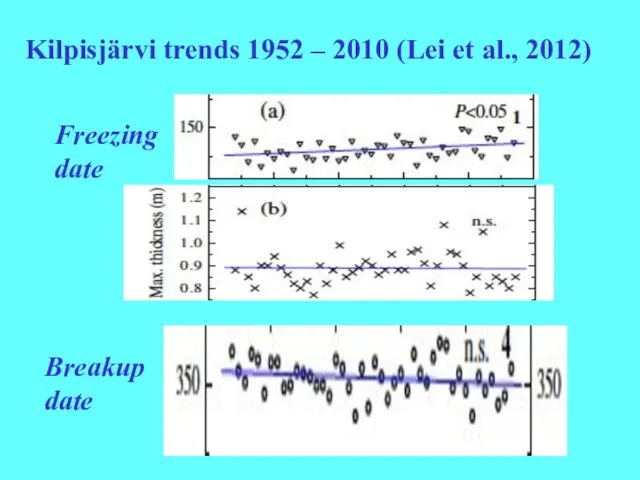
- 9. Freezing date Breakup date Kilpisjärvi trends 1952 – 2010 (Lei et al., 2012)
- 12. 1st order: climate change impact Freezing date ~ 5 day/°C Ice thickness 5–10 cm/°C Breakup date
- 13. Lake Vanajavesi: model for climate change impact -1°C -6°C +6°C +1°C
- 14. Ice thickness cycle – albedo sensitivity, Prydz Bay α = 0.5 α = 0.5 α =
- 15. Lake Ladoga: Finnish – Soviet – Russian data 1913 – 1937 Ice charts and reports 1943
- 16. Ice concentration A A = relative area of ice in the lake Freezing ? depth: t
- 17. Lake Ladoga 1913–
- 19. Summary: warming (?) ? Freezing day delays Max annual ice thickness likely decreases Ice quality (congelation
- 20. … consequences to water body Shorter ice season AND More sunlight More transient open water periods
- 21. Climate warming ? Lake seasons Annual cycle: qualitative changes Summer stratification stronger Stable ice period shorter
- 23. Скачать презентацию
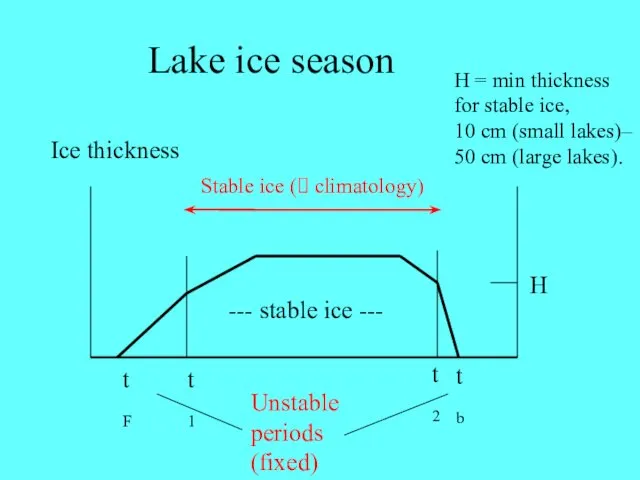
Lake ice season
Ice thickness
--- stable ice ---
Unstable periods
(fixed)
H
tF
tb
t1
t2
H = min thickness
Lake ice season
Ice thickness
--- stable ice ---
Unstable periods
(fixed)
H
tF
tb
t1
t2
H = min thickness
Warming climate ? ?
Will the lake freeze in future ?
How much
Warming climate ? ?
Will the lake freeze in future ?
How much
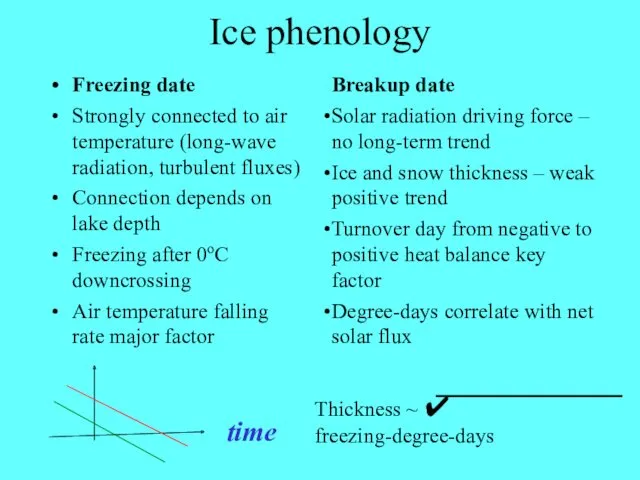
Ice phenology
Freezing date
Strongly connected to air temperature (long-wave radiation, turbulent fluxes)
Connection
Ice phenology
Freezing date
Strongly connected to air temperature (long-wave radiation, turbulent fluxes)
Connection
Breakup
Freezing
80
P
E
R
E
N
N
I
A
L
Freezing and breakup
Extrapolated from Kirillin et al. (2012)
No ice
Breakup
Freezing
80
P
E
R
E
N
N
I
A
L
Freezing and breakup
Extrapolated from Kirillin et al. (2012)
No ice
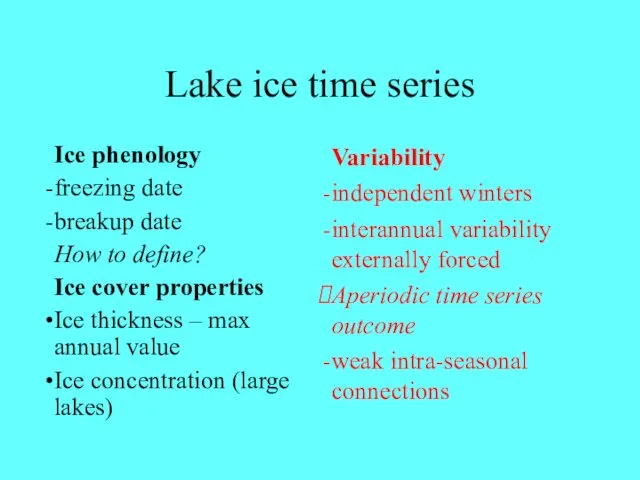
Lake ice time series
Ice phenology
freezing date
breakup date
How to define?
Ice cover properties
Ice
Lake ice time series
Ice phenology
freezing date
breakup date
How to define?
Ice cover properties
Ice
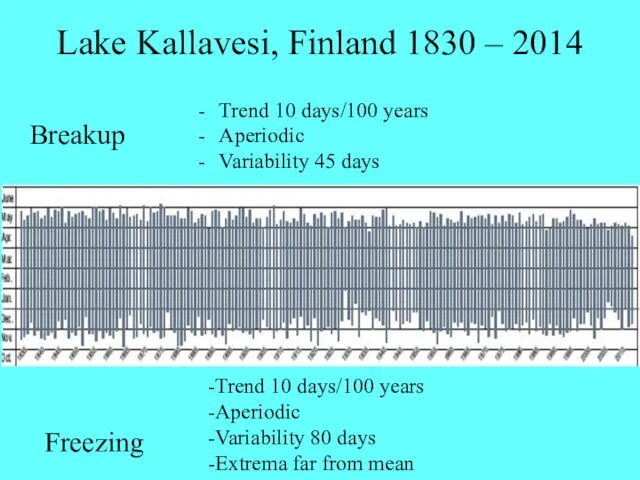
Lake Kallavesi, Finland 1830 – 2014
Trend 10 days/100 years
Aperiodic
Variability 80 days
Extrema
Lake Kallavesi, Finland 1830 – 2014
Trend 10 days/100 years
Aperiodic
Variability 80 days
Extrema
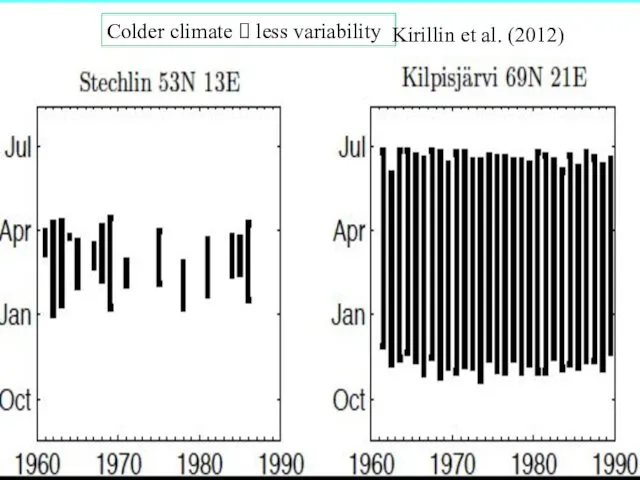
Colder climate ? less variability
Kirillin et al. (2012)
Colder climate ? less variability
Kirillin et al. (2012)
Freezing
date
Breakup
date
Kilpisjärvi trends 1952 – 2010 (Lei et al., 2012)
Freezing
date
Breakup
date
Kilpisjärvi trends 1952 – 2010 (Lei et al., 2012)
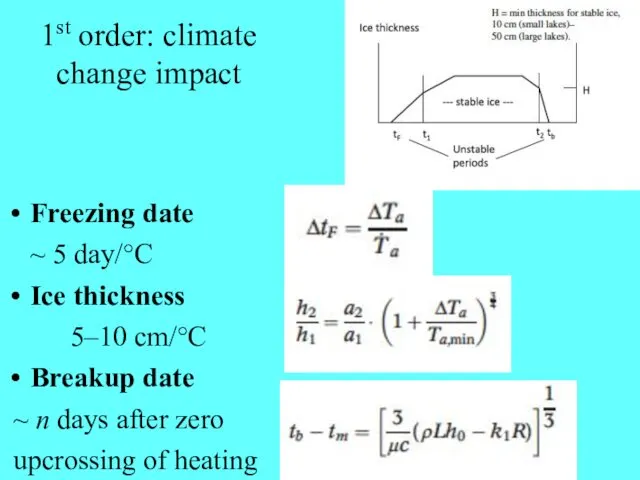
1st order: climate change impact
Freezing date
~ 5 day/°C
Ice thickness
5–10 cm/°C
Breakup date
1st order: climate change impact
Freezing date
~ 5 day/°C
Ice thickness
5–10 cm/°C
Breakup date
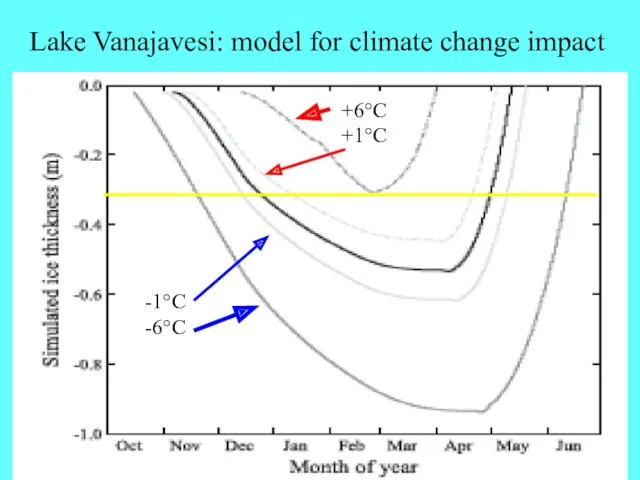
Lake Vanajavesi: model for climate change impact
-1°C
-6°C
+6°C
+1°C
Lake Vanajavesi: model for climate change impact
-1°C
-6°C
+6°C
+1°C
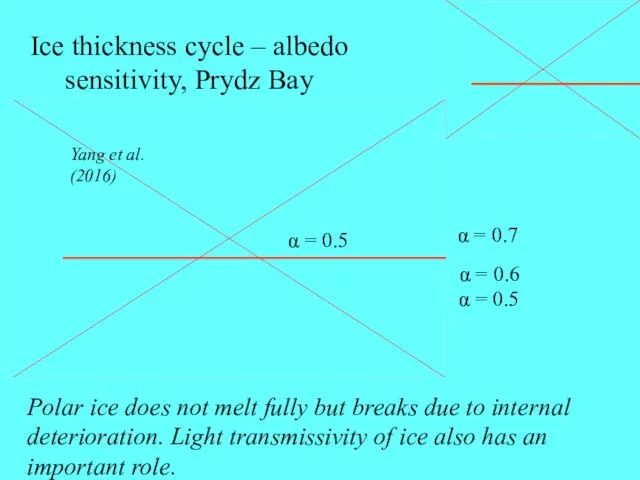
Ice thickness cycle – albedo sensitivity, Prydz Bay
α = 0.5
α =
Ice thickness cycle – albedo sensitivity, Prydz Bay
α = 0.5
α =
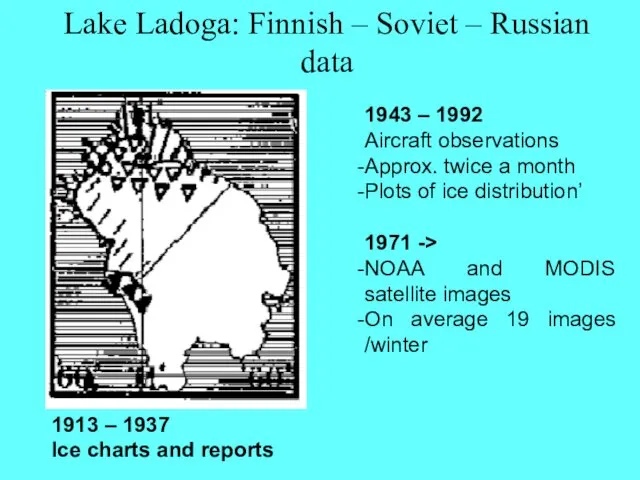
Lake Ladoga: Finnish – Soviet – Russian data
1913 – 1937
Ice charts
Lake Ladoga: Finnish – Soviet – Russian data
1913 – 1937
Ice charts
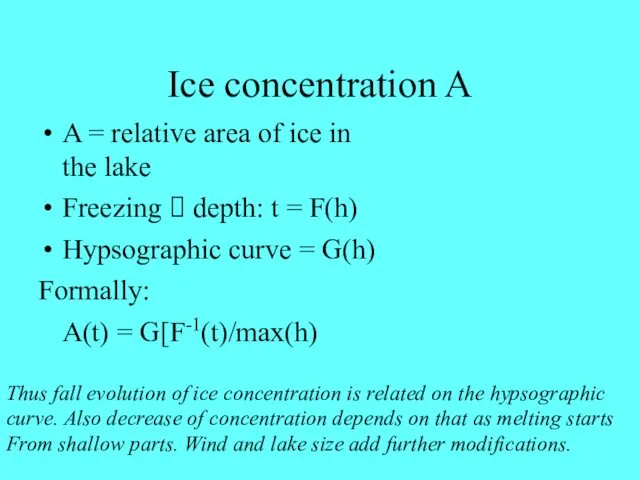
Ice concentration A
A = relative area of ice in the lake
Freezing
Ice concentration A
A = relative area of ice in the lake
Freezing
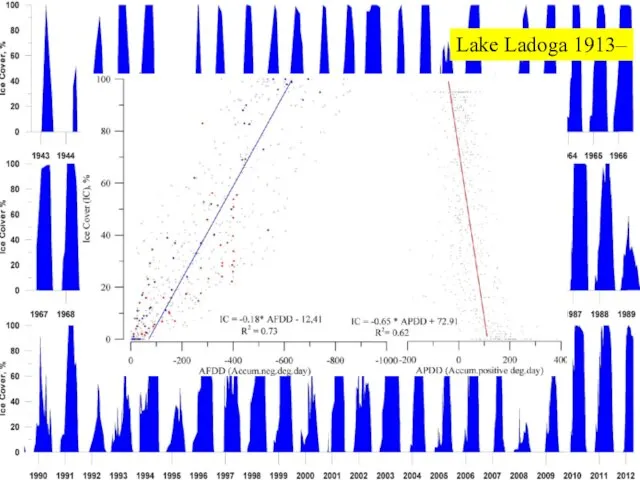
Lake Ladoga 1913–
Lake Ladoga 1913–

Summary: warming (?) ?
Freezing day delays
Max annual ice thickness likely decreases
Ice
Summary: warming (?) ?
Freezing day delays
Max annual ice thickness likely decreases
Ice
… consequences to water body
Shorter ice season
AND
More sunlight
More transient open
… consequences to water body
Shorter ice season
AND
More sunlight
More transient open
Climate warming ? Lake seasons
Annual cycle:
qualitative changes
Summer stratification stronger
Stable ice
Climate warming ? Lake seasons
Annual cycle:
qualitative changes
Summer stratification stronger
Stable ice
 система СИ
 Пневматична система
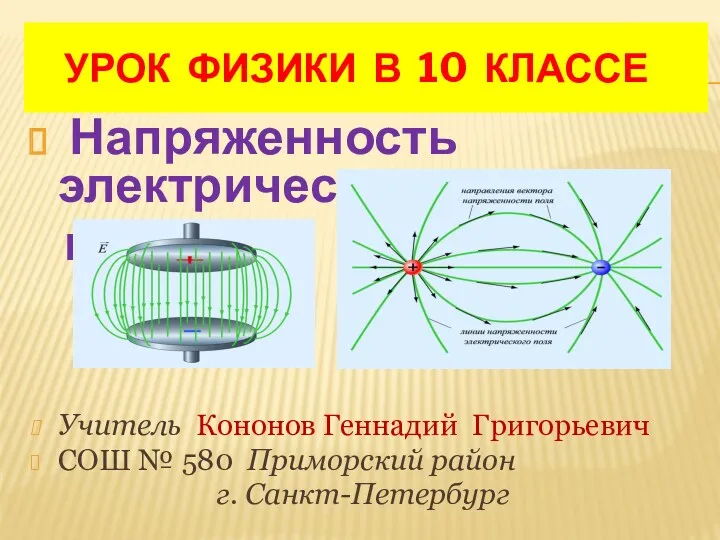 Напряженность электрического поля. Урок физики в 10 классе
 Механизм газораспределения автомобиля ВАЗ 2107
 Тиристор деп төрт деңгейлі жартылай өткізгіш құрылғылардын
 Электроемкость. Конденсаторы
 Удельная теплоёмкость
 презентация по теме Сила трения 7 класс
 Лампа накаливания
 Передача давления жидкостями и газами. Закон Паскаля
 Скорость света
 Решение задач на применение законов Ньютона
 Сила тока. Закон Ома для участка цепи. Сопротивление. 10 класс
 Радиометрия и спектрометрия ионизирующих излучений. (Лекция 9)
 Инструкции по технике безопасности в кабинете физики.
 От порядка к хаосу. Сценарии перехода к хаосу
 урок в 7 классе Давление твёрдых тел
 Тепломассообмен. Поперечное обтекание одиночных труб и трубных пучков
 Основы атомной физики. Основы квантовой механики. Строение вещества
 Адаптация обучающихся в учебном пространстве предмета - физика
 Своя игра. Физика. 7 класс.
 Кристаллооптический анализ
 Биомеханика двигательных действий: составные движения в биокинематических цепях
 Електростатичне поле
 Электростатическое поле в вакууме. Принцип суперпозиции. Проводники в электростатическом поле
 Литий-ионные (Li-ion) аккумуляторы
 Заттың магниттік қасиеттері. Ақпараттың магниттік жазылуы
 Теплотехника. Основы теории тепло- и массообмена. (Лекция 11)