- Mechanics of Material

Содержание
- 2. Stress and Strain Contents Stress & Strain: Axial Loading Normal Strain Stress-Strain Test Stress-Strain Diagram: Ductile
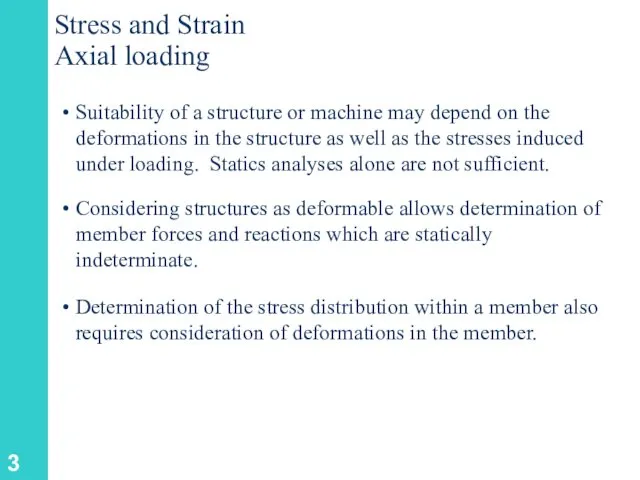
- 3. Stress and Strain Axial loading Suitability of a structure or machine may depend on the deformations
- 4. Displacement Movement of a point w.r.t. a reference system. Maybe caused by translation and or rotation
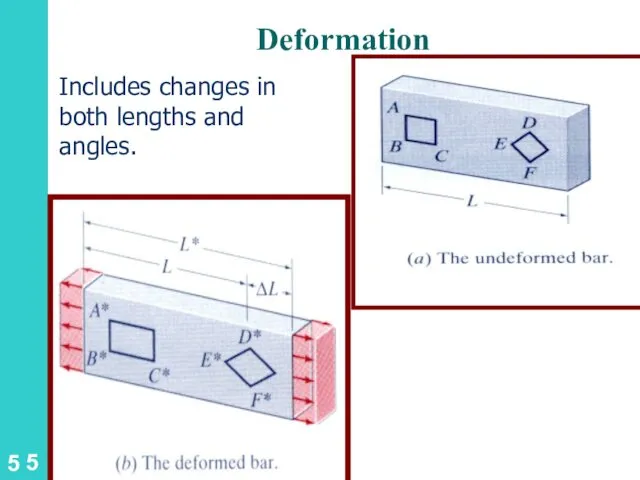
- 5. Deformation Includes changes in both lengths and angles.
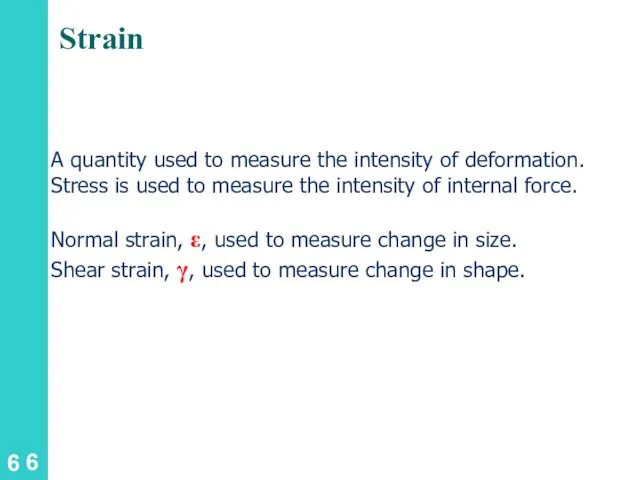
- 6. Strain A quantity used to measure the intensity of deformation. Stress is used to measure the
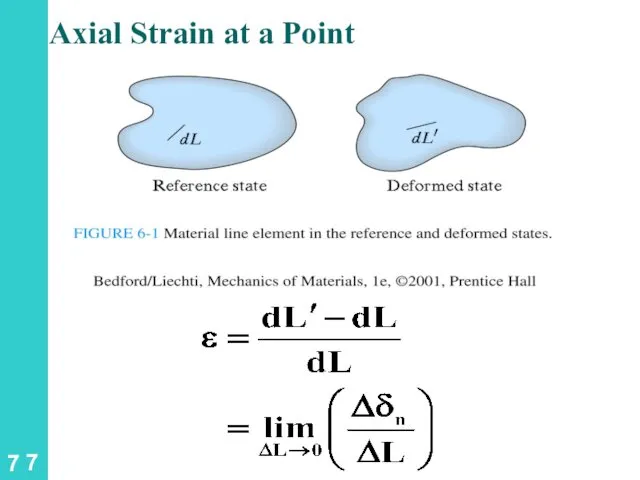
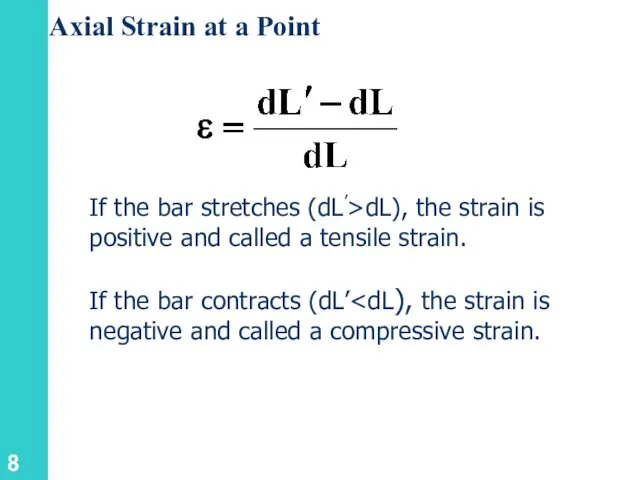
- 7. Axial Strain at a Point
- 8. Axial Strain at a Point If the bar stretches (dL’>dL), the strain is positive and called
- 9. Normal Strain/ Axial Strain at a Point
- 10. Normal Strain Normal Strain: is the deformation of the Member per unit length. (Dimensionless) Uniform cross
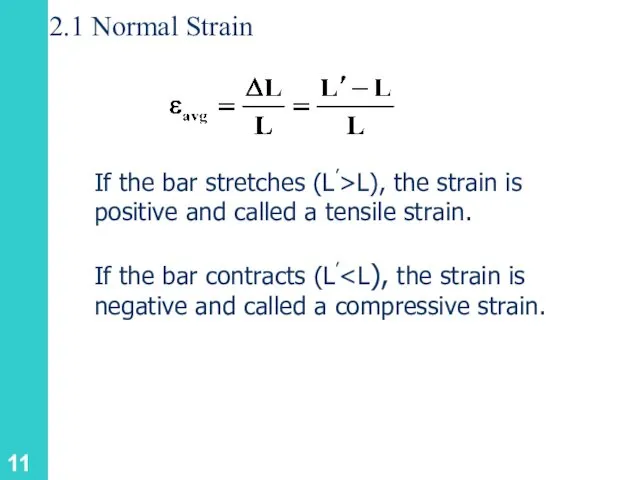
- 11. 2.1 Normal Strain If the bar stretches (L’>L), the strain is positive and called a tensile
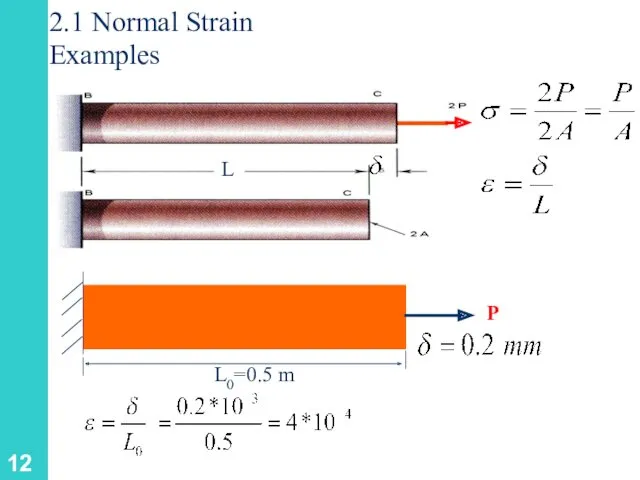
- 12. 2.1 Normal Strain Examples L0=0.5 m P
- 13. 2.1 Normal Strain: Examples Determine the expression for the average extensional strain in rod BC as
- 14. 2.1 Normal Strain: Examples Deformation Diagram
- 15. 2.1 Normal Strain: Examples
- 16. 2.1 Normal Strain: Examples The strain is dimensionless, as it should be. At θ = π/2,
- 17. Mechanical Properties of Materials Properties are determined by mechanical tests (Tension and Compression.) A typical test
- 18. 2.1 Stress Strain Diagram A variety of testing machine types, and sizes…
- 19. Gage Length Original gage length is L0. This is not the total length of the specimen.
- 20. 2.1 Stress Strain Diagram σ ε A plot of stress versus strain is called a stress
- 21. 2.1 Stress Strain Diagram(Steel) Permanent deformation(دائم ) Important Regions: Elastic region(متمغّط ) Yielding(مرن ) Strain Hardening
- 22. 2.1 Stress Strain Diagram(Steel) In the figure above the region from A to B has a
- 23. Yielding At point B, the specimen begins yielding. Smaller load increments are required to to produce
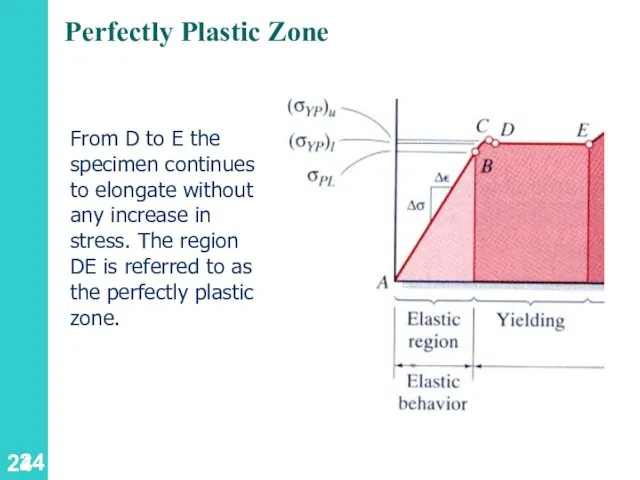
- 24. Perfectly Plastic Zone From D to E the specimen continues to elongate without any increase in
- 25. Strain Hardening The stress begins to increase at E. The region from E to F is
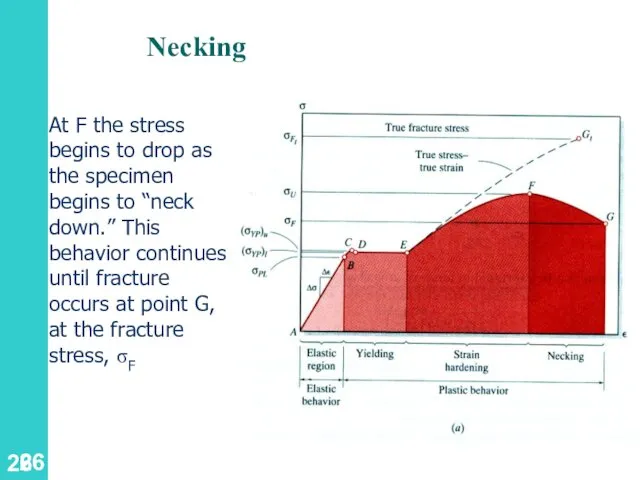
- 26. Necking At F the stress begins to drop as the specimen begins to “neck down.” This
- 27. Necking Fracture
- 28. True Stress
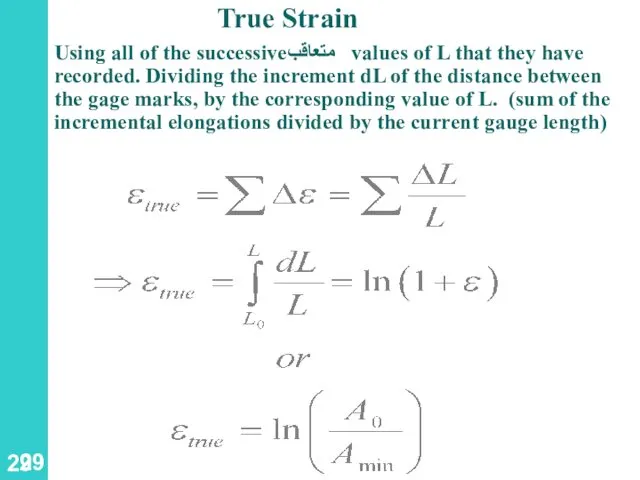
- 29. True Strain Using all of the successiveمتعاقب values of L that they have recorded. Dividing the
- 30. Design Properties Strength Stiffness Ductility
- 31. Strength Ultimate Strength: Highest value of stress (maximum value of engineering stress) that the material can
- 32. Stiffness The ratio of stress to strain (or load to displacement.) Generally of interest in the
- 33. Ductilityتمدد Materials that can undergo a large strain before fracture are classified as ductile materials. Materials
- 34. Ductility Measures % Elongation % Reduction in Area
- 35. Ductile Materials Steel Brass Aluminum Copper Nickel Nylon
- 36. 2.1 Stress Strain Diagram Ductile Materials(لَدْن )
- 37. 2.1 Stress Strain Diagram Brittle Materials(هش ) Typical stress-strain diagram for a brittle material showing the
- 38. 2.1 Stress Strain Diagram Elastic versus Plastic Behavior If the strain disappears when the stress is
- 39. Plastic Behavior
- 40. After reloading of a piece the elastic and proportional limit can be increased. Mechanical properties depend
- 41. 2.2 Hooke’s Low: Modulus of elasticity Below the yield stress Strength is affected by(مُتَأَثِّر) alloying(خَلِيط ),
- 42. 2.8 Deformations Under Axial Loading From Hooke’s Law:
- 43. 2.8 Deformation under Axial Loading Example Determine the deformation of the steel rod shown under the
- 44. 2.8 Deformation under Axial Loading Example SOLUTION: Divide the rod into three components:
- 46. 2.9 Static Indeterminacy Structures for which internal forces and reactions cannot be determined from statics alone
- 47. 2.9 Static Indeterminacy SOLUTION: Solve for the displacement at B due to the applied loads with
- 48. 2.9 Static Indeterminacy Find the reaction at A due to the loads and the reaction at
- 49. 2.10 Thermal Stresses A temperature change results in a change in length or thermal strain. There
- 50. 2.10 Poisson’s Ratio For a slender bar subjected to axial loading: The elongation in the x-direction
- 51. 2.10 Poisson’s Ratio “Life is good for only two things, discovering mathematics and teaching mathematics.” Siméon
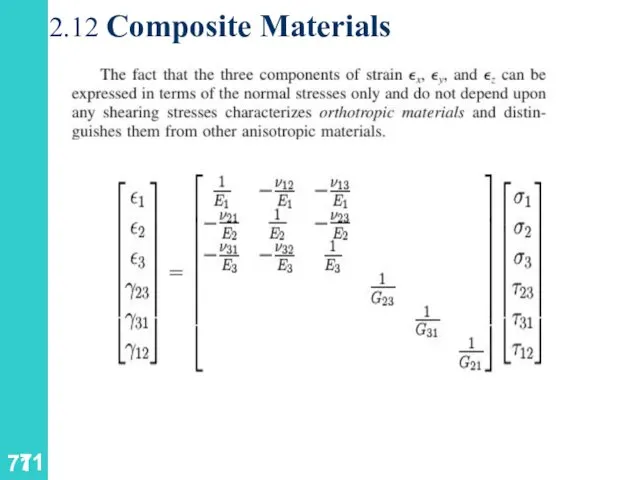
- 53. 2.11 Generalized Hooke’s Law For an element subjected to multi-axial loading, the normal strain components resulting
- 55. A circle of diameter d = 9 in. is scribed on an unstressed aluminum plate of
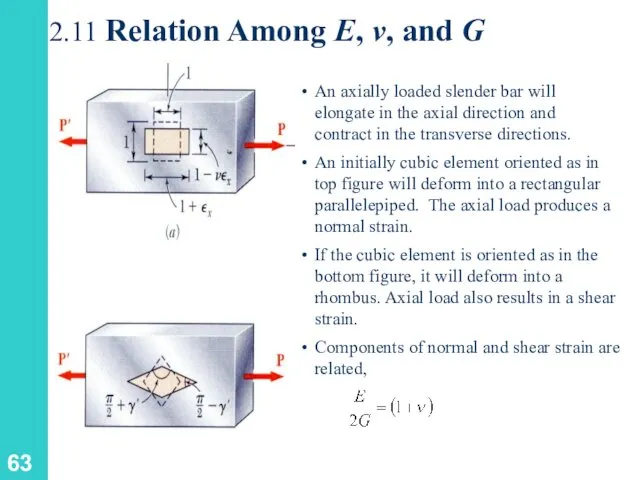
- 56. 2.11 Relation Among E, ν, and G
- 57. 2.11 Dilatation(اِسْتِطَالَة ): Bulk(حجم ) Modulus Relative to the unstressed state, the change in volume is
- 58. Shear Strain A cubic element subjected to a shear stress will deform into a rhomboid(شبيه المعين
- 59. Shear Strain
- 60. Hooke’s Law for Shear
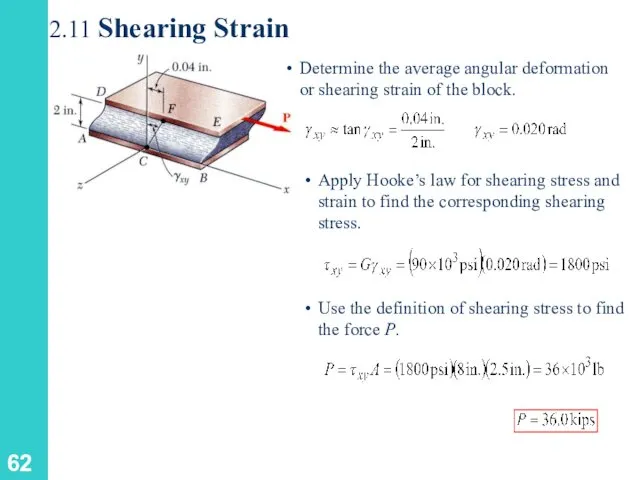
- 61. 2.11 Shearing Strain A rectangular block of material with modulus of rigidity G = 90 ksi
- 62. 2.11 Shearing Strain
- 63. 2.11 Relation Among E, ν, and G An axially loaded slender bar will elongate in the
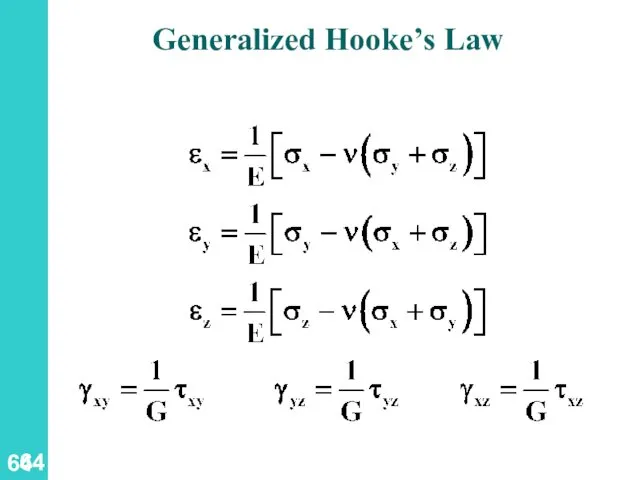
- 64. Generalized Hooke’s Law
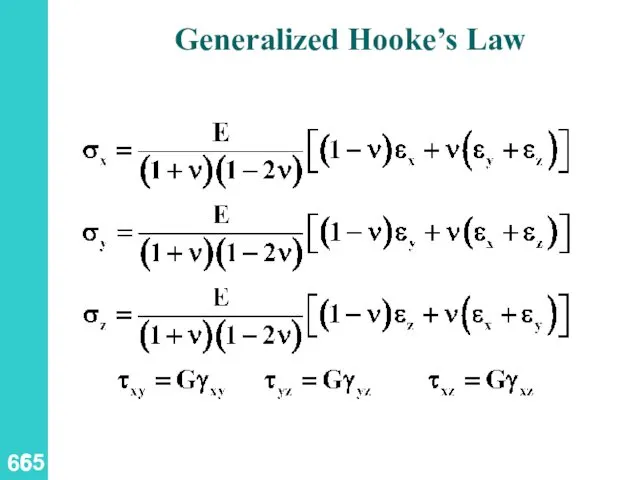
- 65. Generalized Hooke’s Law
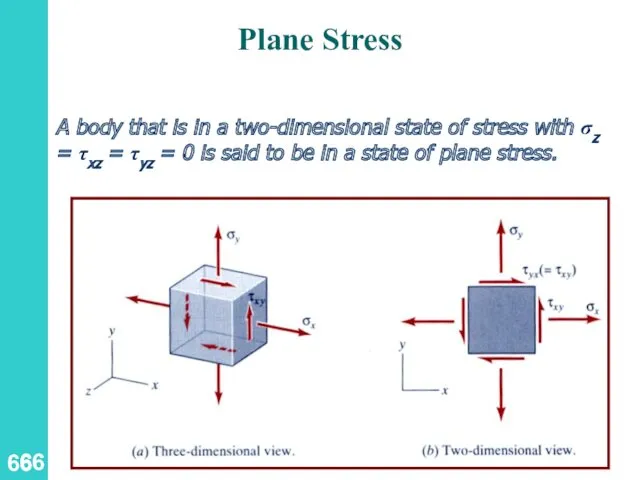
- 66. Plane Stress A body that is in a two-dimensional state of stress with σz = τxz
- 67. Generalized Hooke’s Law
- 68. Hooke’s Law for Plane Strain
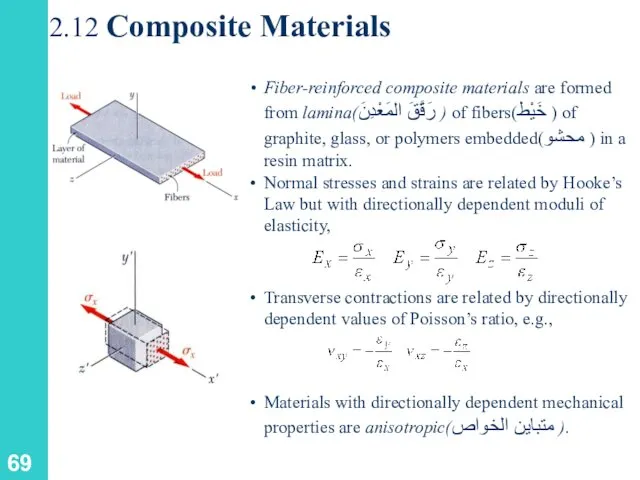
- 69. 2.12 Composite Materials Fiber-reinforced composite materials are formed from lamina(رَقَّقَ المَعْدِنَ ) of fibers(خَيْط ) of
- 70. 2.12 Composite Materials
- 71. 2.12 Composite Materials
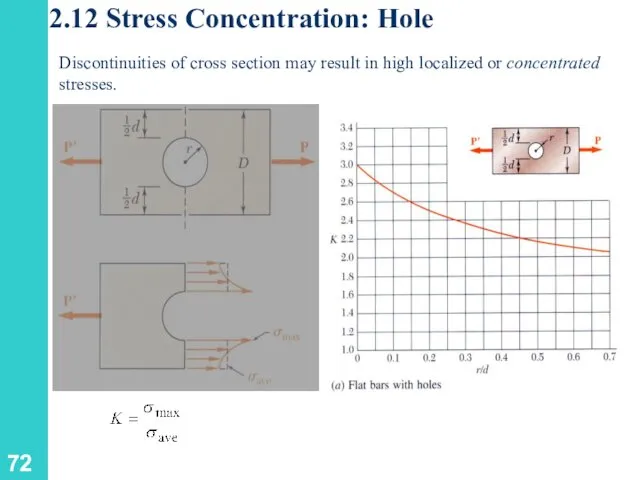
- 72. 2.12 Stress Concentration: Hole Discontinuities of cross section may result in high localized or concentrated stresses.
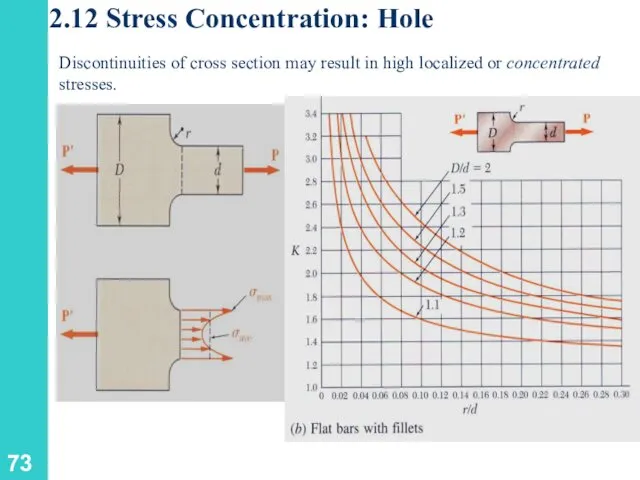
- 73. 2.12 Stress Concentration: Hole Discontinuities of cross section may result in high localized or concentrated stresses.
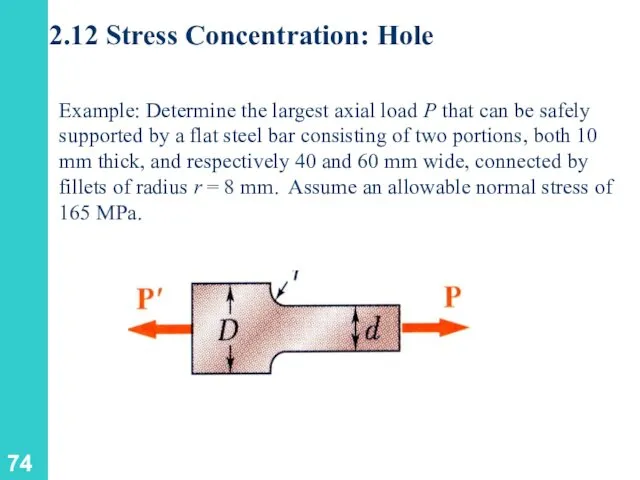
- 74. 2.12 Stress Concentration: Hole Example: Determine the largest axial load P that can be safely supported
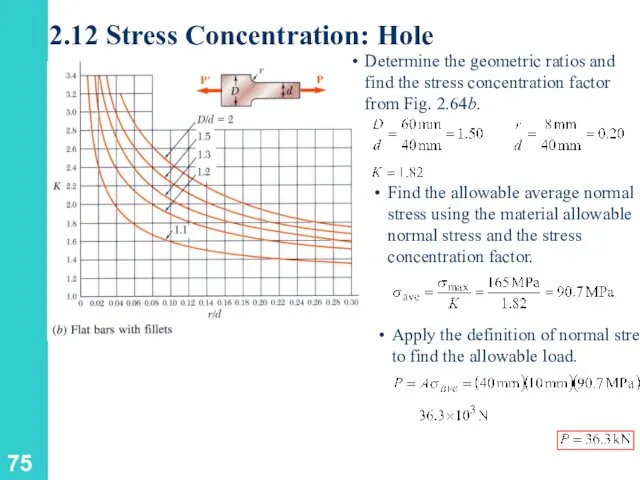
- 75. 2.12 Stress Concentration: Hole
- 77. Скачать презентацию

Stress and Strain
Contents
Stress & Strain: Axial Loading
Normal Strain
Stress-Strain Test
Stress-Strain Diagram: Ductile
Stress and Strain
Contents
Stress & Strain: Axial Loading
Normal Strain
Stress-Strain Test
Stress-Strain Diagram: Ductile
Stress and Strain
Axial loading
Suitability of a structure or machine may
Stress and Strain
Axial loading
Suitability of a structure or machine may

Displacement
Movement of a point w.r.t. a reference system. Maybe caused by
Displacement
Movement of a point w.r.t. a reference system. Maybe caused by
Deformation
Includes changes in both lengths and angles.
Deformation
Includes changes in both lengths and angles.
Strain
A quantity used to measure the intensity of deformation. Stress is
Strain
A quantity used to measure the intensity of deformation. Stress is
Axial Strain at a Point
Axial Strain at a Point
Axial Strain at a Point
If the bar stretches (dL’>dL), the strain
Axial Strain at a Point
If the bar stretches (dL’>dL), the strain

Normal Strain/ Axial Strain at a Point
Normal Strain/ Axial Strain at a Point
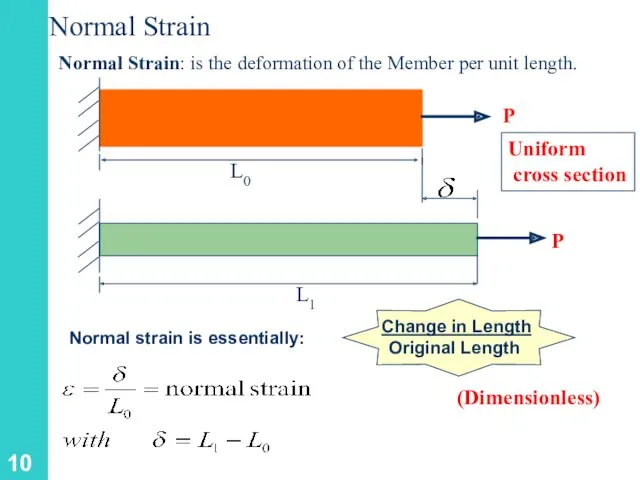
Normal Strain
Normal Strain: is the deformation of the Member per unit
Normal Strain
Normal Strain: is the deformation of the Member per unit
2.1 Normal Strain
If the bar stretches (L’>L), the strain is positive
2.1 Normal Strain
If the bar stretches (L’>L), the strain is positive
2.1 Normal Strain
Examples
L0=0.5 m
P
2.1 Normal Strain
Examples
L0=0.5 m
P
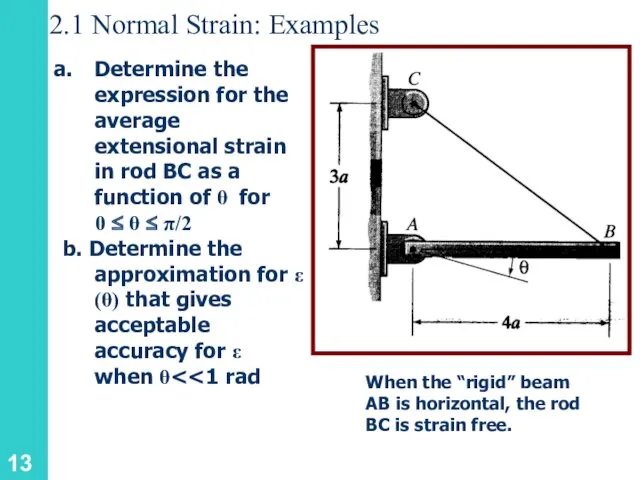
2.1 Normal Strain: Examples
Determine the expression for the average extensional strain
2.1 Normal Strain: Examples
Determine the expression for the average extensional strain
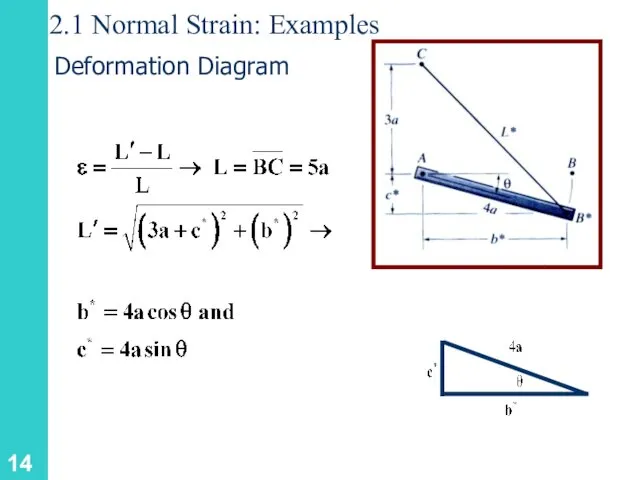
2.1 Normal Strain: Examples
Deformation Diagram
2.1 Normal Strain: Examples
Deformation Diagram
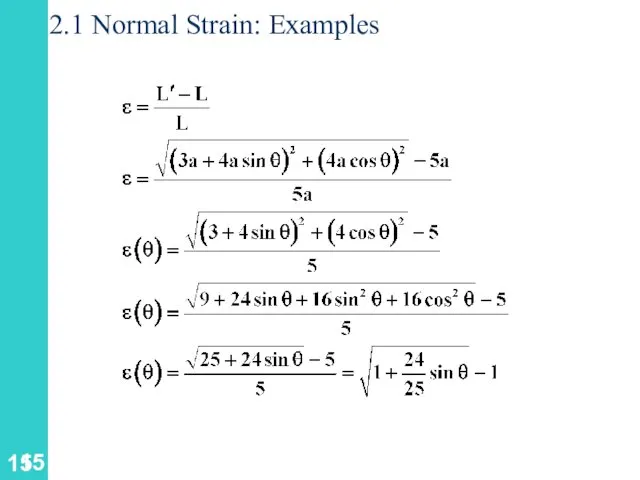
2.1 Normal Strain: Examples
2.1 Normal Strain: Examples
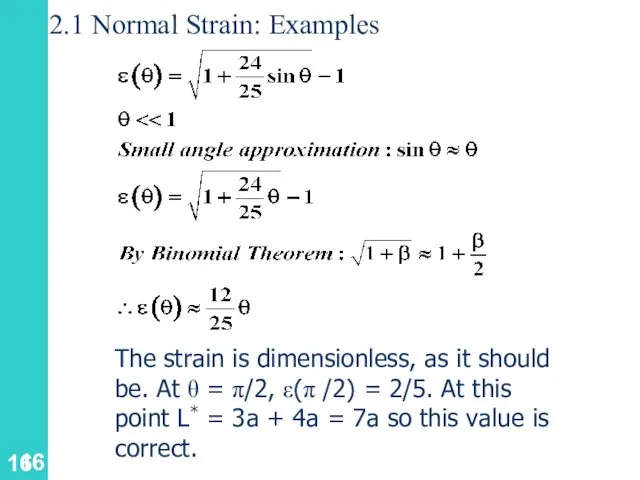
2.1 Normal Strain: Examples
The strain is dimensionless, as it should be.
2.1 Normal Strain: Examples
The strain is dimensionless, as it should be.
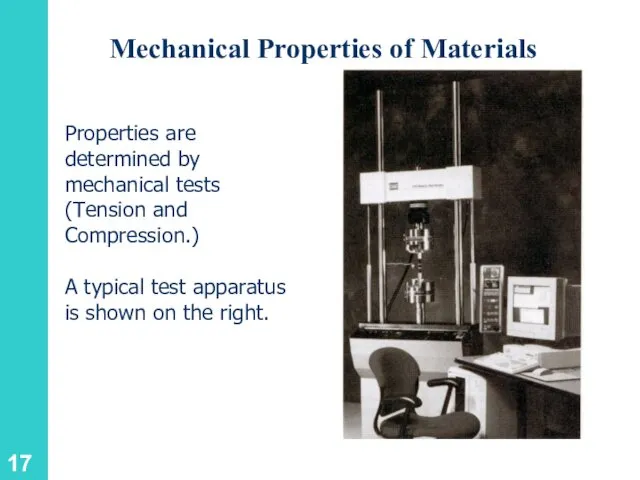
Mechanical Properties of Materials
Properties are determined by mechanical tests (Tension and
Mechanical Properties of Materials
Properties are determined by mechanical tests (Tension and

2.1 Stress Strain Diagram
A variety of testing machine types, and sizes…
2.1 Stress Strain Diagram
A variety of testing machine types, and sizes…

Gage Length
Original gage length is L0. This is not the total
Gage Length
Original gage length is L0. This is not the total

2.1 Stress Strain Diagram
σ
ε
A plot of stress versus strain is called
2.1 Stress Strain Diagram
σ
ε
A plot of stress versus strain is called
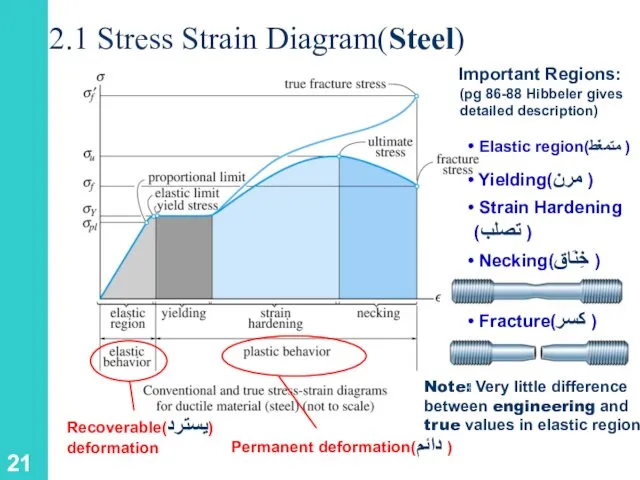
2.1 Stress Strain Diagram(Steel)
Permanent deformation(دائم )
Important Regions:
Elastic region(متمغّط )
Yielding(مرن
2.1 Stress Strain Diagram(Steel)
Permanent deformation(دائم )
Important Regions:
Elastic region(متمغّط )
Yielding(مرن
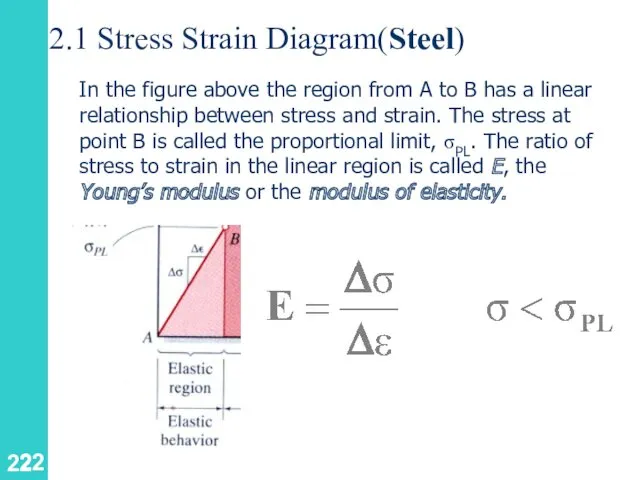
2.1 Stress Strain Diagram(Steel)
In the figure above the region from A
2.1 Stress Strain Diagram(Steel)
In the figure above the region from A
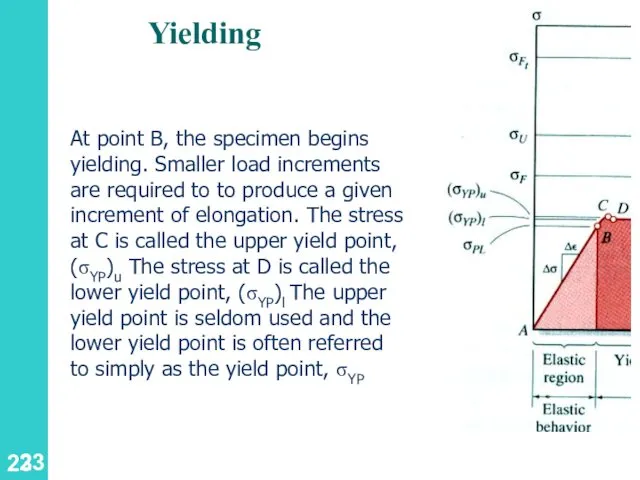
Yielding
At point B, the specimen begins yielding. Smaller load increments are
Yielding
At point B, the specimen begins yielding. Smaller load increments are
Perfectly Plastic Zone
From D to E the specimen continues to elongate
Perfectly Plastic Zone
From D to E the specimen continues to elongate

Strain Hardening
The stress begins to increase at E. The region from
Strain Hardening
The stress begins to increase at E. The region from
Necking
At F the stress begins to drop as the specimen begins
Necking
At F the stress begins to drop as the specimen begins

Necking
Fracture
Necking
Fracture
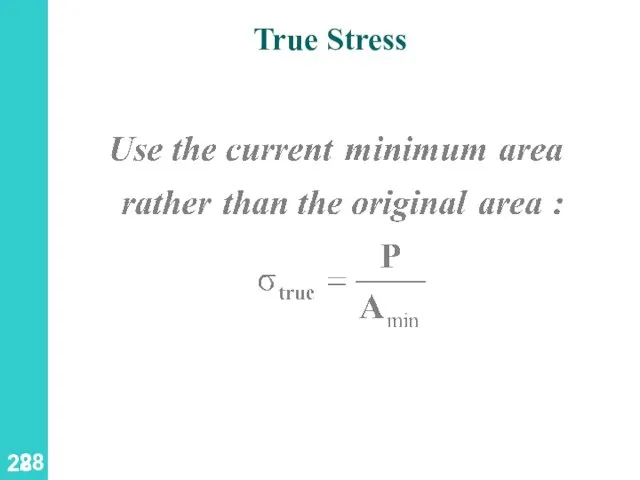
True Stress
True Stress
True Strain
Using all of the successiveمتعاقب values of L that they
True Strain
Using all of the successiveمتعاقب values of L that they
Design Properties
Strength
Stiffness
Ductility
Design Properties
Strength
Stiffness
Ductility
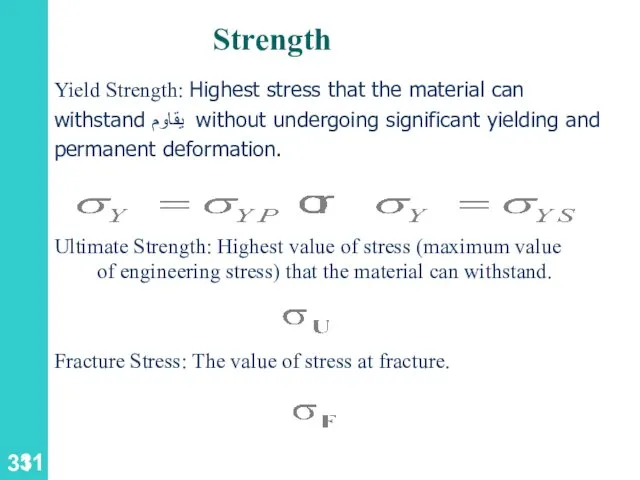
Strength
Ultimate Strength: Highest value of stress (maximum value of engineering stress)
Strength
Ultimate Strength: Highest value of stress (maximum value of engineering stress)
Stiffness
The ratio of stress to strain (or load to displacement.) Generally
Stiffness
The ratio of stress to strain (or load to displacement.) Generally
Ductilityتمدد
Materials that can undergo a large strain before fracture are
Ductilityتمدد
Materials that can undergo a large strain before fracture are
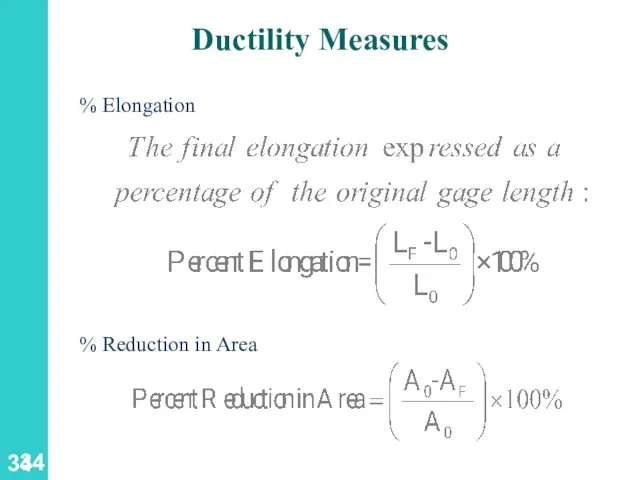
Ductility Measures
% Elongation
% Reduction in Area
Ductility Measures
% Elongation
% Reduction in Area
Ductile Materials
Steel
Brass
Aluminum
Copper
Nickel
Nylon
Ductile Materials
Steel
Brass
Aluminum
Copper
Nickel
Nylon

2.1 Stress Strain Diagram
Ductile Materials(لَدْن )
2.1 Stress Strain Diagram
Ductile Materials(لَدْن )
2.1 Stress Strain Diagram
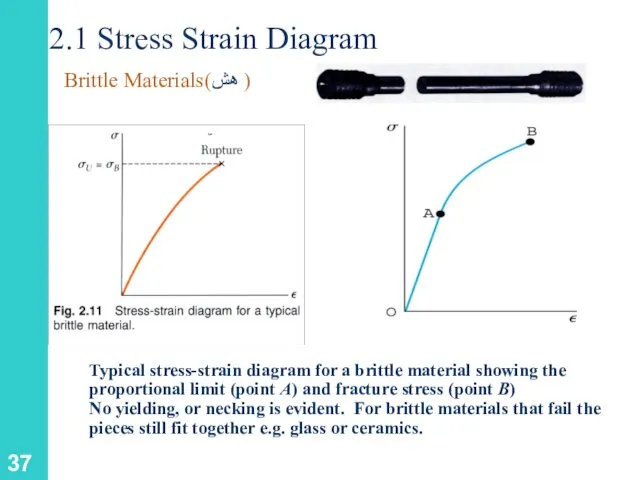
Brittle Materials(هش )
Typical stress-strain diagram for a brittle
2.1 Stress Strain Diagram
Brittle Materials(هش )
Typical stress-strain diagram for a brittle
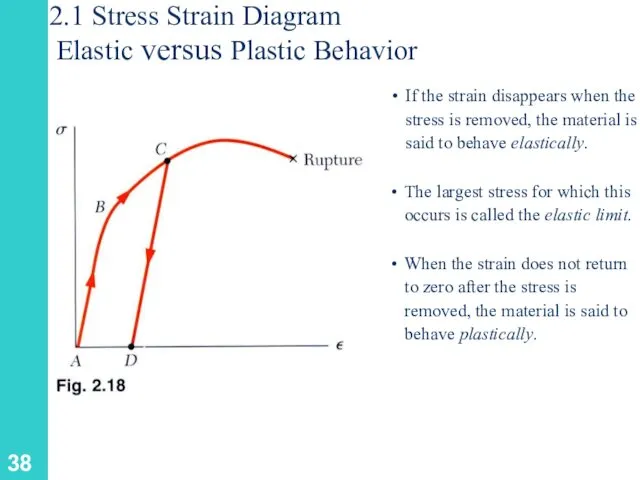
2.1 Stress Strain Diagram
Elastic versus Plastic Behavior
If the strain disappears
2.1 Stress Strain Diagram
Elastic versus Plastic Behavior
If the strain disappears

Plastic Behavior
Plastic Behavior
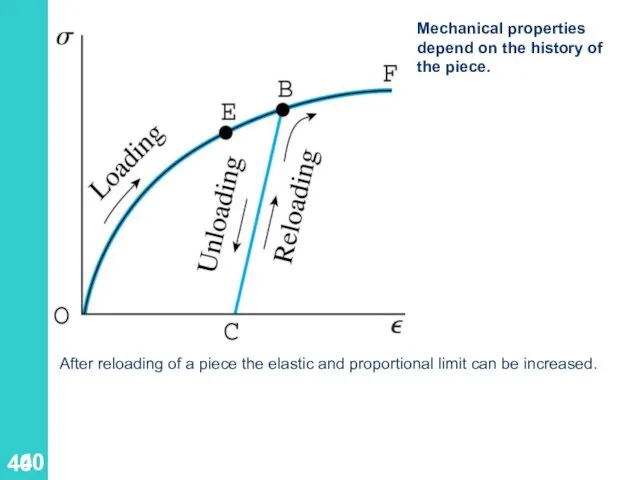
After reloading of a piece the elastic and proportional limit can
After reloading of a piece the elastic and proportional limit can
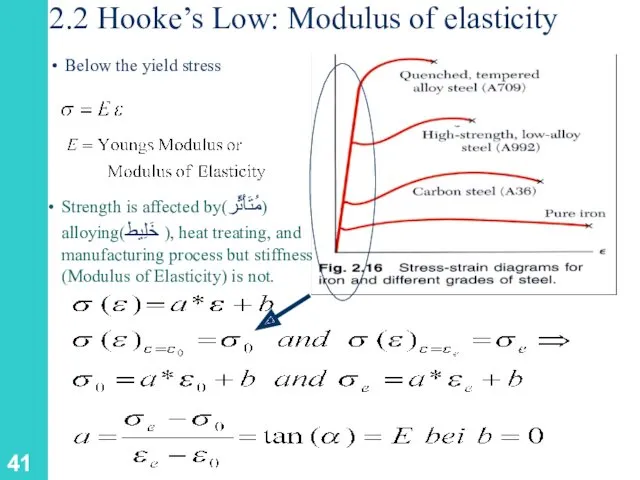
2.2 Hooke’s Low: Modulus of elasticity
Below the yield stress
Strength is affected
2.2 Hooke’s Low: Modulus of elasticity
Below the yield stress
Strength is affected
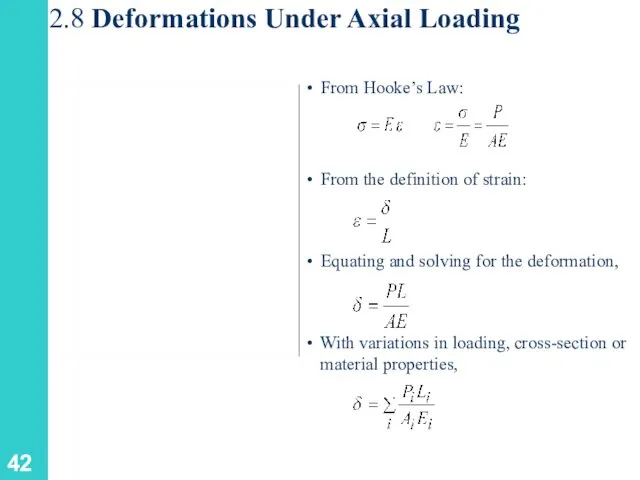
2.8 Deformations Under Axial Loading
From Hooke’s Law:
2.8 Deformations Under Axial Loading
From Hooke’s Law:
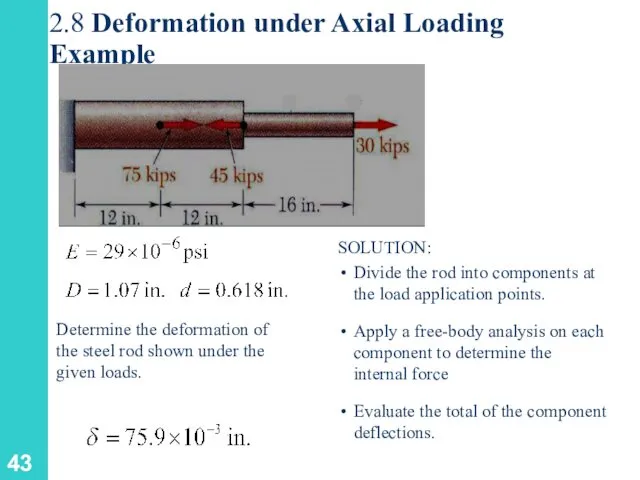
2.8 Deformation under Axial Loading
Example
Determine the deformation of the steel rod
2.8 Deformation under Axial Loading
Example
Determine the deformation of the steel rod

2.8 Deformation under Axial Loading
Example
SOLUTION:
Divide the rod into three components:
2.8 Deformation under Axial Loading
Example
SOLUTION:
Divide the rod into three components:

2.9 Static Indeterminacy
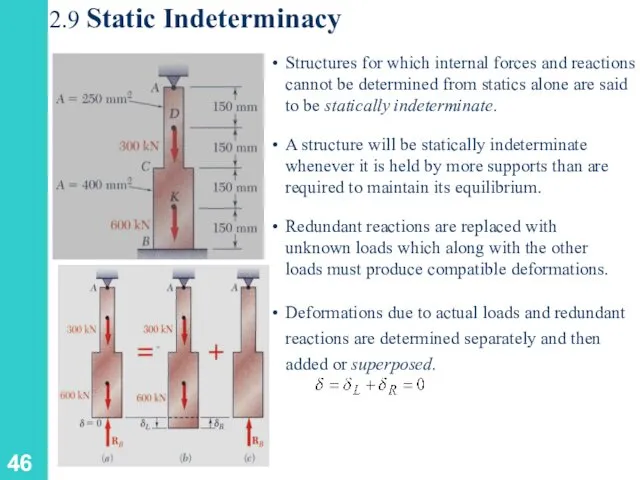
Structures for which internal forces and reactions cannot be
2.9 Static Indeterminacy
Structures for which internal forces and reactions cannot be
2.9 Static Indeterminacy
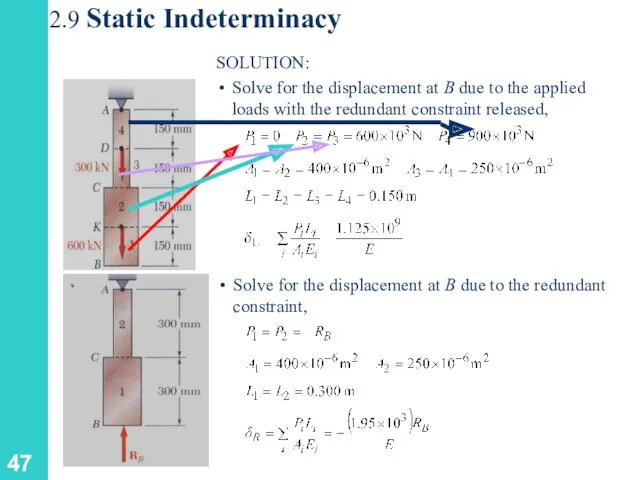
SOLUTION:
Solve for the displacement at B due to the
2.9 Static Indeterminacy
SOLUTION:
Solve for the displacement at B due to the
2.9 Static Indeterminacy
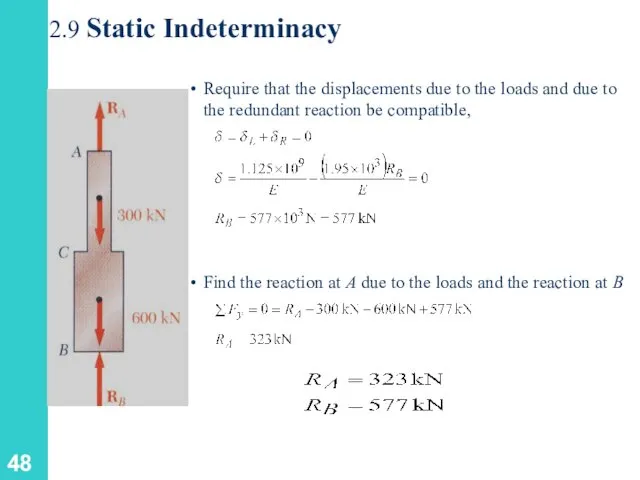
Find the reaction at A due to the loads
2.9 Static Indeterminacy
Find the reaction at A due to the loads
2.10 Thermal Stresses
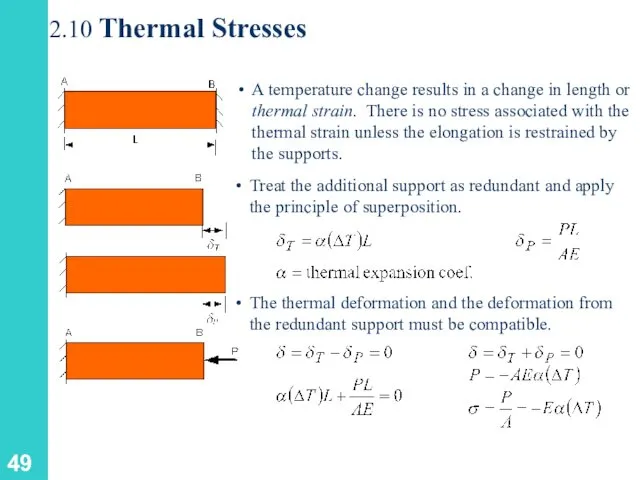
A temperature change results in a change in length
2.10 Thermal Stresses
A temperature change results in a change in length
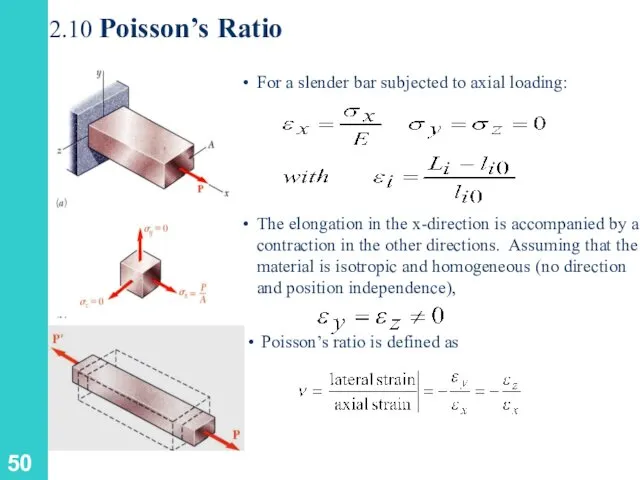
2.10 Poisson’s Ratio
For a slender bar subjected to axial loading:
The elongation
2.10 Poisson’s Ratio
For a slender bar subjected to axial loading:
The elongation

2.10 Poisson’s Ratio
“Life is good for only two things, discovering mathematics
2.10 Poisson’s Ratio
“Life is good for only two things, discovering mathematics
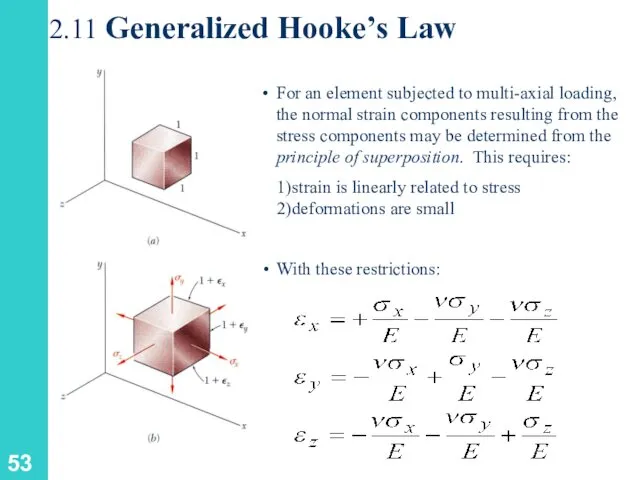
2.11 Generalized Hooke’s Law
For an element subjected to multi-axial loading, the
2.11 Generalized Hooke’s Law
For an element subjected to multi-axial loading, the


A circle of diameter d = 9 in. is scribed on
A circle of diameter d = 9 in. is scribed on
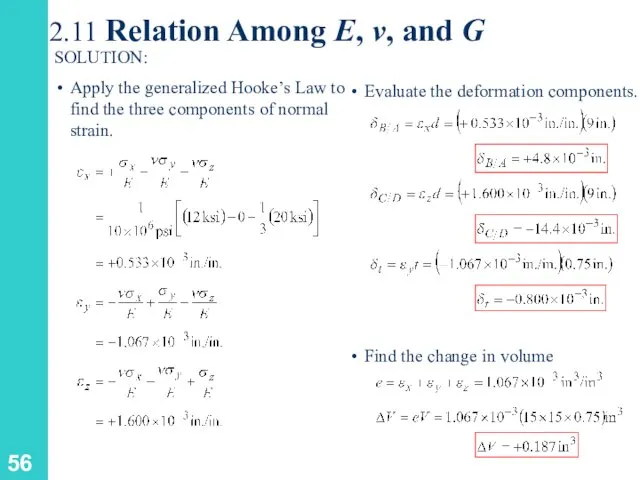
2.11 Relation Among E, ν, and G
2.11 Relation Among E, ν, and G
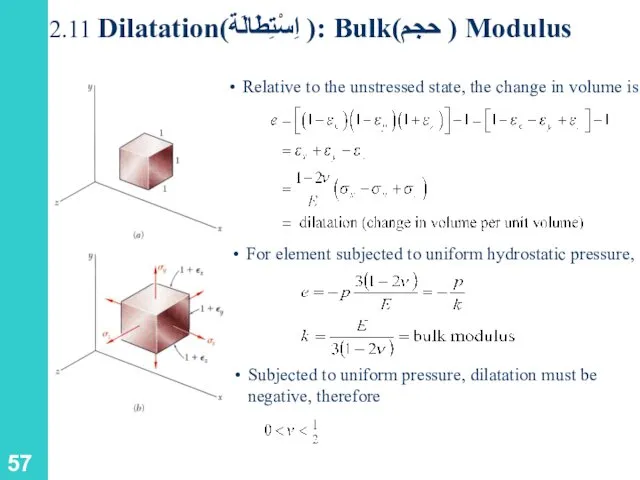
2.11 Dilatation(اِسْتِطَالَة ): Bulk(حجم ) Modulus
Relative to the unstressed state, the
2.11 Dilatation(اِسْتِطَالَة ): Bulk(حجم ) Modulus
Relative to the unstressed state, the
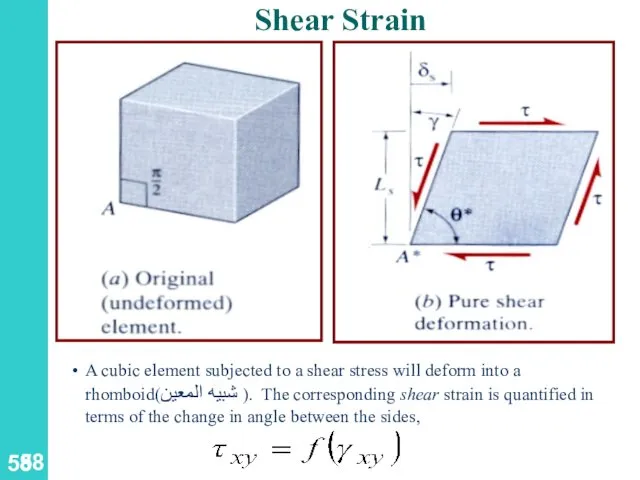
Shear Strain
A cubic element subjected to a shear stress will deform
Shear Strain
A cubic element subjected to a shear stress will deform
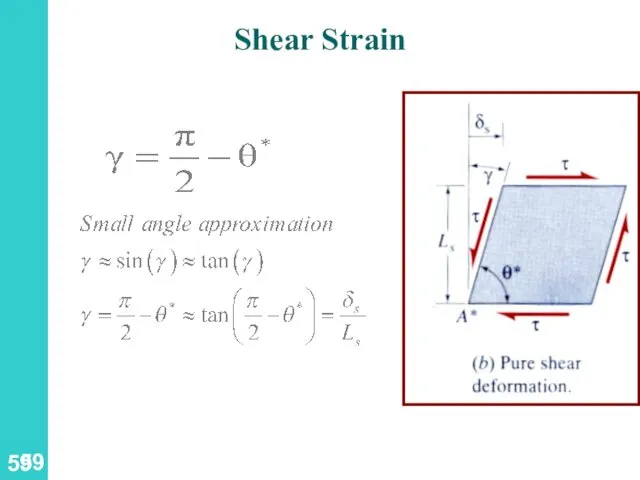
Shear Strain
Shear Strain
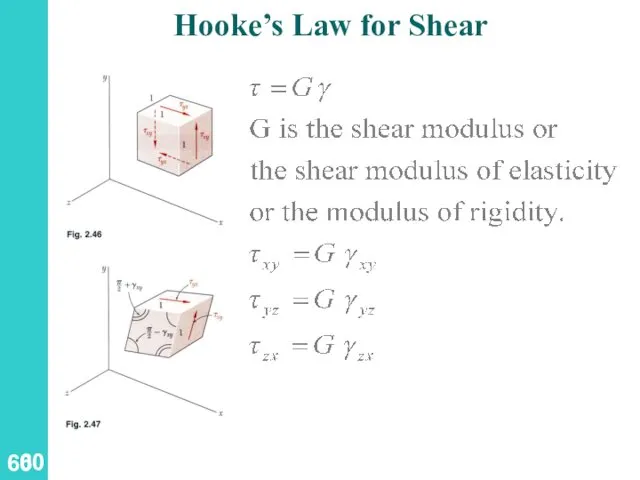
Hooke’s Law for Shear
Hooke’s Law for Shear

2.11 Shearing Strain
A rectangular block of material with modulus of rigidity
2.11 Shearing Strain
A rectangular block of material with modulus of rigidity
2.11 Shearing Strain
2.11 Shearing Strain
2.11 Relation Among E, ν, and G
An axially loaded slender bar
2.11 Relation Among E, ν, and G
An axially loaded slender bar
Generalized Hooke’s Law
Generalized Hooke’s Law
Generalized Hooke’s Law
Generalized Hooke’s Law
Plane Stress
A body that is in a two-dimensional state of stress
Plane Stress
A body that is in a two-dimensional state of stress

Generalized Hooke’s Law
Generalized Hooke’s Law
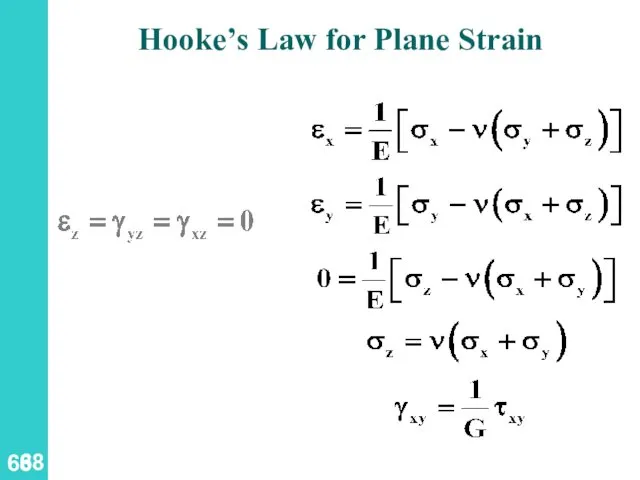
Hooke’s Law for Plane Strain
Hooke’s Law for Plane Strain
2.12 Composite Materials
Fiber-reinforced composite materials are formed from lamina(رَقَّقَ المَعْدِنَ )
2.12 Composite Materials
Fiber-reinforced composite materials are formed from lamina(رَقَّقَ المَعْدِنَ )
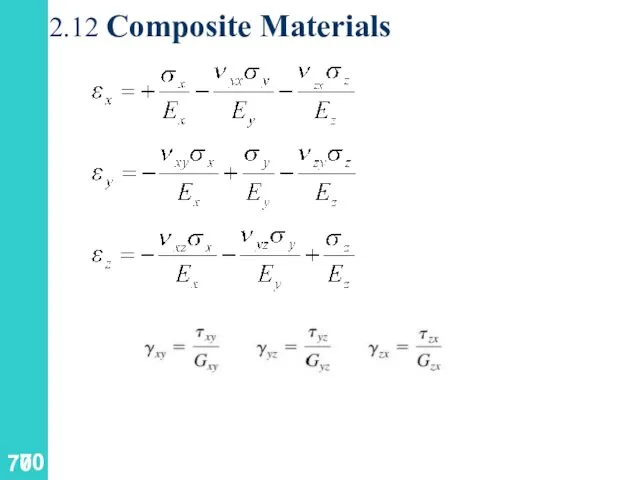
2.12 Composite Materials
2.12 Composite Materials
2.12 Composite Materials
2.12 Composite Materials
2.12 Stress Concentration: Hole
Discontinuities of cross section may result in high
2.12 Stress Concentration: Hole
Discontinuities of cross section may result in high
2.12 Stress Concentration: Hole
Discontinuities of cross section may result in high
2.12 Stress Concentration: Hole
Discontinuities of cross section may result in high
2.12 Stress Concentration: Hole
Example: Determine the largest axial load P that
2.12 Stress Concentration: Hole
Example: Determine the largest axial load P that
2.12 Stress Concentration: Hole
2.12 Stress Concentration: Hole
 Тепломассообмен. Cвободная конвекция
 ВКР: Анализ безопасности плавания пpи планировании перехода пo маpшpуту пopт Пярну – пopт Усть-Луга
 Оптиканың негізі
 дз_ДИФРАКЦИЯ
 Тормозная система КамАЗа
 Ядерный реактор
 Кинематика (основные понятия)
 Урок физики в 8 классе на тему Виды теплопередачи
 Травление. Практическое занятие №5
 Защита от перенапряжений в электоустановках. (Лекция 16)
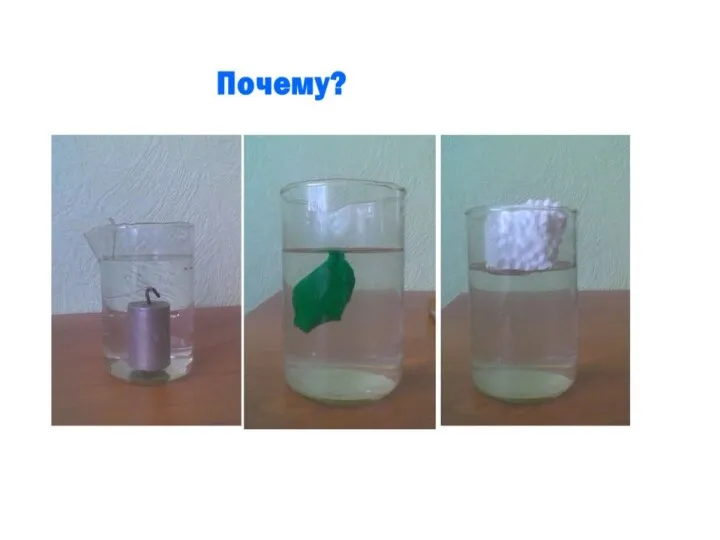 Условия плавания тел. Плавание судов
 Физика и методы научного познания
 Диффузия
 Гидродинамика. Поток жидкости и его основные понятия
 Строение атомов
 Переменный ток
 Разработка урока по теме Механическая работа
 ПРЕЗЕНТАЦИЯ ТЕСТ ПОВЕРХНОСТНОЕ НАТЯЖЕНИЕ
 Сорбционные процессы. (Лекция 2)
 20230212_zvyozdnyy_chas
 Динамика вращения движения твёрдого тела и определение момента инерции маятника Обербека
 Обкатка ПА, назначение, порядок проведения
 ФИЗИКО-ТЕХНИЧЕСКОЕ ОБЪЕДИНЕНИЕ ЭВРИКА
 Закон Ома для участка цепи. Электрическое сопротивление
 Интегральные датчики. Датчики давления, влажности, Холла
 Полимерлердің тұтқыр серпімді қасиеттері. Полимерлердің акустикалық спекроскопиясы
 Топливный цикл ЯЭ. Классификация ЯЭУ. Функционирование АЭС, аварийные защиты. Вывод из эксплуатации. (Лекция 5)
 Қозғалтқыш жалпы түсінік. Қозғалтқыштың құрылысы