- Sensors and actuators

Содержание
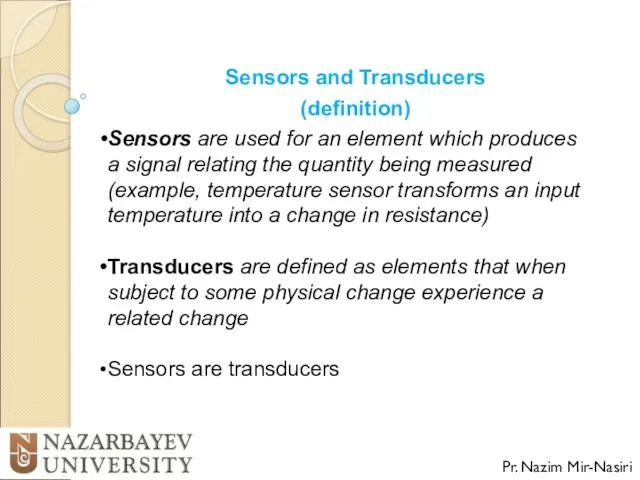
- 2. Sensors and Transducers (definition) Pr. Nazim Mir-Nasiri Sensors are used for an element which produces a
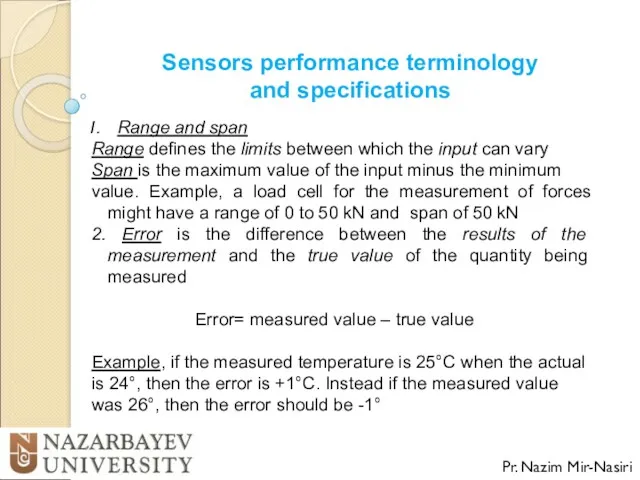
- 3. Sensors performance terminology and specifications Pr. Nazim Mir-Nasiri Range and span Range defines the limits between
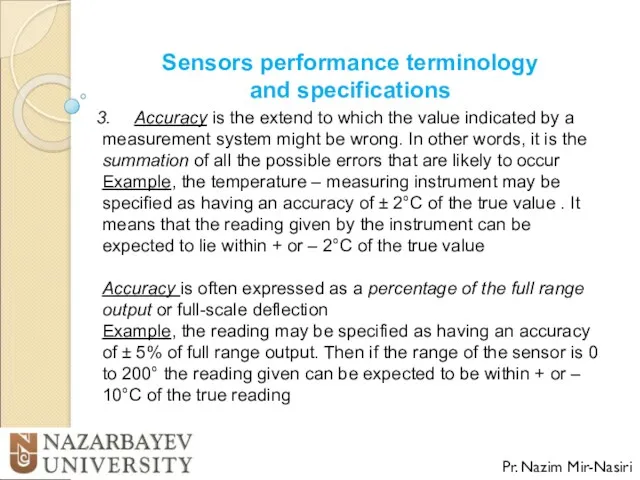
- 4. Sensors performance terminology and specifications Pr. Nazim Mir-Nasiri Accuracy is the extend to which the value
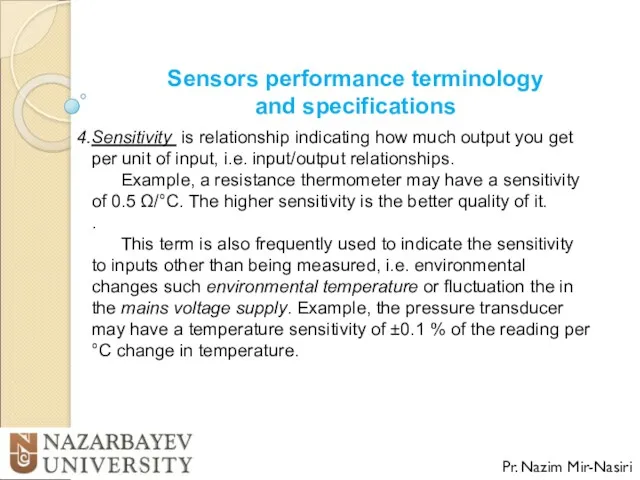
- 5. Sensors performance terminology and specifications Pr. Nazim Mir-Nasiri Sensitivity is relationship indicating how much output you
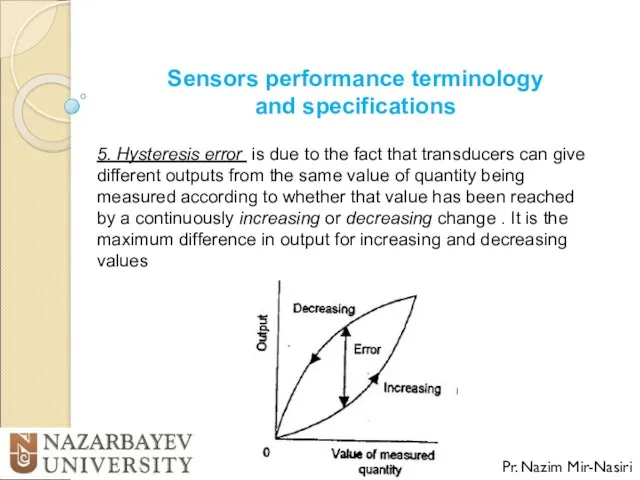
- 6. Sensors performance terminology and specifications Pr. Nazim Mir-Nasiri 5. Hysteresis error is due to the fact
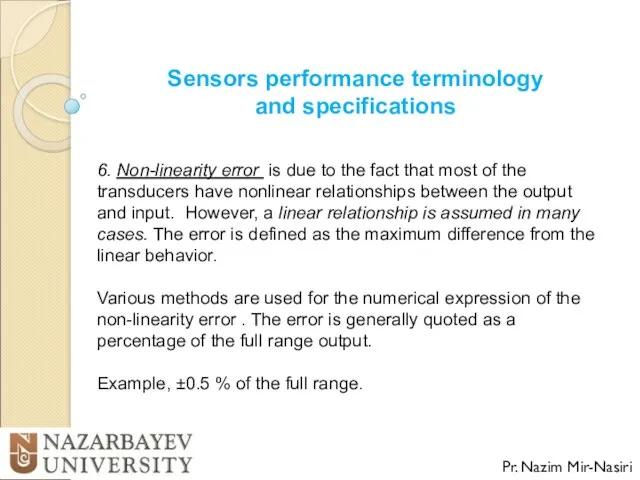
- 7. Sensors performance terminology and specifications Pr. Nazim Mir-Nasiri 6. Non-linearity error is due to the fact
- 8. Sensors performance terminology and specifications Pr. Nazim Mir-Nasiri 6. Non-linearity error a. The error is defined
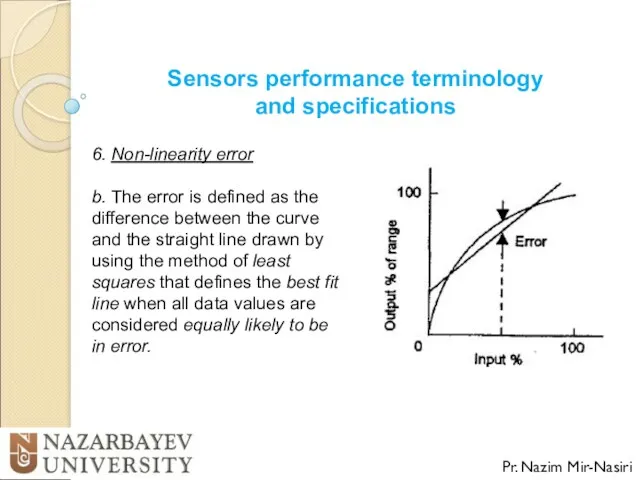
- 9. Sensors performance terminology and specifications Pr. Nazim Mir-Nasiri 6. Non-linearity error b. The error is defined
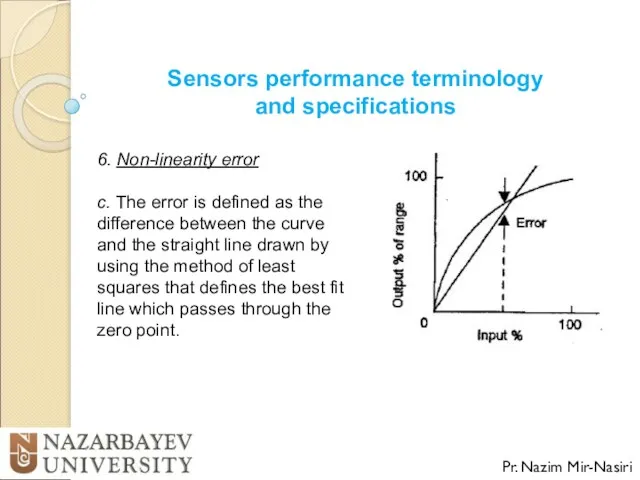
- 10. Sensors performance terminology and specifications Pr. Nazim Mir-Nasiri 6. Non-linearity error c. The error is defined
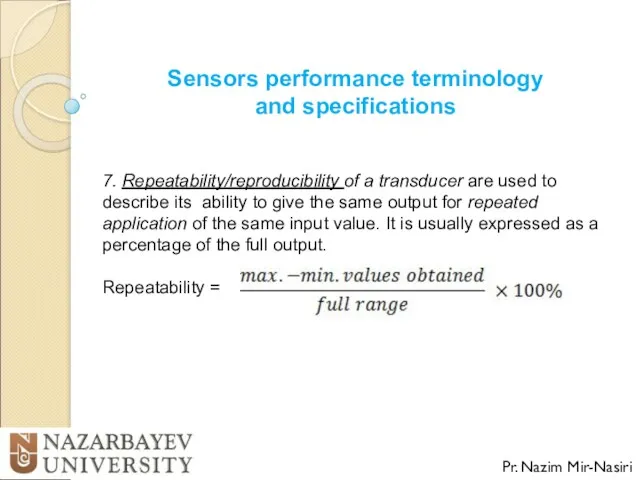
- 11. Sensors performance terminology and specifications Pr. Nazim Mir-Nasiri 7. Repeatability/reproducibility of a transducer are used to
- 12. Sensors performance terminology and specifications Pr. Nazim Mir-Nasiri 8. Stability of a transducer is its ability
- 13. Sensors performance terminology and specifications Pr. Nazim Mir-Nasiri 9. Dead band/time of a transducer is the
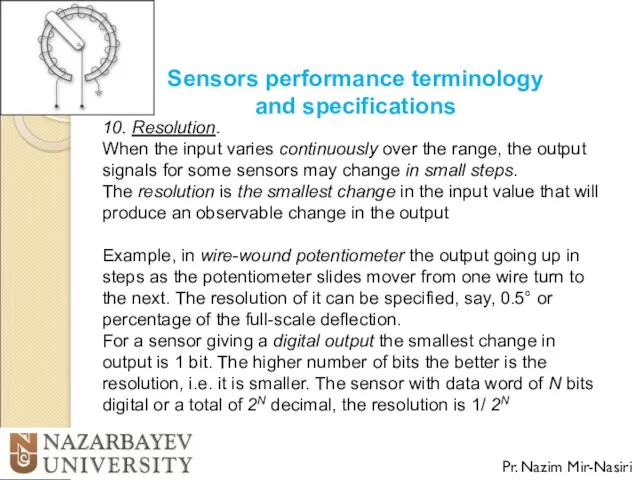
- 14. Sensors performance terminology and specifications Pr. Nazim Mir-Nasiri 10. Resolution. When the input varies continuously over
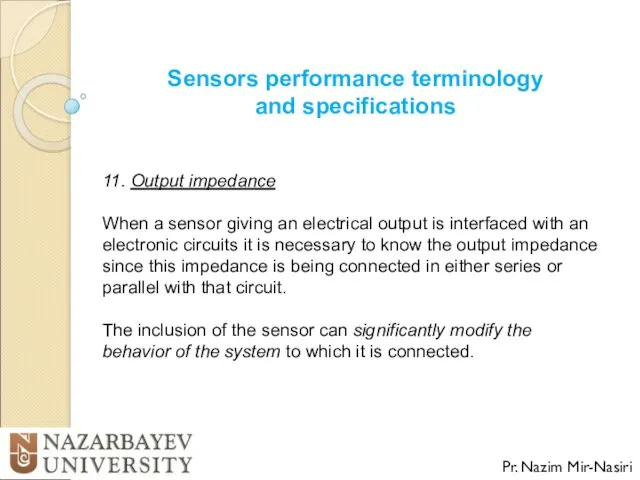
- 15. Sensors performance terminology and specifications Pr. Nazim Mir-Nasiri 11. Output impedance When a sensor giving an
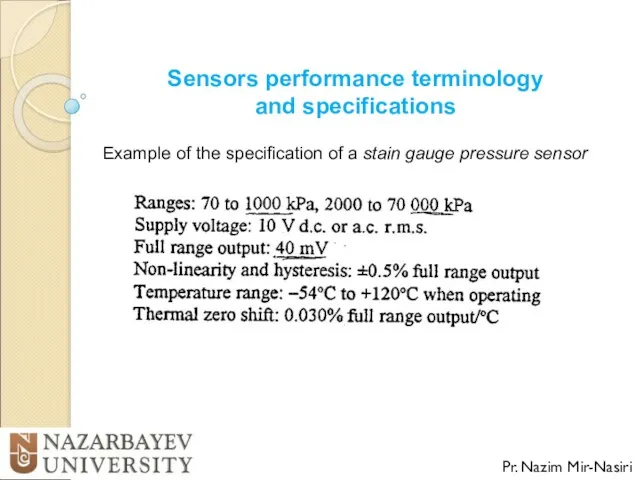
- 16. Sensors performance terminology and specifications Pr. Nazim Mir-Nasiri Example of the specification of a stain gauge
- 17. Static and Dynamic Characteristics of Sensors Pr. Nazim Mir-Nasiri The static characteristics are the values given
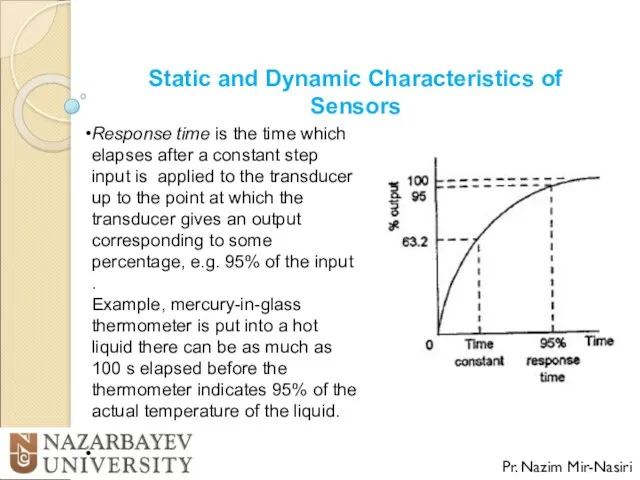
- 18. Static and Dynamic Characteristics of Sensors Pr. Nazim Mir-Nasiri Response time is the time which elapses
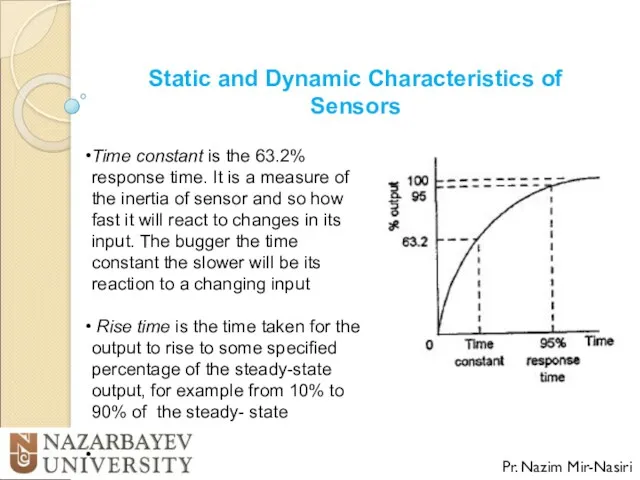
- 19. Static and Dynamic Characteristics of Sensors Pr. Nazim Mir-Nasiri Time constant is the 63.2% response time.
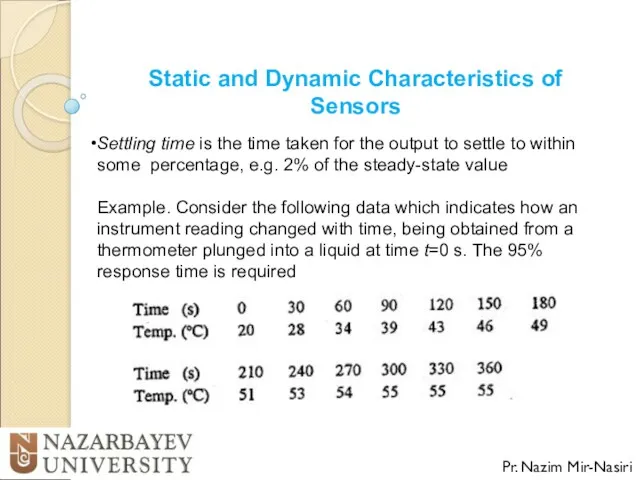
- 20. Static and Dynamic Characteristics of Sensors Pr. Nazim Mir-Nasiri Settling time is the time taken for
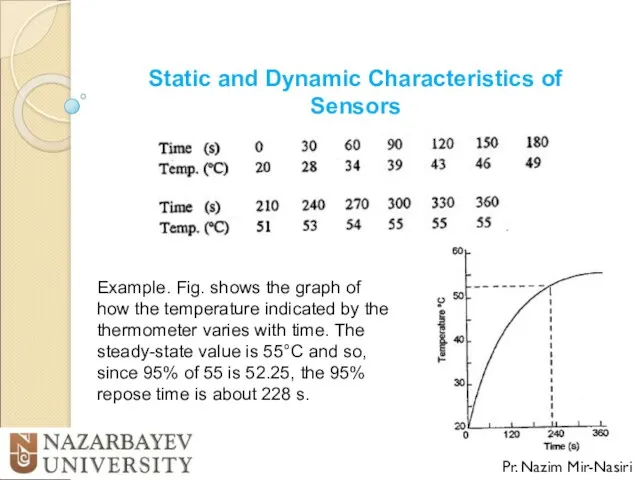
- 21. Static and Dynamic Characteristics of Sensors Pr. Nazim Mir-Nasiri Example. Fig. shows the graph of how
- 23. Скачать презентацию
Sensors and Transducers
(definition)
Pr. Nazim Mir-Nasiri
Sensors are used for an element
Sensors and Transducers
(definition)
Pr. Nazim Mir-Nasiri
Sensors are used for an element
Sensors performance terminology and specifications
Pr. Nazim Mir-Nasiri
Range and span
Sensors performance terminology and specifications
Pr. Nazim Mir-Nasiri
Range and span
Sensors performance terminology and specifications
Pr. Nazim Mir-Nasiri
Accuracy is the extend
Sensors performance terminology and specifications
Pr. Nazim Mir-Nasiri
Accuracy is the extend
Sensors performance terminology and specifications
Pr. Nazim Mir-Nasiri
Sensitivity is relationship indicating
Sensors performance terminology and specifications
Pr. Nazim Mir-Nasiri
Sensitivity is relationship indicating
Sensors performance terminology and specifications
Pr. Nazim Mir-Nasiri
5. Hysteresis error is
Sensors performance terminology and specifications
Pr. Nazim Mir-Nasiri
5. Hysteresis error is
Sensors performance terminology and specifications
Pr. Nazim Mir-Nasiri
6. Non-linearity error is
Sensors performance terminology and specifications
Pr. Nazim Mir-Nasiri
6. Non-linearity error is

Sensors performance terminology and specifications
Pr. Nazim Mir-Nasiri
6. Non-linearity error
a. The
Sensors performance terminology and specifications
Pr. Nazim Mir-Nasiri
6. Non-linearity error
a. The
Sensors performance terminology and specifications
Pr. Nazim Mir-Nasiri
6. Non-linearity error
b. The
Sensors performance terminology and specifications
Pr. Nazim Mir-Nasiri
6. Non-linearity error
b. The
Sensors performance terminology and specifications
Pr. Nazim Mir-Nasiri
6. Non-linearity error
c. The
Sensors performance terminology and specifications
Pr. Nazim Mir-Nasiri
6. Non-linearity error
c. The
Sensors performance terminology and specifications
Pr. Nazim Mir-Nasiri
7. Repeatability/reproducibility of a
Sensors performance terminology and specifications
Pr. Nazim Mir-Nasiri
7. Repeatability/reproducibility of a
Sensors performance terminology and specifications
Pr. Nazim Mir-Nasiri
8. Stability of a
Sensors performance terminology and specifications
Pr. Nazim Mir-Nasiri
8. Stability of a
Sensors performance terminology and specifications
Pr. Nazim Mir-Nasiri
9. Dead band/time of
Sensors performance terminology and specifications
Pr. Nazim Mir-Nasiri
9. Dead band/time of
Sensors performance terminology and specifications
Pr. Nazim Mir-Nasiri
10. Resolution.
When the input
Sensors performance terminology and specifications
Pr. Nazim Mir-Nasiri
10. Resolution.
When the input
Sensors performance terminology and specifications
Pr. Nazim Mir-Nasiri
11. Output impedance
When
Sensors performance terminology and specifications
Pr. Nazim Mir-Nasiri
11. Output impedance
When
Sensors performance terminology and specifications
Pr. Nazim Mir-Nasiri
Example of the specification
Sensors performance terminology and specifications
Pr. Nazim Mir-Nasiri
Example of the specification
Static and Dynamic Characteristics of Sensors
Pr. Nazim Mir-Nasiri
The static characteristics
Static and Dynamic Characteristics of Sensors
Pr. Nazim Mir-Nasiri
The static characteristics
Static and Dynamic Characteristics of Sensors
Pr. Nazim Mir-Nasiri
Response time is
Static and Dynamic Characteristics of Sensors
Pr. Nazim Mir-Nasiri
Response time is
Static and Dynamic Characteristics of Sensors
Pr. Nazim Mir-Nasiri
Time constant is
Static and Dynamic Characteristics of Sensors
Pr. Nazim Mir-Nasiri
Time constant is
Static and Dynamic Characteristics of Sensors
Pr. Nazim Mir-Nasiri
Settling time is
Static and Dynamic Characteristics of Sensors
Pr. Nazim Mir-Nasiri
Settling time is
Static and Dynamic Characteristics of Sensors
Pr. Nazim Mir-Nasiri
Example. Fig. shows
Static and Dynamic Characteristics of Sensors
Pr. Nazim Mir-Nasiri
Example. Fig. shows
 Кулон заңы
 ПРЕЗЕНТАЦИЯ К УРОКУ-ИССЛЕДОВАНИЮ ПОВЕРХНОСТНОЕ НАТЯЖЕНИЕ
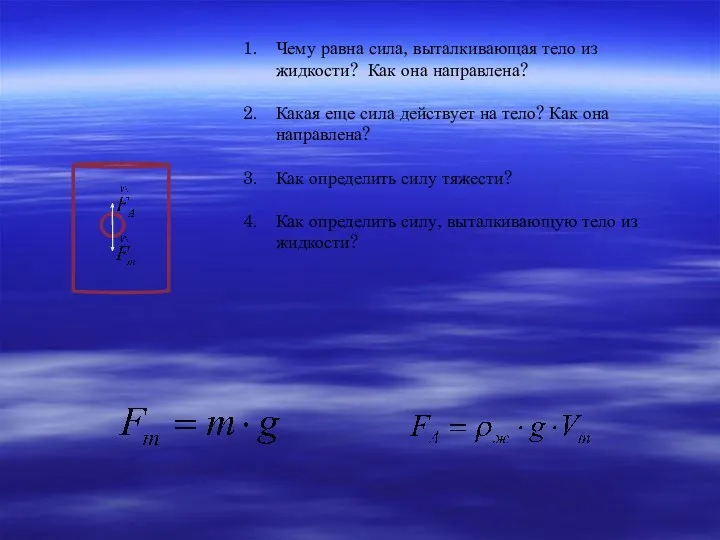 Урок и презентация по теме Плавание тел 7 класс
 Статус-отчет по ремонту Сормовский 3060
 Электростатическое поле. Закон Кулона. Напряженность электростатического поля
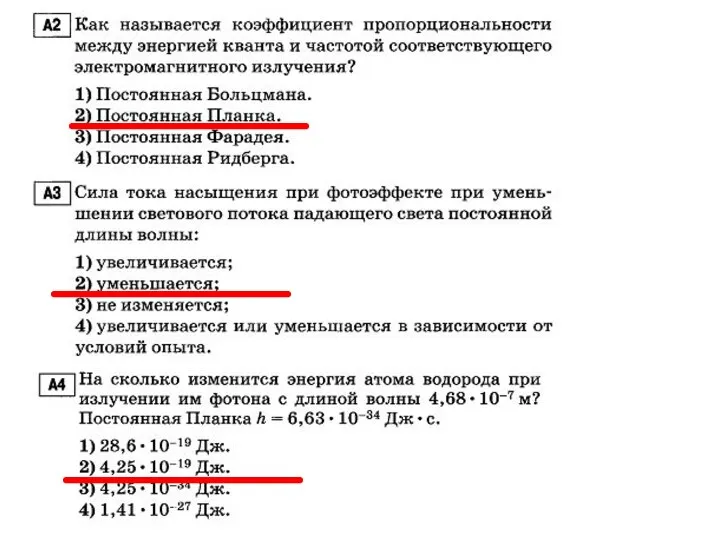 Как называется коэффициент пропорциональности между энергией кванта и частотой соответствующего электромагнитного излучения?
 Цилиндрические прямозубые передачи
 Электромагнитная обстановка на объектах электроэнергетики
 Презентация Через тернии к звёздам
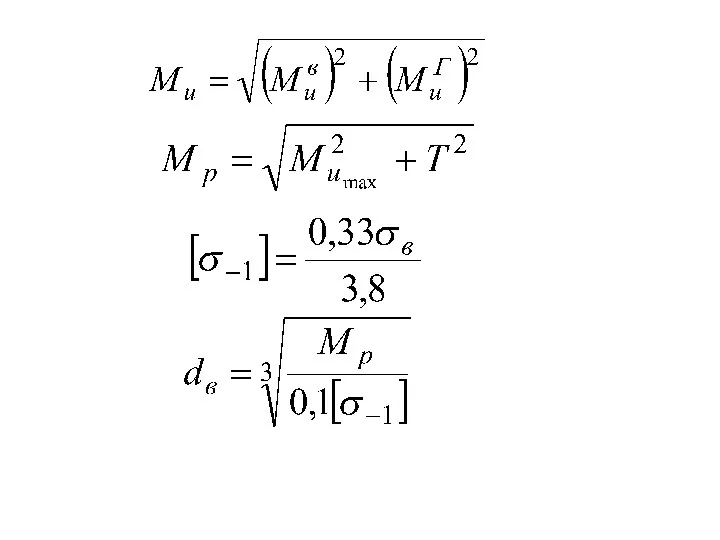 Конструирование валов
 Кинематика. Решение задач
 Нарезание резьбы на металлических деталях
 Реактивное движение и двигатели. Автор Максимова Наталья Сергеевна
 Динамика. Законы Ньютона. 10 класс
 Линза. Виды линз
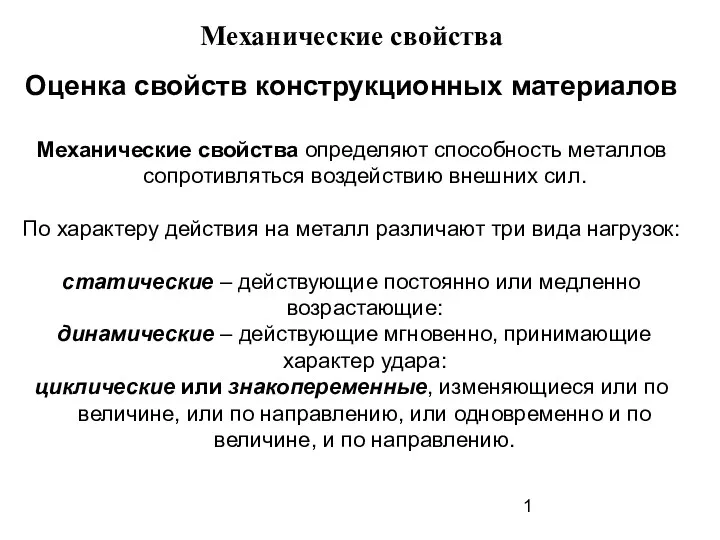 Механические свойства металлов
 Альтернативные виды топлива
 Космические скорости
 Приборы и методы радиометрических измерений
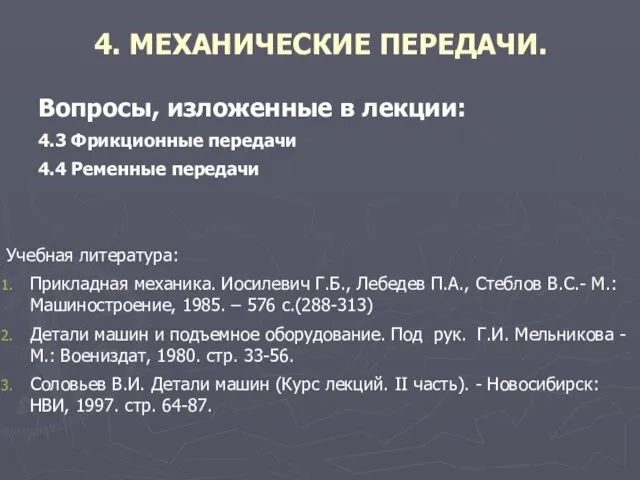 Фрикционные передачи
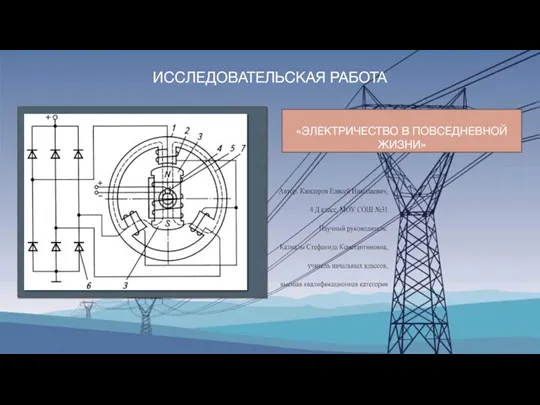 Исследовательская работа Электричество в повседневной жизни
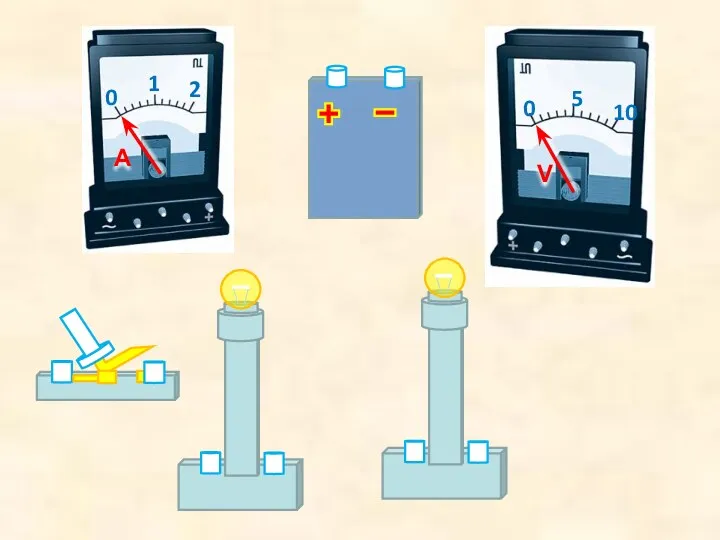 Электрические явления.
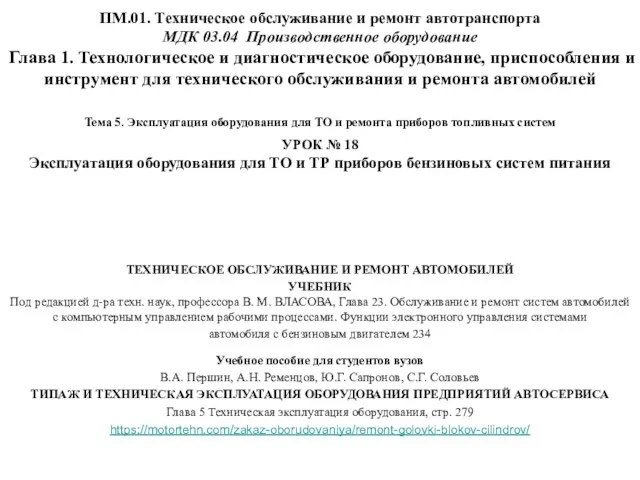 Эксплуатация оборудования для ТО и ТР приборов бензиновых систем питания автомобилей (урок 18)
 Презентация Звук
 Свойства твердых тел
 Начало космической эры и роль ученых нашей страны в изучении вселенной
 Винаходи під час промислового перевороту в Англії
 Типовые примеры сборки узлов и панелей клепанной конструкции